. 2022 Feb 15;11(2):bio058728.
doi: 10.1242/bio.058728. Epub 2022 Feb 17.

Loss of p19Arf promotes fibroblast survival during leucine deprivation

Affiliations

Loss of p19Arf promotes fibroblast survival during leucine deprivation

Kerry C Roby et al. Biol Open. .

Abstract

Fibroblasts are quiescent and tumor suppressive in nature but become activated in wound healing and cancer. The response of fibroblasts to cellular stress has not been extensively investigated, however the p53 tumor suppressor has been shown to be activated in fibroblasts during nutrient deprivation. Since the p19 Alternative reading frame (p19Arf) tumor suppressor is a key regulator of p53 activation during oncogenic stress, we investigated the role of p19Arf in fibroblasts during nutrient deprivation. Here, we show that prolonged leucine deprivation results in increased expression and nuclear localization of p19Arf, triggering apoptosis in primary murine adult lung fibroblasts (ALFs). In contrast, the absence of p19Arf during long-term leucine deprivation resulted in increased ALF proliferation, migration and survival through upregulation of the Integrated Stress Response pathway and increased autophagic flux. Our data implicates a new role for p19Arf in response to nutrient deprivation. This article has an associated First Person interview with the first author of the paper.

Keywords: P19Arf; Autophagy; Fibroblast; Integrated stress response; Leucine deprivation.


Conflict of interest statement

Competing interests The authors declare no competing or financial interests.

Figures

Fig. 1.
Fig. 1.
Loss of P19Arf enhances tumor growth and primary lung fibroblasts induce p19Arf in response to leucine deprivation (LD). (A) Graph of sarcoma (SKPY) tumor volume on the indicated days. SKPY cells were injected into the flank of WT and p19Arf-null mice. Tumor volume was measured by caliper. N=7 mice/WT cohort and N=15 mice/p19Arf−/− cohort. (B) Western blot for p19Arf protein expression in WT and Arf-null fibroblasts after LD for the indicated days. Densitometric quantification of p19Arf protein expression relative to β-tubulin is shown on right. (C) qPCR for p19Arf mRNA in WT or p19Arf−/− fibroblasts during LD for the indicated days. (D) Representative immunofluorescence images for P19Arf subcellular localization on the indicated days after LD in WT or p19Arf−/− ALFs. Quantification of nuclear p19Arf is shown in graph on right. (E) Western blot analysis of phospho-eIF2α (P-eIF2α) and total eIF2α expression in WT and p19Arf-null murine ALFs during LD for the indicated days. Graph quantifies intensity of P-eIF2α expression relative to day 0. β-Tubulin used as loading control. (F) Western blot analysis of P-eIF2α expression in WT and p19Arf−/− ALFs upon treatment with a GCN2 inhibitor (GCN2-IN-1; A-92 1 µM in DMSO) during overnight LD. Actin used as a loading control. Quantification of P-eIF2α expression relative to total eIF2α. N=3; *, P<0.05; ns, not significant.
Fig. 2.
Fig. 2.
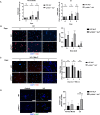
Loss of p19Arf enhances fibroblast proliferation and tumor cell proliferation during leucine deprivation (LD). (A) Quantification of trypan blue negative WT or p19Arf−/− lung fibroblasts on the days indicated after normal media (left) or LD media (right). Fold change is relative to day 0 cell counts. (B) Representative images of EdU uptake (16-h pulse) by WT or p19Arf−/− lung fibroblasts after LD for the indicated days. Scale bars: 50 µm. (C) Representative images of EdU uptake by WT or p19Arf−/− lung fibroblasts during LD plus mitomycin C (Mito C). Fold change is relative to day 0. Scale bars: 50 μm. (D) Quantification of Annexin V+ WT or p19Arf−/−fibroblasts in the presence of complete or LD media. N=3. (E) Representative images of dissociated cells from tumoroids stained for Ki67 Quantification is shown on the right. Scale bars: 50 µm. N=5; *, P<0.05; ***, P<0.001; ns, not significant.
Fig. 3.
Fig. 3.
p19Arf-null fibroblasts show increased activation during leucine deprivation (LD). (A) Representative images and quantification of scratch closure by WT or p19Arf−/− fibroblasts in the presence of complete or LD media. Scratch closure rate was calculated at the indicated times relative to 0 h. N=3, *, P<0.05. (B) Representative images and quantification of fibroblast transwell migration. WT or p19Arf−/− fibroblasts were placed in serum-free media with or without LD in the top chamber of transwells and migrated toward complete serum-containing media in lower chamber. Migration was assessed after 24 h by staining with crystal violet. Quantification of migrated cells per high powered field (hpf) is on right. N=3, *, P<0.05. (C) Representative images and quantification of collagen invasion assays. Fibroblast in serum-free normal or leucine-free media were placed in the top chamber of transwells coated with type 1 rat tail collagen and invaded through the collagen bed toward complete serum-containing media in the lower chamber. Invasion was assessed after 72 h by staining with crystal violet. (D) Quantification of hydroxyproline levels in conditioned media of WT and p19Arf−/− fibroblasts during collagen invasion assays in serum-free media with or without LD. N=3; *, P<0.05; **, P<0.01; ***, P<0.001; ns, not significant; scale bars: 100 μM.
Fig. 4.
Fig. 4.
Loss of p19Arf in fibroblasts increases autophagy during leucine deprivation (LD). (A,B) Western blot analysis of autophagy markers (A) p62 and (B) LC3-I to LC-3II conversion in WT and p19Arf−/− fibroblasts during LD for the indicated days. Cells were treated with bafilomycin (baf) or vehicle for 3 h before harvesting. (C,D) Fibroblast cell numbers in the presence of the autophagy inhibitors (C) chloroquine [100 nM] or (D) bafilomycin [1 nM] during LD for the indicated days. N=3; *, P<0.05; **, P<0.01; ***, P<0.001; not significant.

References

    1. Arandkar, S., Furth, N., Elisha, Y., Nataraj, N. B., van der Kuip, H., Yarden, Y., Aulitzky, W., Ulitsky, I., Geiger, B. and Oren, M. (2018). Altered p53 functionality in cancer-associated fibroblasts contributes to their cancer-supporting features. Proc. Natl. Acad. Sci. U.S.A., 115, 6410-6415. 10.1073/pnas.1719076115 - DOI - PMC - PubMed
    1. Asha, K. and Sharma-Walia, N. (2018). Virus and tumor microenvironment induced ER stress and unfolded protein response: From complexity to therapeutics. Oncotarget 9, 31920-31936. 10.18632/oncotarget.25886 - DOI - PMC - PubMed
    1. B'Chir, W., Maurin, A.-C., Carraro, V., Averous, J., Jousse, C., Muranishi, Y., Parry, L., Stepien, G., Fafournoux, P. and Bruhat, A. (2013). The eIF2α/ATF4 pathway is essential for stress-induced autophagy gene expression. Nucleic Acids Res. 41, 7683-7699. 10.1093/nar/gkt563 - DOI - PMC - PubMed
    1. Battu, S., Minhas, G., Mishra, A. and Khan, N. (2017). Amino acid sensing via general control nonderepressible-2 kinase and immunological programming. Front. Immunol. 8, 1-11. 10.3389/fimmu.2017.01719 - DOI - PMC - PubMed
    1. Beacham, D. A. and Cukierman, E. (2005). Stromagenesis: The changing face of fibroblastic microenvironments during tumor progression. Semin. Cancer Biol. 15, 329-341. 10.1016/j.semcancer.2005.05.003 - DOI - PubMed

Publication types

MeSH terms

Substances