. 2022 Sep 1;24(9):1423-1435.
doi: 10.1093/neuonc/noac003.

IDH-mutated gliomas promote epileptogenesis through d-2-hydroxyglutarate-dependent mTOR hyperactivation

Affiliations

IDH-mutated gliomas promote epileptogenesis through d-2-hydroxyglutarate-dependent mTOR hyperactivation

Armin Mortazavi et al. Neuro Oncol. .

Abstract

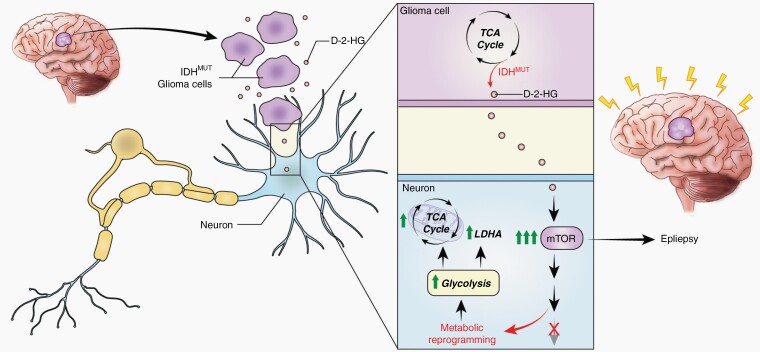
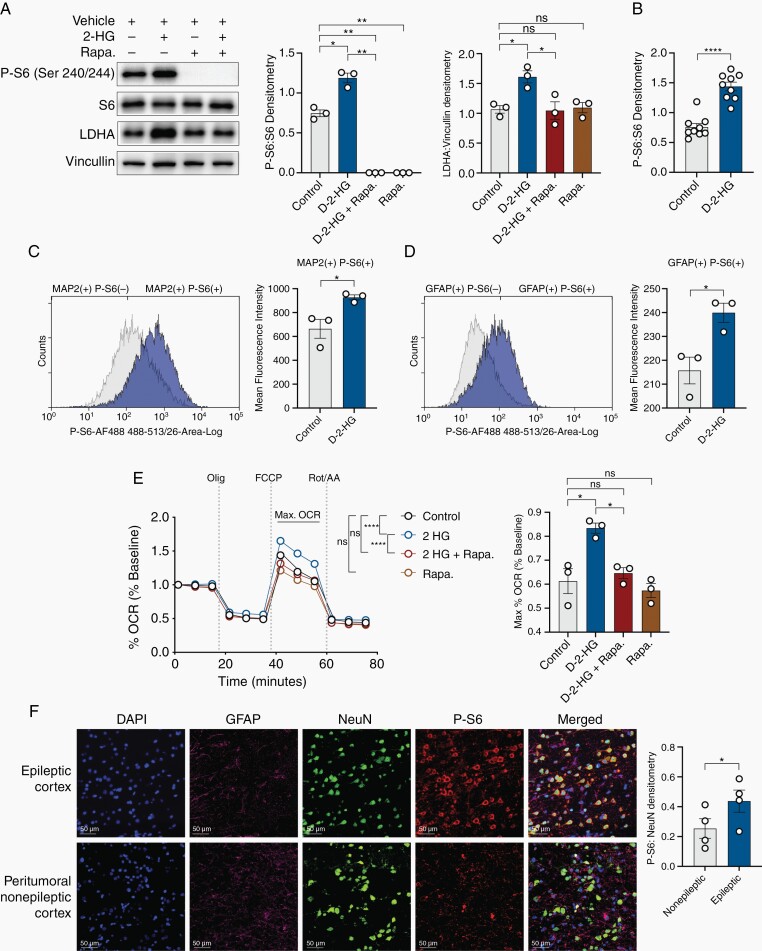
Background: Uncontrolled seizures in patients with gliomas have a significant impact on quality of life and morbidity, yet the mechanisms through which these tumors cause seizures remain unknown. Here, we hypothesize that the active metabolite d-2-hydroxyglutarate (d-2-HG) produced by the IDH-mutant enzyme leads to metabolic disruptions in surrounding cortical neurons that consequently promote seizures.

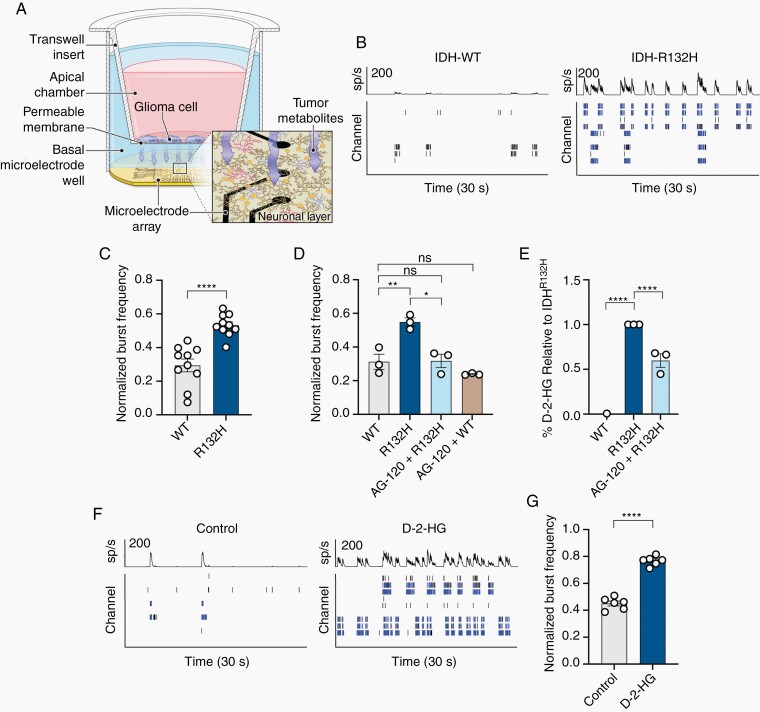
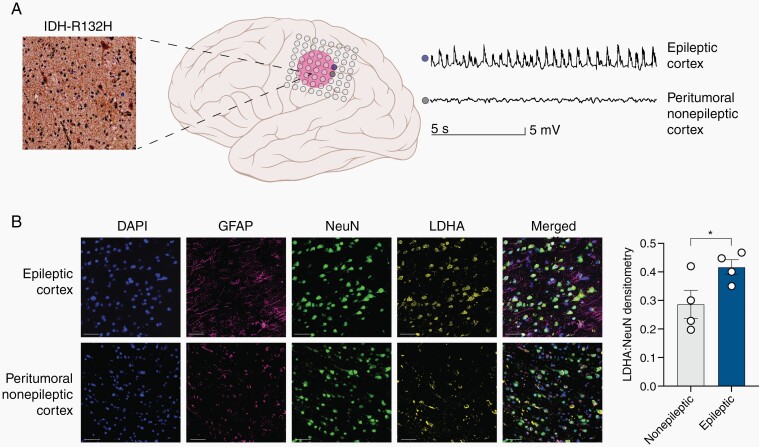
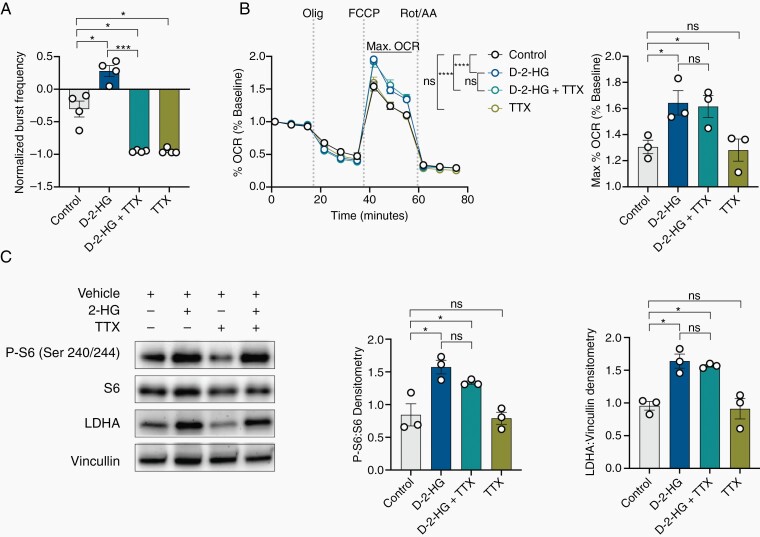
Methods: We use a complementary study of in vitro neuron-glial cultures and electrographically sorted human cortical tissue from patients with IDH-mutant gliomas to test this hypothesis. We utilize micro-electrode arrays for in vitro electrophysiological studies in combination with pharmacological manipulations and biochemical studies to better elucidate the impact of d-2-HG on cortical metabolism and neuronal spiking activity.

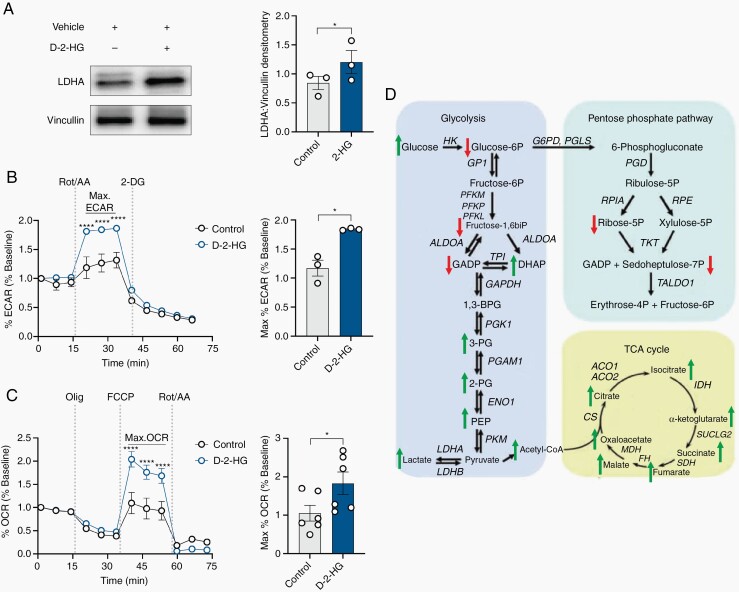
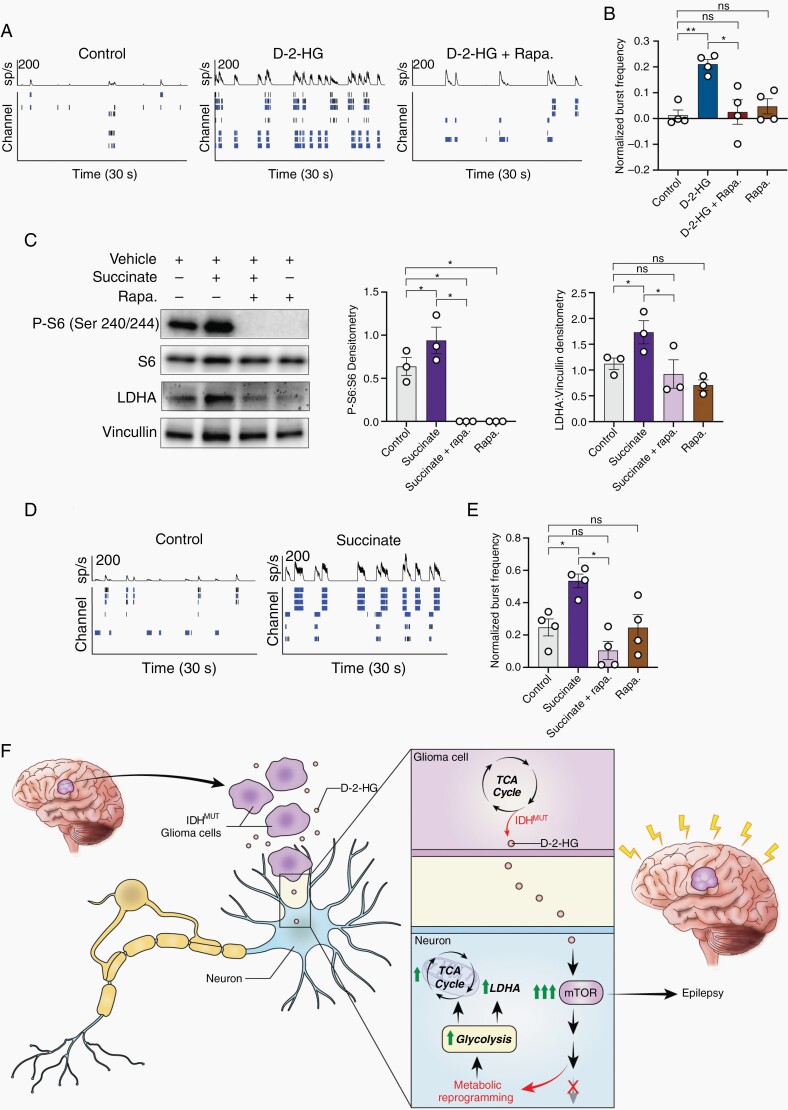
Results: We demonstrate that d-2-HG leads to increased neuronal spiking activity and promotes a distinct metabolic profile in surrounding neurons, evidenced by distinct metabolomic shifts and increased LDHA expression, as well as upregulation of mTOR signaling. The increases in neuronal activity are induced by mTOR activation and reversed with mTOR inhibition.

Conclusion: Together, our data suggest that metabolic disruptions in the surrounding cortex due to d-2-HG may be a driving event for epileptogenesis in patients with IDH-mutant gliomas.

Keywords: D-2-HG; IDH-mutated gliomas; Tumor-related epilepsy; mTOR.


Figures

Graphical Abstract
Graphical Abstract
Fig. 1
Fig. 1
IDH-mutated tumors promote epileptogenesis via d-2-HG. (A) Schematic demonstrating interactions through media of glioma cell line cultured on trans-well and cortical rat neurons and astrocytes cultured on a MEA. (B) Thirty second raster plots (bottom) and spike histograms (top) of spiking activity in eight electrode channels in a single well. Right, IDHR132H induces greater number of bursts (blue bars) compared to IDHWT. (C) Normalized burst frequency demonstrating increased bursting activity of neurons interacting with IDHR132H compared to IDHWT (n = 10, t(18) = 5.524, P < .0001, paired t test). (D) Increased bursting activity following interaction with IDHR132H is corrected with inhibition of IDH mutation with AG-120 (n = 3; WT vs AG-120 + WT, t(2) = 1.631, P = .2445, paired t test; WT vs R132H, t(2) = 11.18, P = .0079, paired t test; R132H vs AG-120 + R132H, t(2) = 9.564, P = .0108, paired t test; WT vs AG-120 + R132H, t(2) = 0.1542, P = .8916, paired t test). (E) d-2-HG assay of the media demonstrating increased d-2-HG in the media in the presence of IDHR132H cells, which is reduced with AG-120 (n = 3; WT vs R132H, t(4) = 21.10, P < .0001, paired t test; WT vs AG-120 + R132H, t(4) = 19.95, P < .0001, paired t test; R132H vs AG-120 + R132H, t(4) = 5.637, P = .0049, paired t test). (F) Spike histogram and raster plot of control (left) and d-2-HG (right) treated cortical rat culture. (G) Normalized burst frequency of cortical rat neurons treated with control (PBS) and d-2-HG (n = 6, t(5) = 12.01, P < .0001, paired t test).
Fig. 2
Fig. 2
d-2-HG induces metabolic reprogramming in cortical tissue. (A) Western blot probing for LDH-A expression in control and d-2-HG-treated cortical rat neurons along with Densitometry analysis across three biological replicates (n = 3, t(2) = 4.534, P = .0454, paired t-test). (B) Maximal glycolytic rate (max ECAR) is significantly higher in d-2-HG-treated neurons compared to control (F(10,231) = 7.288, P < .0001, Two-way ANOVA with Sidak’s multiple-comparisons test). Averaged across time points exhibiting maximal glycolytic rate, ECAR is significantly higher in the d-2-HG treated neurons (n = 3, t(2) = 5.107, P = .0363, paired t-test). (C) Max oxidative consumption rate (OCR) is significantly higher in d-2-HG-treated neurons compared to control (F(11,522) = 8.430, P < .0001, Two-way ANOVA with Sidak’s multiple-comparisons test). Averaged across time points exhibiting maximal respiration, max OCR is significantly higher in d-2-HG treated neurons compared to control (n = 3, t(2) = 2.927, P = .0327, paired t-test). (D) Schematic representation of the enzymatic reactions from glycolysis, PPP, and TCA cycle highlighting the changes at the metabolite levels between control and d-2-HG treated cortical rat cultures through over-representation analysis. Up arrows (red) and down arrows (green) denote increased or decreased, respectively, enrichment comparing d-2-HG relative to control-treated cortical rat neurons.
Fig. 3
Fig. 3
The epileptic human cortex demonstrates upregulation of LDHA compared to the nonepileptic cortex. (A) Diagram demonstrating epileptic cortex (blue electrode) and peritumoral nonepileptic cortex (grey electrode) in the setting of the IDH mutant glioma determined via intracranial EEG monitoring. The glioma stained positive for IDH (R132H) mutation. This patient had a WHO Grade III Astrocytoma IDH-mutant. (B) Multiplex immunofluorescence staining for DAPI (blue), NeuN (green), GFAP (purple), and LDH-A (yellow) of the peritumoral nonepileptic cortex and epileptic cortex demonstrating increased LDH-A expression primarily in neurons. DAPI is a control nuclear DNA stain, GFAP stains astrocytes, NeuN stains neurons, and LDH-A, the metabolic enzyme of interest. LDH-A co-staining with NeuN is significantly increased in the epileptic cortex compared to the peritumoral nonepileptic cortex (n = 4, t(3) = 3.799, P = .0320, paired t-test).
Fig. 4
Fig. 4
d-2-HG induces mTOR hyperactivation in cortical tissue and mTOR inhibition corrects aspects of metabolic reprogramming. (A) Western blot analysis demonstrates that d-2-HG upregulates P-S6:S6 (n = 3, control vs d-2-HG, t(2) = 6.193, P = .0251, paired t test). mTOR inhibition results in loss of P-S6 expression (n = 3, control vs d-2-HG + rapa., t(2) = 17.58, P = .0032, paired t test; d-2-HG vs d-2-HG + rapa., t(2) = 19.55, P = .0026, paired t test; control vs rapa., t(2) = 17.58, P = .0032, paired t test). d-2-HG increases LDHA expression (n = 3, control vs d-2-HG, t(2) = 4.886, P = .0394), which is corrected with rapamycin (n = 3, control vs d-2-HG + Rapa., t(2) = 0.2288, P = .8403, d-2-HG vs d-2-HG + rapa., Fig. 4 (Continued) t(2) = 4.467, P = .0466). Rapamycin does not decrease LDHA protein expression relative to control (n = 3, control vs Rapa., t(2) = 0.2302, P = .8393). (B) Cumulative P-S6:S6 across nine biological replicates demonstrates d-2-HG increases mTOR signaling in the cortical culture (n = 9, t(8) = 8.207, P < .0001, paired t test). (C) Flow cytometry example (left) demonstrating histogram of MAP2(+) cells and P-S6(+) and P-S6(–). Mean fluorescence intensity in MAP2(+) P-S6(+) cells increases across cultures treated with d-2-HG compared to control (n = 3; t(2) = 4.541, P = .0452, paired t-test). (D) Flow cytometry example (left) demonstrating histogram of GFAP(+) cells and P-S6(+) and P-S6(–). Mean fluorescence intensity in GFAP(+) P-S6(+) cells increases across cultures treated with d-2-HG compared to control (n = 3; t(2) = 15.05, P = .0044, paired t-test). (E) Max OCR is higher in d-2-HG treated neurons, but is corrected to control levels with co-treatment of rapamycin. Rapamycin treatment alone did not affect OCR compared to control (F(33, 528) = 10.53, P < .0001, Two-way ANOVA with Sidak’s multiple comparisons test). Averaged across time points exhibiting maximal respiration, max OCR is significantly higher in d-2-HG treated neurons compared to control, but this is corrected with treatment with rapamycin (n = 3; control vs d-2-HG, t(2) = 7.240, P = .0185, paired t test; d-2-HG vs d-2-HG + rapa., t(2) = 4.687, P = .0426, paired t test; control vs d-2-HG + rapa., t(2) = 0.5274, P = .6506, paired t test; control vs rapa., t(2) = 0.4957, P = .6692, paired t test). (F) Multiplex immunofluorescence staining for DAPI (blue), NeuN (green), GFAP (purple), and P-S6 (red) of peritumoral nonepileptic cortex and epileptic cortex demonstrating increased LDH-A expression primarily in neurons. P-S6 co-staining with NeuN is significantly increased in the epileptic cortex compared to the peritumoral nonepileptic cortex (n = 4, t(3) = 5.756, P = .0104, paired t test).
Fig. 5
Fig. 5
d-2-HG induces mTOR upregulation and metabolic reprogramming independent of neuronal bursting. (A) Tetrodotoxin (TTX) silences all neuronal firing compared to control (n = 4, t(3) = 5.792, P = .0102, paired t test) even with co-treatment of d-2-HG (n = 4; control vs d-2-HG + TTX, t(3) = 5.312, P = .0130, paired t test; d-2-HG vs d-2-HG +TTX, t(3) = 16.06, P = .0005, paired t test). d-2-HG without TTX increases normalized burst frequency compared to control (n = 4, t(3) = 4.164, P = .0252, paired t test). (B) d-2-HG increases maximal respiration compared to control and in the setting of TTX (n = 4, F(33, 356) = 5.319, P < .0001, ns: not significant, Two-way ANOVA with Sidak’s multiple comparisons test). (C) Averaged across time points exhibiting maximal respiration, d-2-HG increases max OCR compared to control (n = 3, t(2) = 5.719, P = .0292, paired t test) even with neuronal silencing in the presence of TTX (n = 3, t(2) = 0.2604, P = .8189, paired t test). TTX did not change maximal respiration compared to control (n = 3, t(2) = 0.5140, P = .6584, paired t test). C) Western blot analysis demonstrates that d-2-HG continues to upregulate P-S6:S6 (n = 3, control vs d-2-HG + TTX, t(2) = 3.413, P = .0454, paired t test) and LDHA:Vinculin (n = 3, mean ±SEM, control vs d-2-HG + TTX, t(2) = 12.56, P = .0063, paired t test) in the setting of TTX.
Fig. 6
Fig. 6
Metabolites d-2-HG and succinate causes neuronal hyperexcitability in an mTOR-dependent manner. A) Spike histogram and raster plot of control (left), d-2-HG (middle), and d-2-HG and rapamycin (left) treated cortical rat neurons. B) Normalized burst frequency of cortical rat Fig. 6 (Continued) neurons treated with control (PBS), d-2-HG, d-2-HG and rapamycin, and rapamycin. d-2-HG treated neurons significantly increase normalized burst frequency compared to control (n = 4, t(3) = 6.942, P = .0061, paired t test) and d-2-HG + Rapa. (n = 4, t(3) = 4.574, P = .0196, paired t test). Additionally, d-2-HG and rapamycin treated neurons have similar normalized burst frequency compared to control (n = 4, t(3) = 0.3735, P = .7336, paired t test). Rapamycin alone does not significantly decrease normalized burst frequency compared to control (n = 4, t(3) = 1.249, P = .3004, paired t test). (C) Succinate significantly upregulates P-S6:S6 (n = 3, control vs Succinate, t(2) = 5.393, P = .0327, paired t test), surrogate marker for mTOR signaling. This increase is inhibited with rapamycin (n = 3; control vs Succinate + rapa., t(2) = 6.109, P = .0258, paired t test; Succinate vs Succinate + rapa., t(2) = 6.094, P = .0259; control vs rapa., t(2) = 6.109, P = .0258, paired t test). Succinate also increases LDHA protein expression (n = 3, control vs Succinate, t(2) = 4.386, P = .0482, paired t test), which is corrected with rapamycin to control levels (n = 3,control vs Succinate + rapa., t(2) = 0.8713, P = .4754, paired t test; Succinate vs Succinate + rapa., t(2) = 6.920, P = .0202, paired t test; control vs rapa., t(2) = 2.893, P = .1016, paired t test). (D) An example spike raster demonstrating that treatment with succinate results in increased bursting activity compared to control. (E) Across cultures, succinate increases normalized burst frequency compared to control following 7-day treatment (n = 4, t(3) = 3.475, P = .0402, paired t test). This increase is corrected to control levels with co-treatment of rapamycin (n = 4; control vs Succinate + rapa., t(3) = 2.633, P = .0781, paired t test; Succinate vs Succinate + rapa., t(3) = 4.755, P = .0177, paired t test; control vs rapa., t(3) = 0.01238, P = .9909, paired t test). (F) Proposed mechanism: IDH-mutated gliomas produce d-2-HG, which is released into the peritumoral environment. d-2-HG upregulates mTOR signaling in surrounding neurons, leading to metabolic reprogramming and epileptogenesis.

Comment in

References

    1. Chen H, Judkins J, Thomas C, et al. . Mutant IDH1 and seizures in patients with glioma. Neurology. 2017;88(19):1805–1813. - PMC - PubMed
    1. Duan WC, Wang L, Li K, et al. . IDH mutations but not TERTp mutations are associated with seizures in lower-grade gliomas. Medicine (Baltim). 2018;97(50):e13675. - PMC - PubMed
    1. Huberfeld G, Vecht CJ. Seizures and gliomas—towards a single therapeutic approach. Nat Rev Neurol. 2016;12(4):204–216. - PubMed
    1. Stockhammer F, Misch M, Helms HJ, et al. . IDH1/2 mutations in WHO grade II astrocytomas associated with localization and seizure as the initial symptom. Seizure 2012;21(3):194–197. - PubMed
    1. Andronesi OC, Kim GS, Gerstner E, et al. . Detection of 2-hydroxyglutarate in IDH-mutated glioma patients by in vivo spectral-editing and 2D correlation magnetic resonance spectroscopy. Sci Transl Med. 2012;4(116):116ra–11114. - PMC - PubMed

Publication types