

Exosome-like nanoparticles from Mulberry bark prevent DSS-induced colitis via the AhR/COPS8 pathway
- PMID: 34994476
- PMCID: PMC8892346
- DOI: 10.15252/embr.202153365
Exosome-like nanoparticles from Mulberry bark prevent DSS-induced colitis via the AhR/COPS8 pathway
Abstract
Bark protects the tree against environmental insults. Here, we analyzed whether this defensive strategy could be utilized to broadly enhance protection against colitis. As a proof of concept, we show that exosome-like nanoparticles (MBELNs) derived from edible mulberry bark confer protection against colitis in a mouse model by promoting heat shock protein family A (Hsp70) member 8 (HSPA8)-mediated activation of the AhR signaling pathway. Activation of this pathway in intestinal epithelial cells leads to the induction of COP9 Constitutive Photomorphogenic Homolog Subunit 8 (COPS8). Utilizing a gut epithelium-specific knockout of COPS8, we demonstrate that COPS8 acts downstream of the AhR pathway and is required for the protective effect of MBELNs by inducing an array of anti-microbial peptides. Our results indicate that MBELNs represent an undescribed mode of inter-kingdom communication in the mammalian intestine through an AhR-COPS8-mediated anti-inflammatory pathway. These data suggest that inflammatory pathways in a microbiota-enriched intestinal environment are regulated by COPS8 and that edible plant-derived ELNs may hold the potential as new agents for the prevention and treatment of gut-related inflammatory disease.
Keywords: AhR; COP9/COPS8; Mulberry bark derived exosome-like nanoparticles; anti-microbial peptides; heat shock protein family A (Hsp70) member 8; inflammation.
© 2022 The Authors.
Conflict of interest statement
The authors declare that they have no conflict of interest.
Figures
- A
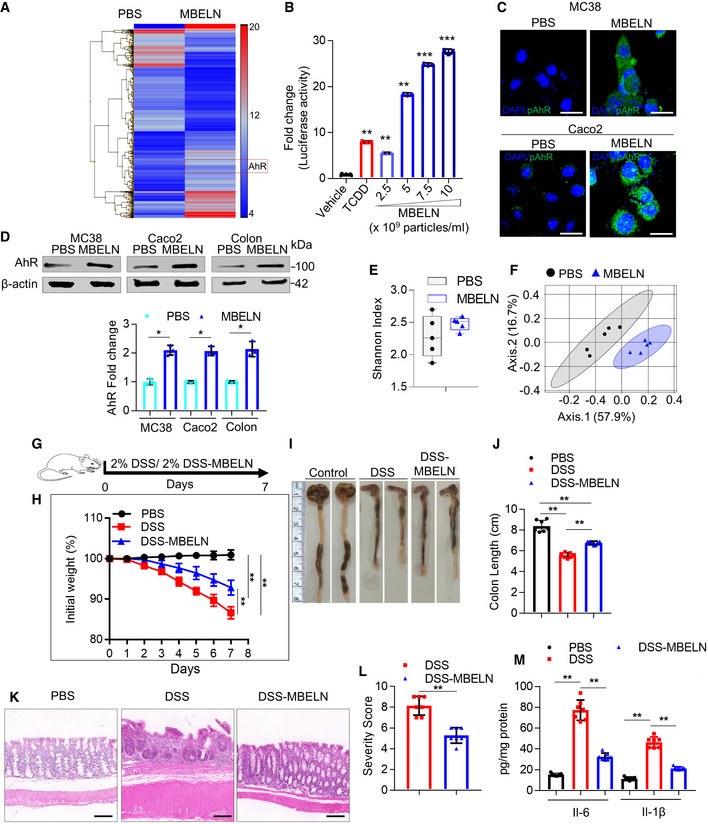
Mice were orally administered with mulberry bark‐derived exosome‐like nanoparticles (MBELNs) (10 × 109 particles/100 µl/mouse) or phosphate‐buffered saline (PBS) for 7 days. Heat map showing influence of MBELNs on colonic gene expression from three biological replicates.
- B
In vitro assessment of MBELN‐dependent induction of aryl hydrocarbon receptor (AhR) promoter using HEPA1.1 cells (contain AhR responsive luciferase reporter construct). Data are mean ± SEM from three biological replicates. **P < 0.01, ***P < 0.001 using one‐way ANOVA.
- C
Representative images showing expression of pAhR in MC38 cells and Caco2 cells treated with MBELNs from three biological replicates. Scale bar 20 μm.
- D
Western blot (top) and graphical representation of fold changes (bottom) for AhR in MC38 cells, Caco2 cells, and colon epithelial cells after treatment with MBELNs. Data are mean ± SEM of three biological replicates. *P < 0.05 using Student’s t‐test.
- E
Fecal microbiota were analyzed following administration of MBELNs (10 × 109 particle/100 µl/dose/day/mouse) for 7 days to C57BL/6 mice. Alpha diversity (Shannon index) was calculated at the family level and is displayed as a bar‐and‐whiskers plot for each individual combination of control and MBELN treatment. The center line represents the median and the box encloses the 1st and 3rd quartiles (“hinges”). The upper and lower whiskers represent the furthermost points from the respective hinges, which are no more than 1.5 interquartile ranges from the hinge. The individual points are overlaid. Data are presented from five mice or biological replicates.
- F
Beta diversity analysis, biplots samples (points), and bacterial taxa at family level (axes) are simultaneously projected on the two‐dimensional canonical axes (CA1 and CA2). Data are presented from five mice or biological replicates.
- G
Pictorial representation of dextran sulfate sodium (DSS; 2%)‐induced colitis development in mice.
- H
Graph showing loss of weight following DSS‐induced colitis with and without MBELN treatment. Data are mean ± SEM of seven biological replicates, **P < 0.01 using Mann–Whitney test.
- I
Representative image showing changes in colon morphology and length following DSS‐induced colitis with concurrent treatment with MBELNs.
- J
Column graph showing changes in colon length. Data are mean ± SEM from seven biological replicates, **P < 0.01 using one‐way ANOVA.
- K, L
Hematoxylin and eosin (HE) staining to show histological changes in colon tissue (left) and a graph showing severity score (right) based on histological data. Scale bar 200 μm. Data are mean ± SEM of seven biological replicates, **P < 0.01 using Student’s t‐test.
- M
Enzyme‐linked immunosorbent assay (ELISA) for interleukin (IL)‐6 and IL‐1β from colon tissue. Data are mean ± SEM from seven biological replicates, **P < 0.01 using one‐way ANOVA.
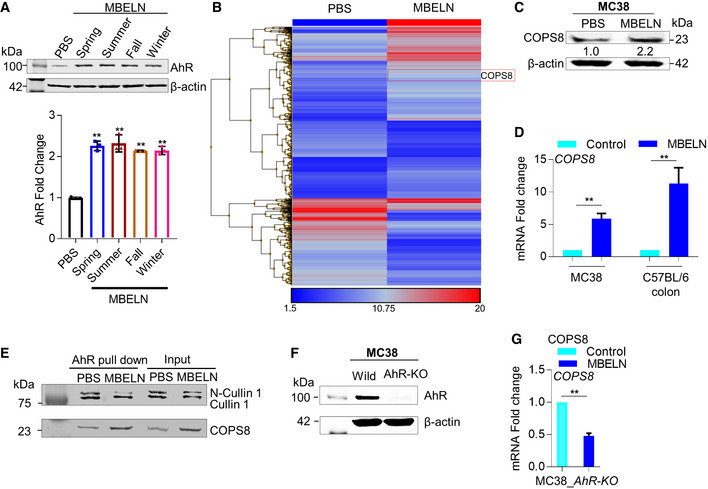
To test the reproducibility of mulberry bark‐derived exosome‐like nanoparticles (MBELN) collected during different seasons of the year, MBELNs were extracted in spring, summer, fall, and winter and used to treat MC38 cells to evaluate AhR expression. Data are mean ± SEM from three biological replicates per group. **P < 0.01 using one‐way ANOVA.
Heat map showing gene influences in crypts of villi in C57BL/6J mice. Data shown are from three technical replicates.
Western blot for COP9/COP9 Constitutive Photomorphogenic Homolog Subunit 8 (COPS8) in MC38 cells following MBELN treatment. Data shown are from three biological replicates.
mRNA expression of COPS8 in MC38 and after MBELN administration and C57BL/6J colon epithelial cells following MBELN administration for 7 days. Data are mean ± SEM from three biological replicates per group. **P < 0.01 using Student’s t‐test.
MC38 cells treated with MBELN and protein extract were immunoprecipitated using anti‐aryl hydrocarbon receptors (AhR) antibody. The precipitate was subjected to Western blot with antibody against Cullin 1 (CUL1) and COPS8. Data shown are from three biological replicates.
Western blot to confirm knockout of AhR in MC38 cells. Data shown are from three biological replicates.
COPS8 mRNA expression in AhR‐knockout (AhR‐KO) MC38 cells following treatment with MBELNs. Data are mean ± SEM from three biological replicates per group. **P < 0.01 using Student’s t‐test.
- A
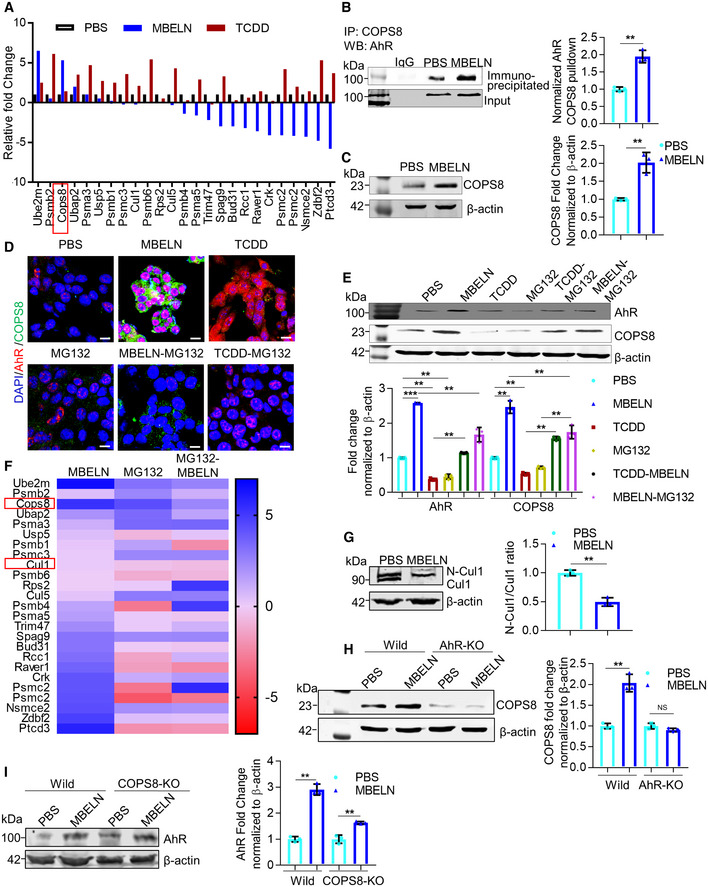
Mass spectrometry (MS) analysis of aryl hydrocarbon receptor (AhR) pulldown protein from mulberry bark‐derived exosome‐like nanoparticles (MBELNs) and 2,3,7,8‐tetrachlorodibenzo‐p‐dioxin (TCDD)‐treated MC38 cell lysate. Data from three technical replicates are shown.
- B
Co‐immunoprecipitation of COP9/COP9 Constitutive Photomorphogenic Homolog Subunit 8 (COPS8) bound AhR from MC38 cell lysate treated with MBELNs. Data are mean ± SEM from three biological replicates, **P < 0.01 using Student’s t‐test.
- C
Western blot analysis showing expression of COPS8 in mice ileum crypts. Data are mean ± SEM of three biological replicates, **P < 0.01 using Student’s t‐test.
- D
Representative images showing effect of MBELNs with and without TCDD (1 nm)/ carbobenzoxy‐Leu‐Leu‐leucinal (MG132; 20 µM) on co‐expression of AhR and COPS8 using immunofluorescence. Scale bar 10 μm, images are from three biological replicates.
- E
Western blot showing MBELNs, TCDD, and MG132 effect on co‐expression of AhR and COPS8. The data represent as mean ± SEM from three biological replicates **P < 0.01, ***P < 0.001 using one‐way ANOVA.
- F
Heat map showing MS analysis of AhR pulldown protein from MC38 cells treated with MBELNs in combination with proteasome inhibitor, MG132. Data are represented from three technical replicates.
- G
Expression of Cullin 1 (CUL1) and neddylated CUL1 (N‐CUL1) following MBELN treatment using Western blot. Data are mean ± SEM from three biological replicates. **P < 0.01 using Student’s t‐test.
- H, I
Western blot showing expression of COPS8 in wild‐type (Wild) and AhR‐KO MC38 cells and expression of AhR in wild and COPS8‐KO MC38 cells. MC38 cells were KO using CRISPR/ CAS9 KO plasmid transfection.
- A
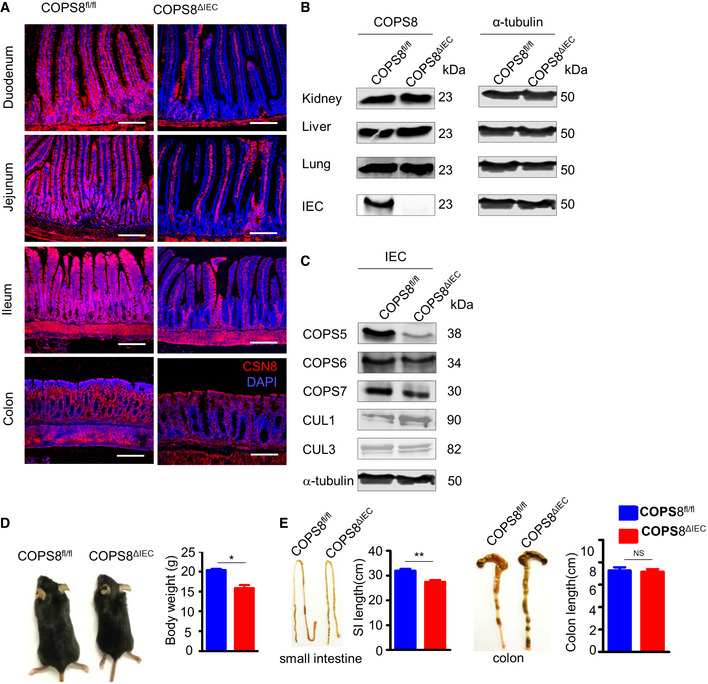
Immunofluorescence analysis of COPS8 protein expression with anti‐COPS8 antibody (red) and with DAPI (blue) in the duodenum, jejunum, ileum, and colon from Villin‐Cre and COPS8‐lox alleles expressing (COPS8fl / fl ) and knockout COPS8 in IEC (COPS8ΔIEC ) mice. Scale bar, 100 μm, data are represented from seven biological replicates per genotype.
- B, C
Immunoblot analysis of COPS8 protein expression in the liver, kidney, lung, and IECs isolated from ileum of COPS8fl / fl and COPS8ΔIEC mice and analysis of the associated proteins (COPS5, COPS6, COPS7, Cullin (CUL) 1 and 3) in lysates prepared from isolated IECs from COPS8fl / fl and COPS8ΔIEC mice. Data are represented from seven biological replicates per genotype.
- D
Body size (representative pictures, left) and weight (right) of COPS8fl / fl and COPS8ΔIEC mice at 4 weeks of age. Data are represented as mean ± SEM from seven biological replicates per genotype. *P < 0.05, NS—non‐significant using Student’s t‐test.
- E
Length of small intestine and colon from COPS8fl / fl and COPS8ΔIEC mice. Data are represented as mean ± SEM from seven biological replicates per genotype. **P < 0.01, NS—non‐significant using Student’s t‐test.
- A
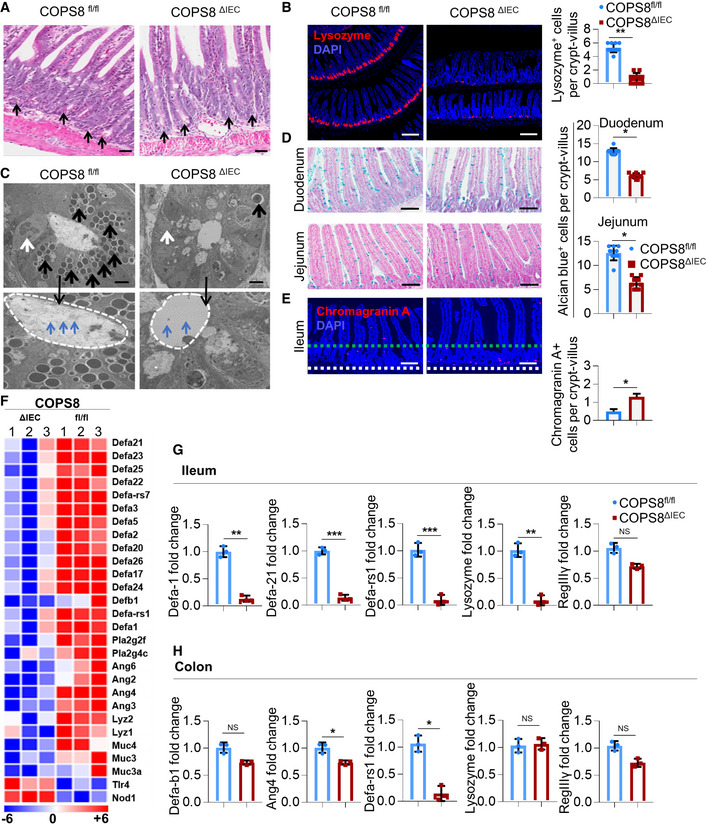
Representative hematoxylin and eosin (HE) staining of ileum. Paneth cells with typical eosinophilic granules (black arrows) on HE‐stained sections at the base of crypts in Villin‐Cre and COPS8‐lox alleles expressing (COPS8fl / fl ), but not COPS8 knockout (KO) (COPS8ΔIEC ) epithelium. Scale bar 50 μm, n = 7 biological replicate per genotype.
- B
The granule protein, lysozyme, was examined by immunofluorescence (Red) and counted in the ileum of COPS8fl/fl and COPS8ΔIEC mice (scale bar 100 μm). The column graph represents number of lysozyme+ cells presented as mean ± SEM from seven biological replicates. **P < 0.01 using Student’s t‐test.
- C
Transmission electron microscopy (TEM) of crypts of COPS8fl/fl and COPS8ΔIEC mice. The base of the crypt in COPS8ΔIEC mice is occupied by poorly differentiated columnar epithelial cells that lack secretory granules, rudimentary electron‐dense granules (black arrows), granules in the lumen (blue arrows) and have a contracted endoplasmic reticulum (ER) (white arrows). Scale bar 5 μm, data are from seven biological replicates per genotype.
- D
Goblet cells were stained by Alcian blue and counted in COPS8fl/fl and COPS8ΔIEC epithelia of duodenum and jejunum (scale bar 100 μm). The column graph represents number of Alcian blue+ cells presented as mean ± SEM from seven biological replicates. *P < 0.05 using Student’s t‐test.
- E
The marker for enteroendocrine cells (between two dashed line), chromogranin, was detected by immunofluorescence and counted in the ileum of COPS8fl/fl and COPS8ΔIEC mice (scale bar 100 μm). The column graph represents number of chromogranin A+ cells per crypt‐villus presented as mean ± SEM from seven biological replicates. *P < 0.05 using Student’s t‐test.
- F
RNA sequencing‐based measurements of transcripts comprising antimicrobial peptides (AMPs)‐related genes in crypts isolated from COPS8fl/fl and COPS8ΔIEC mice. Representative data from three biological replicates per genotype.
- G, H
Real‐time quantitative reverse transcription polymerase chain reaction (PCR) (qRT–PCR) analysis of the expression of genes encoding AMPs in the ileum (G) and colon (H) in COPS8fl/fl and COPS8ΔIEC mice. Error bars indicate the mean ± SD from three biological replicates. *P < 0.05, **P < 0.01, ***P < 0.001 using Student’s t‐test.
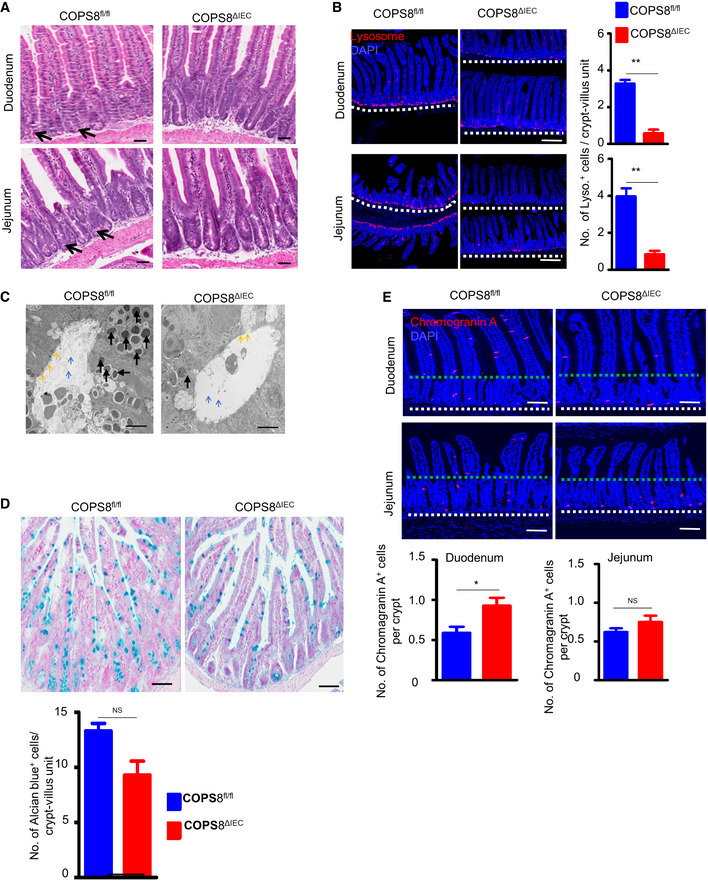
Representative hematoxylin and eosin (HE) staining of duodenum and jejunum showing loss of Paneth cells (black arrow) in COPS8ΔIEC mice. Scale bar 50 μm, data are represented from seven biological replicates per genotype.
The granule protein, lysozyme, was examined by immunofluorescence (Red) and counted in the duodenum and jejunum (located above dashed line) of Villin‐Cre and COPS8‐lox alleles expressing (COPS8fl / fl ) and COPS8ΔIEC mice. Scale bar 200 μm. Data are represented as mean ± SEM from seven biological replicates per genotype. **P < 0.01 using Student’s t‐test.
Transmission electron microscopy (TEM) of crypts of COPS8fl / fl and COPS8ΔIEC mice. The base of the crypt in COPS8ΔIEC mice is occupied by poorly differentiated columnar epithelial cells that lack secretory granules, rudimentary electron‐dense granules (black arrows), microvilli (yellow arrows), and granules in the lumen (blue arrows). Scale bar 5 μm.
Goblet cells from COPS8fl/fl and COPS8ΔIEC mice were stained with Alcian blue and counted in the ileum. Scale bar 50 μm. Data are represented as mean ± SEM from seven biological replicates per genotype. NS—statistically non‐significant using Student’s t‐test.
The marker for enteroendocrine cells, chromogranin, was detected by immunofluorescence and counted in the duodenum and jejunum of COPS8fl / fl and COPS8ΔIEC mice. Scale bar 100 μm. Data are represented as mean ± SEM from seven biological replicates per genotype. **P < 0.01 using, NS—non‐significant using Student’s t‐test.
- A
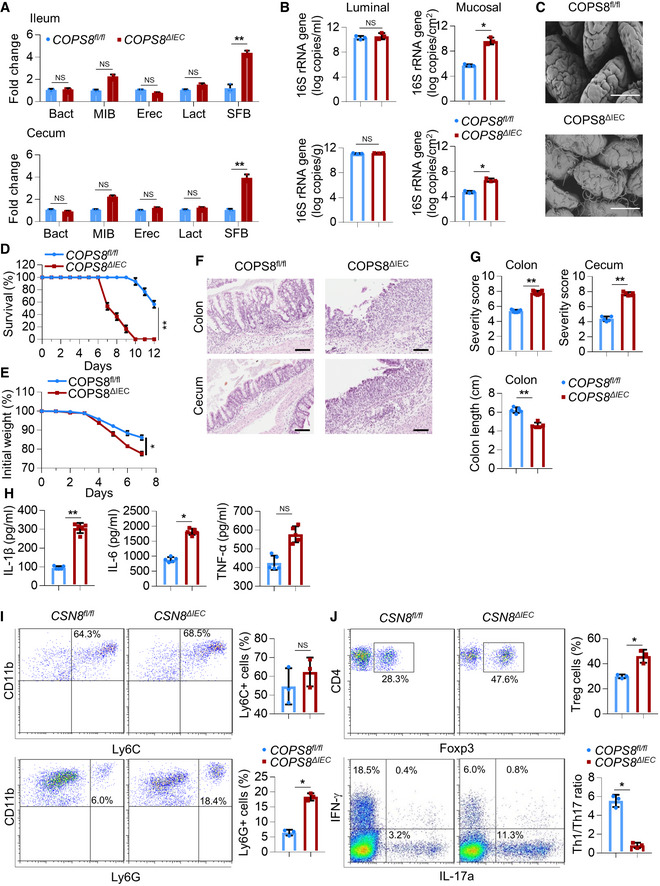
Real‐time quantitative reverse transcription polymerase chain reaction (PCR) (qRT–PCR) analysis of the differential abundance of selected bacterial taxa in stool samples of ileum and colon of Villin‐Cre and COPS8‐lox alleles expressing (COPS8fl / fl ) and COPS8 knockout (KO) (COPS8ΔIEC ) mice. Error bars indicate the mean ± SD from three biological replicates per genotype. **P < 0.01, NS—non‐significant using Student’s t‐test.
- B
qRT–PCR analysis of the abundance of luminal and mucosal bacteria in ileum (top) and cecum (bottom) of COPS8fl / fl and COPS8ΔIEC mice. Error bars indicate the mean ± SD from three biological replicates per genotype. *P < 0.05, NS—non‐significant using Student’s t‐test.
- C
Scanning electron microscopy of ileum of COPS8fl / fl and COPS8ΔIEC mice. Scale bar 50 μm, representative data from three biological replicates per genotype.
- D–J
Mice were treated by 2% dextran sodium sulfate (DSS) in drinking water for 7 days. (D) Survival curves of COPS8fl / fl and COPS8ΔIEC mice during DSS‐induced colitis. Difference in survival was determined with Kaplan–Meier analysis, **P < 0.01. Representative data from 20 biological replicates per genotype. (E) Changes in body weight are presented as percent of initial weight was determined using Mann–Whitney test, *P < 0.05. Representative data from 20 biological replicates per genotype. (F) Representative hematoxylin and eosin (HE)‐stained sections of colon and cecum from COPS8fl / fl and COPS8ΔIEC mice after DSS‐induced colitis (day 9). Scale bar 100 μm, representative data from five biological replicates per genotype. (G) Histopathologically scored sections of distal colon; cecum and colon length were analyzed from COPS8fl / fl and COPS8ΔIEC mice after DSS‐indcued colitis (day 7). Data are represented as mean ± SEM from five biological replicates per genotype. **P < 0.01 using Student’s t‐test. (H) Cytokine levels (interleukin (IL)‐1β, IL‐6, and tumor necrosis factor‐α (TNF‐α)) in the colon collected on day 7 in colitis induced COPS8fl / fl and COPS8ΔIEC mice. Data are represented as mean ± SEM from five biological replicates per genotype. *P < 0.05, **P < 0.01, NS—non‐significant using Student’s t‐test. (I) The frequency of CD11b+Ly6C+ and CD11b+Ly6G+ cells in colonic lamina propria (cLP) of COPS8fl / fl and or COPS8ΔIEC mice with DSS‐induced colitis. The column graph represents percentage of Ly6C+ and Ly6G+ cells, presented as mean ± SEM from three biological replicates per genotype. *P < 0.05, NS—non‐significant using Student’s t‐test. (J) Representative FACS plots and percentage of intracellular staining of Forkhead box protein P3 (FOXP3), Interferon gamma (IFN‐γ) and IL‐17A in CD3+CD4+ T cells from colonic lamina propria of COPS8fl / fl or COPS8ΔIEC mice with DSS‐induced colitis. The column graph represents percentage of Treg+ and ratio of Th1/Th17 cells, represented as mean ± SEM from three biological replicates per genotype. *P < 0.05 using Student’s t‐test.
- A, B
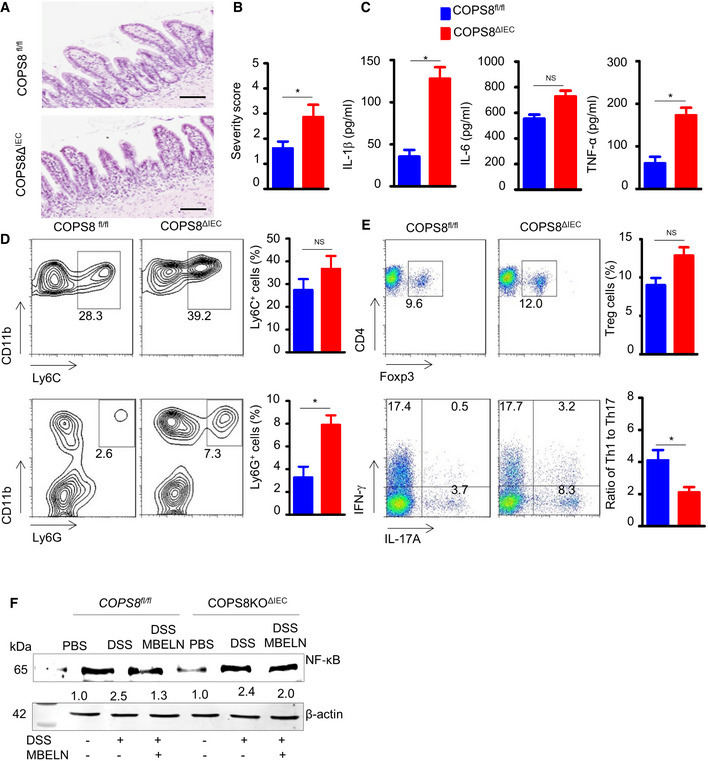
Representative image of histological analysis of the distal ileum of COPS8fl / fl and COPS8ΔIEC mice by hematoxylin and eosin (HE) staining (A) and column graph (B) showing cellularity (severity score) in the lamina propria. Scale bar 100 μm. Data are represented as mean ± SEM from seven biological replicates per genotype. *P < 0.05 using Student’s t‐test.
- C
Production of proinflammatory cytokines interleukin (IL)‐1β, IL‐6 and tumor necrosis factor‐α (TNF‐α) in intestinal epithelial cells (IEC) of COPS8fl / fl and COPS8ΔIEC mice. Data are represented as mean ± SEM from seven biological replicates per genotype. *P < 0.05 using Student’s t‐test.
- D
Neutrophils, CD11b+‐Ly6C+ (upper panel) and CD11b+‐Ly6G+ (lower panel), infiltration in colonic lamina propria of COPS8fl / fl and COPS8ΔIEC mice. Column graph showing percentage of neutrophils CD11b+‐Ly6C+ and CD11b+‐Ly6G+ presented as mean ± SEM from seven biological replicates per genotype. *P < 0.05, NS—non‐significant using Student’s t‐test.
- E
Percentage of Treg cells (upper panel) and ratio of Th1/Th17 cells (lower panel) colonic lamina propria of COPS8fl / fl and COPS8ΔIEC mice. Data are represented as mean ± SEM from three biological replicates per genotype. *P < 0.05, NS—non‐significant using Student’s t‐test.
- F
Western blot for nuclear factor kappa B (NF‐κB) in Villin‐Cre and COPS8‐lox alleles expressing (COPS8fl / fl ) and IEC COPS8 knockout (COPS8ΔIEC ) mice colon tissue following treatment with phosphate‐buffered saline (PBS), DSS and DSS with mulberry bark‐derived exosome‐like nanoparticles (MBELNs). Data are mean ± SEM. *P < 0.05, using Student’s t‐test and one‐way ANOVA.
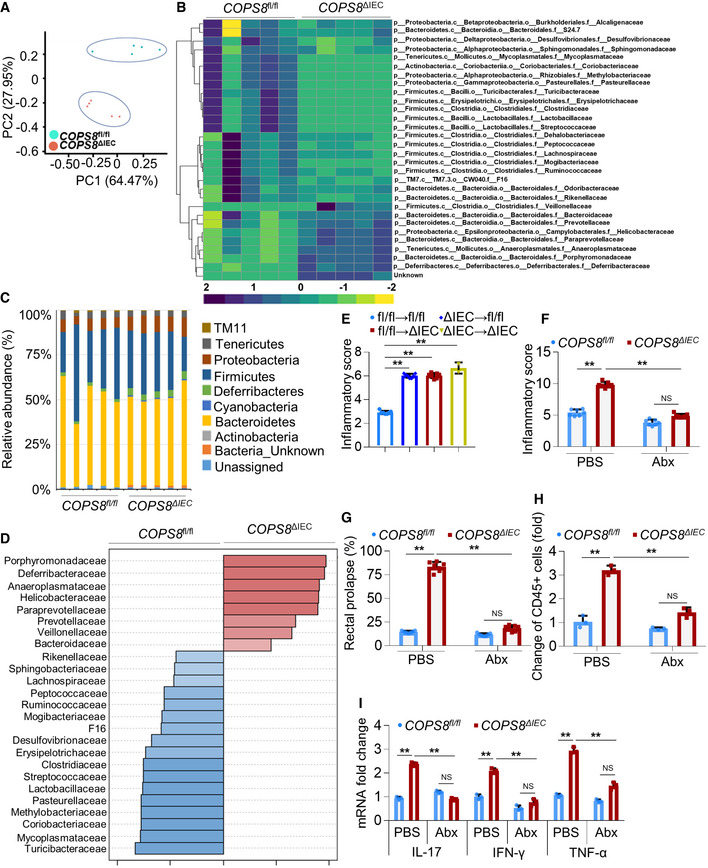
Principal components analysis of 16S rRNA gene‐sequencing analysis of gut microbes obtained from Villin‐Cre and COPS8‐lox alleles expressing (COPS8fl / fl ) and COPS8 knockout (KO) (COPS8ΔIEC ) mice. PC1 and PC2 explain the 64.47 and 27.95% variation, respectively. Representative data from five biological replicates per genotype.
Heatmap of differentially represented bacterial species in feces between COPS8fl / fl and COPS8ΔIEC mice. The top 30 genera that are shared by all of the samples shown. The scale was the percentage composition (log2) based on the 16S rRNA gene sequences analyzed using the Greengene database (gg_otus2013). The hierarchical clustering based on Spearman rank correlation (average linkage method) was performed using Gene Cluster 3.0 and images generated on Java Treeview. Representative data from five biological replicates per genotype.
The relative abundance of bacteria phylum in the feces of COPS8fl / fl and COPS8ΔIEC mice. Representative data from five biological replicates per genotype.
LEfSe analysis was applied to identify high‐dimensional biomarkers that discriminate between feces from COPS8fl / fl and COPS8ΔIEC mice. Representative data from five biological replicates per genotype.
Histologic severity scores of COPS8fl / fl mice and COPS8ΔIEC after fecal transplantation. Data represents the histological score of mice analyzed on day 160. Data are represented as mean ± SEM from seven biological replicates per genotype. **P < 0.01 using one‐way ANOVA.
Inflammation scores in the colon of 5‐month‐old COPS8fl / fl and COPS8ΔIEC mice. Data are represented as mean ± SEM from seven biological replicates per genotype. **P < 0.01, NS—non‐significant using one‐way ANOVA.
Percentage of rectal prolapse of 5‐month‐old mice COPS8fl / fl and COPS8ΔIEC . Data are represented as mean ± SEM from seven biological replicates per genotype. **P < 0.01, NS—non‐significant using one‐way ANOVA.
Flow cytometric analysis of CD45+ infiltrating immune cells in the lamina propria of the ileum. Data are represented as mean ± SEM from three biological replicates per genotype. **P < 0.01, NS—non‐significant using one‐way ANOVA.
Real‐time quantitative reverse transcription polymerase chain reaction (qRT–PCR) analysis of the expression of genes encoding inflammatory cytokines in the ileum. COPS8fl / fl and COPS8ΔIEC mice were either untreated (phosphate‐buffered saline (PBS)) or treated with the antibiotic cocktail (Abx) for 3 months. Data are mean ± SEM from three biological replicates. **P < 0.01, NS—non‐significant using one‐way ANOVA.
- A
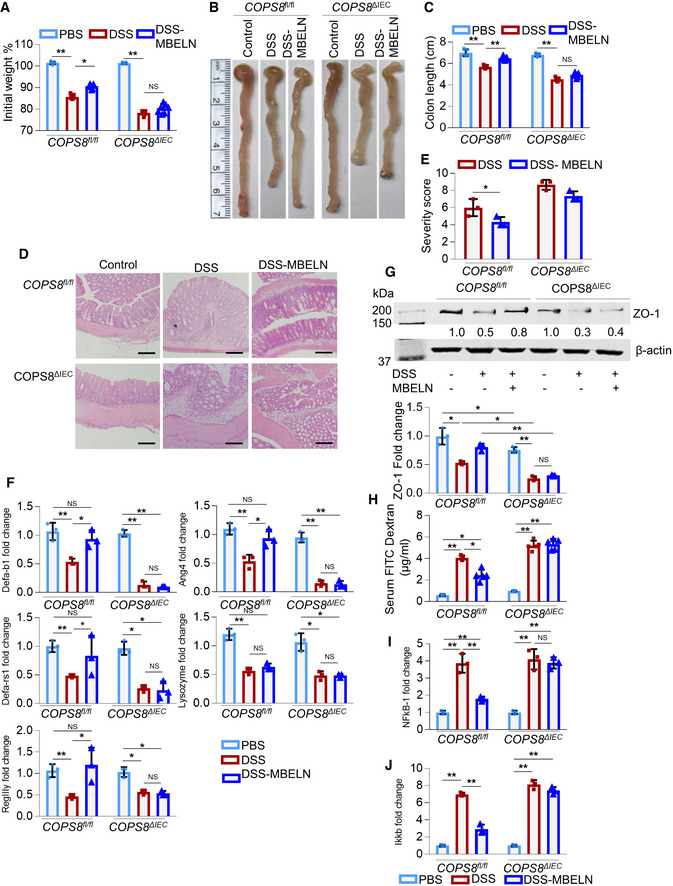
Graph showing loss of weight following oral dextran sodium sulfate (DSS) (2%) treatment with and without mulberry bark‐derived exosome‐like nanoparticles (MBELNs) for 7 days (10 × 109 particles/dose/day/mouse) once daily for 7 days in Villin‐Cre and COP9/COP9 constitutive photomorphogenic homolog subunit 8 (COPS8)‐lox alleles expressing (COPS8fl / fl ) and COPS8 knockout (KO) (COPS8ΔIEC ) mice. Changes in body weight are presented as percent of initial weight determined using Mann–Whitney test, *P < 0.05, **P < 0.01, NS—non‐significant. Representative data from seven biological replicates per genotype.
- B
Representative image showing changes in colon morphology and length following DSS‐induced colitis with concurrent treatment with MBELNs COPS8fl / fl and COPS8ΔIEC mice. Representative data from seven biological replicates per genotype.
- C
Column graph showing changes in colon length. Data are mean ± SEM from seven biological replicates. **P < 0.01, NS—non‐significant using one‐way ANOVA.
- D, E
Hematoxylin and eosin staining (HE) to show histological changes (D) and graph showing severity scores based on histological data (E). Scale bar 200 μm, column graph represents colon severity score, presented as mean ± SEM from three biological replicates per genotype. *P < 0.05, NS—non‐significant using Student’s t‐test.
- F
Expression of anti‐microbial peptide (AMPs) in the colon of COPS8fl / fl and COPS8ΔIEC mice while being treated with MBELNs by oral administration. Data are mean ± SEM from three biological replicates per group. *P < 0.05, **P < 0.01, NS—non‐significant using one‐way ANOVA. (G) Protein expression tight junction protein Zonula occludens‐1 (ZO‐1) using Western blotting in colonic intestine epithelial cells. Data are mean ± SEM from three biological replicates per group. *P < 0.05, **P < 0.01, NS—non‐significant using one‐way ANOVA.
- H
Measurement of serum fluorescein isothiocyanate (FITC)‐dextran to evaluate the permeability of the intestines. Data are mean ± SEM from five biological replicates per group. *P < 0.05, **P < 0.01 using one‐way ANOVA.
- I, J
Transcriptional expression of nuclear factor kappa B (NF‐κB) (I) and inhibitor of nuclear factor kappa‐β kinase (IKK‐β) (J) mRNA using real‐time quantitative reverse transcription polymerase chain reaction (qRT–PCR) in colonic epithelial cells upon treatment with MBELNs in addition to DSS. Data are mean ± SEM from three biological replicates per group. **P < 0.01, NS—non‐significant using one‐way ANOVA.
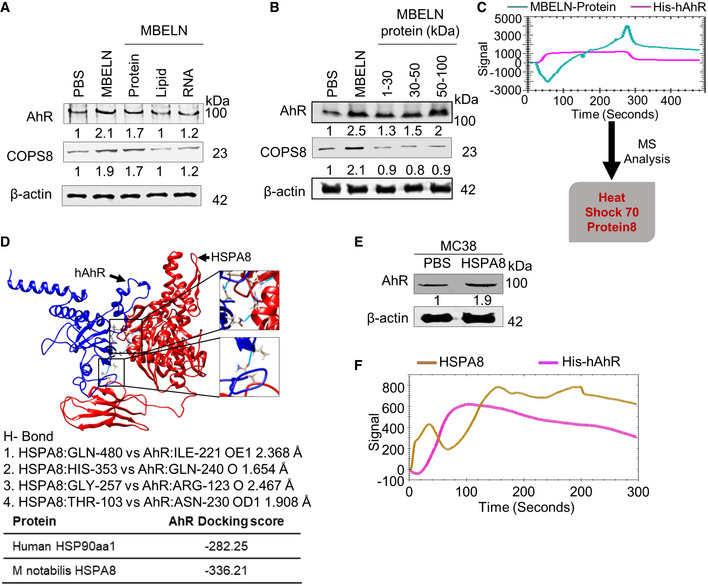
Western blots showing expression of AhR in MC38 cells induced by different fractions (protein, lipid, and RNA) derived from mulberry bark‐derived exosome‐like nanoparticles (MBELNs). Data shown are from three biological replicates.
The effect of different size protein fractions of mulberry bark‐derived exosome‐like nanoparticles (MBELNs) on the expression of aryl hydrocarbon receptor (AhR) demonstrated in Western blots. Data shown are from three biological replicates.
Surface Plasmon resonance (SPR) experiment showing MBELN‐derived protein binding to recombinant human His‐AhR (hAhR) and mass spectrometry (MS) analysis of proteins binding to hAhR on a SPR chip. Data shown are from three biological replicates.
Computational analysis showing docking of Heat Shock Protein Family A (Hsp70) Member 8 (HSPA8; represented in red color) to hAhR (represented in blue color). Data shown are from three biological replicates.
MC38 cells treated with MBELN‐HSPA8 showing activation of AhR by Western blot. Data shown are from three biological replicates.
SPR experiment showing recombinant HSPA8 protein interaction with recombinant hAhR on a SPR chip. Data shown are from three biological replicates.
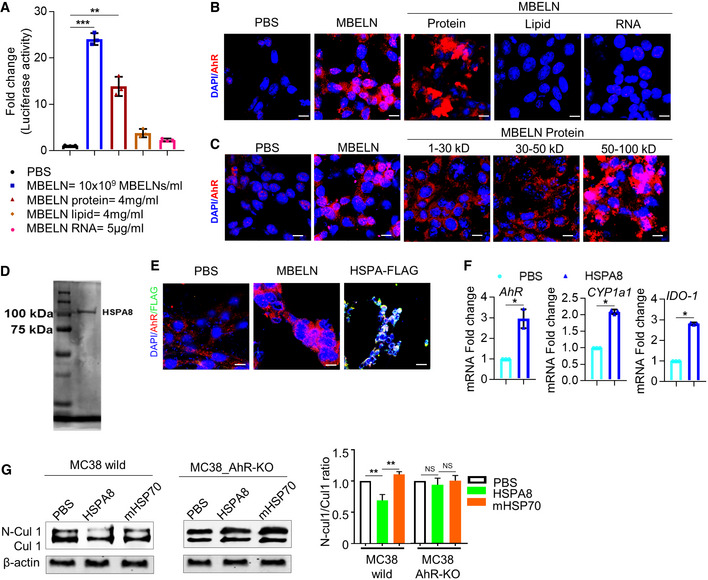
Effect of different fractions of mulberry bark‐derived exosome‐like nanoparticles (MBELNs) on the expression of aryl hydrocarbon receptor (AhR) promoter using HEPA1.1 cells (AhR responsive luciferase reporter construct). Data are represented as mean ± SEM from three biological replicates. *P < 0.05, NS—non‐significant using one‐way ANOVA.
Confocal image showing the effect of MBELN fractions on localization of AhR. Scale bar 10 μm, Data are represented from three biological replicates.
The effect of different molecular weight fractions of MBELN‐derived proteins on AhR localization in MC38 cells. Scale bar 10 μm, Data are represented from three biological replicates.
Cloning, expression, and purification of recombinant MBELN‐HSPA8.
Confocal microscopy showing FLAG‐tagged HSPA8 protein treatment to MC38 colocalized with AhR. Scale bar 10 μm, Data are represented from three biological replicates.
Real‐time quantitative reverse transcription polymerase chain reaction (PCR) for expression of AhR and its targeted genes Cytochrome P450, family 1, subfamily A, polypeptide 1 (CYP1a1), and Indoleamine 2,3‐dioxygenase (IDO‐1) in MC38 cells following HSPA8 treatment. Data are represented as mean ± SEM from three biological replicates. *P < 0.05 using Student’s t‐test.
Western blot showing the ratio of CUL1 and neddylated cullin 1 (N‐CUL1) expression in wild and AhR knockout (KO) MC38 cells. Data are represented as mean ± SEM from three biological replicates. *P < 0.05, NS—non‐significant using Student’s t‐test.
References
-
- Asano N, Tomioka E, Kizu H, Matsui K (1994) Sugars with nitrogen in the ring isolated from the leaves of Morus bombycis. Carbohydr Res 253: 235–245 - PubMed
Publication types
MeSH terms
Associated data
- Actions
- Actions
Grants and funding
- P30 ES030283/ES/NIEHS NIH HHS/United States
- IK6 BX004199/BX/BLRD VA/United States
- P50 AA024337/AA/NIAAA NIH HHS/United States
- P20 GM125504/GM/NIGMS NIH HHS/United States
- R01 AT008617/AT/NCCIH NIH HHS/United States
- R21 AI159194/AI/NIAID NIH HHS/United States
- R01 DK115406/DK/NIDDK NIH HHS/United States
- R01 DK130294/DK/NIDDK NIH HHS/United States
- P20 GM113226/GM/NIGMS NIH HHS/United States
- R21 AA025724/AA/NIAAA NIH HHS/United States
- R01 AA028436/AA/NIAAA NIH HHS/United States
- P20 GM103436/GM/NIGMS NIH HHS/United States
- R01 AA028435/AA/NIAAA NIH HHS/United States
- R01 AA023190/AA/NIAAA NIH HHS/United States
LinkOut - more resources
Full Text Sources
Research Materials
Miscellaneous
