. 2022 Feb;207(2):302-313.
doi: 10.1097/JU.0000000000002242. Epub 2021 Nov 8.

Management Trends and Outcomes of Patients Undergoing Radical Cystectomy for Urothelial Carcinoma of the Bladder: Evolution of the University of Southern California Experience over 3,347 Cases

Affiliations

Management Trends and Outcomes of Patients Undergoing Radical Cystectomy for Urothelial Carcinoma of the Bladder: Evolution of the University of Southern California Experience over 3,347 Cases

Anirban P Mitra et al. J Urol. 2022 Feb.

Abstract

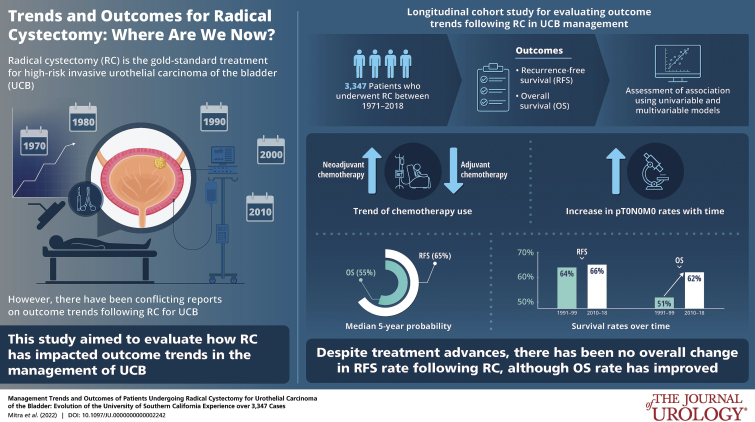
Purpose: There are conflicting reports on outcome trends following radical cystectomy (RC) for bladder cancer.

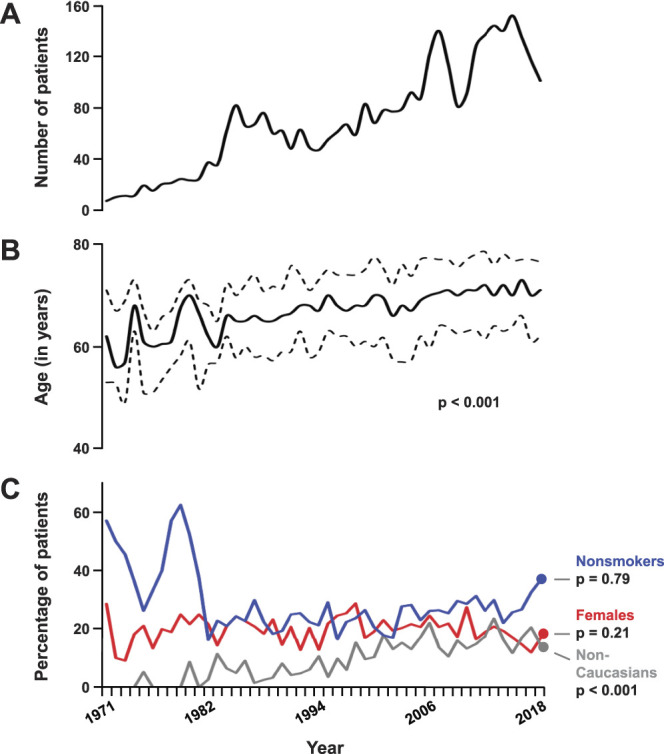
Materials and methods: Evolution of modern bladder cancer management and its impact on outcomes was analyzed using a longitudinal cohort of 3,347 patients who underwent RC at an academic center between 1971 and 2018. Outcomes included recurrence-free survival (RFS) and overall survival (OS). Associations were assessed using univariable and multivariable models.

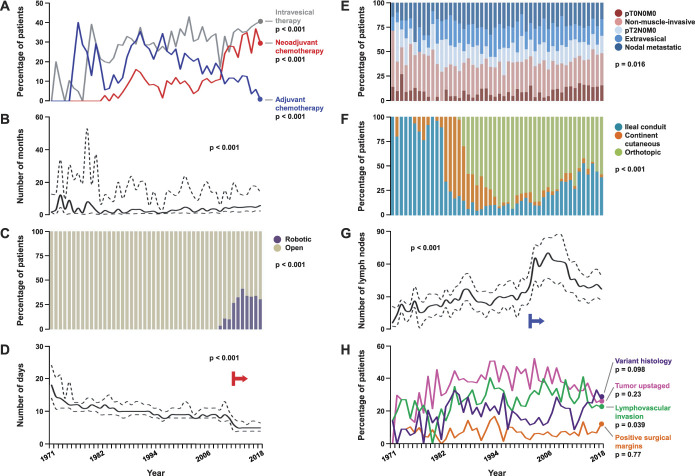
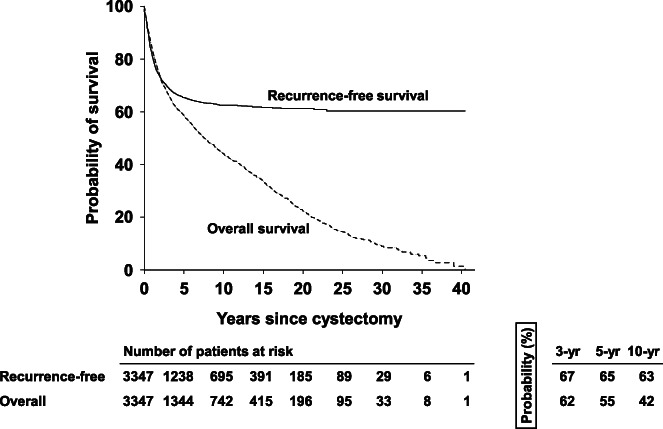
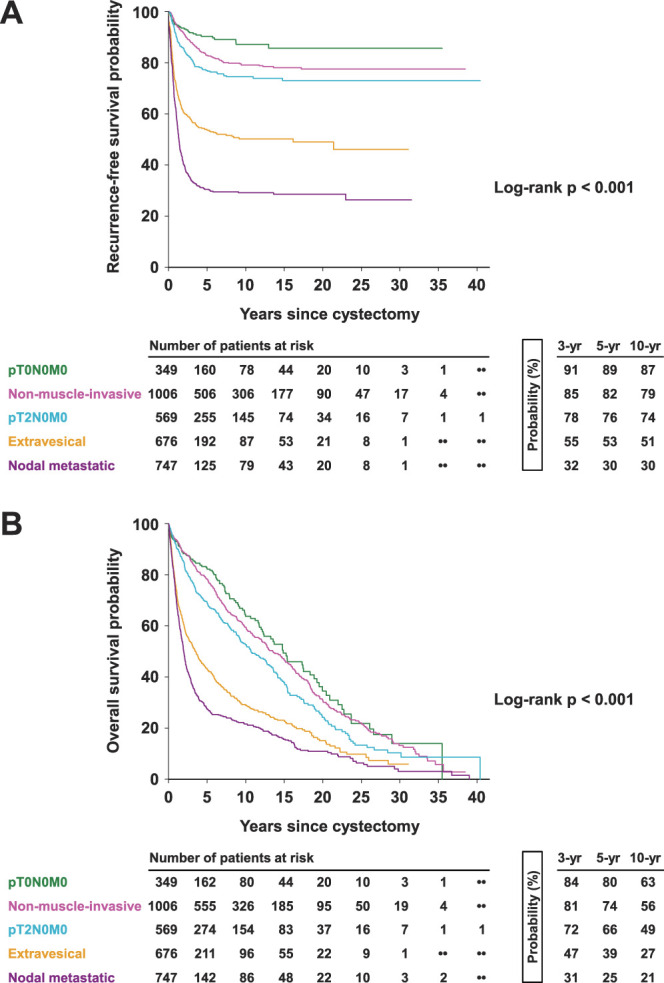
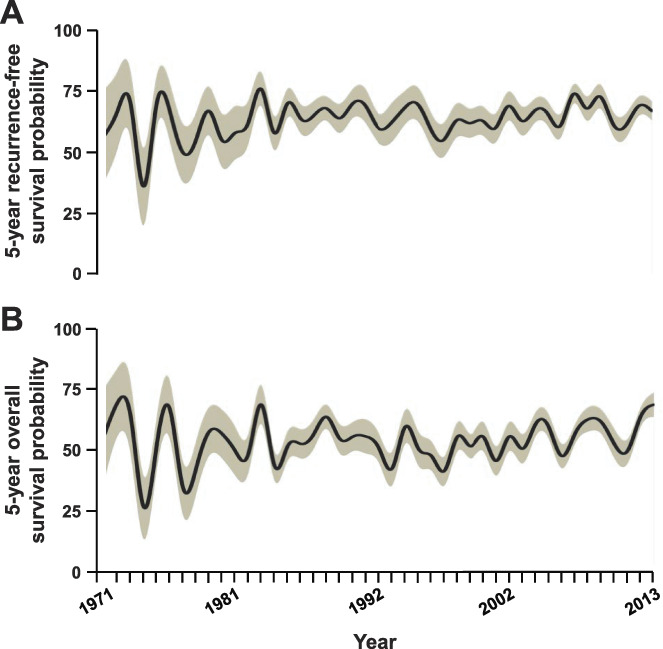
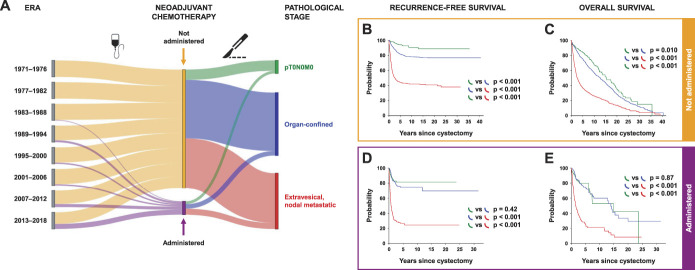
Results: In all, 70.9% of cases underwent open RC in the last decade, although trend for robot-assisted RC rose since 2009. While lymphadenectomy template remained consistent, nodal submission changed to anatomical packets in 2002 with increase in yield (p <0.001). Neoadjuvant chemotherapy (NAC) use increased with time with concomitant decrease in adjuvant chemotherapy; this was notable in the last decade (p <0.001) and coincided with improved pT0N0M0 rate (p=0.013). Median 5-year RFS and OS probabilities were 65% and 55%, respectively. Advanced stage, NAC, delay to RC, lymphovascular invasion and positive margins were associated with worse RFS (all, multivariable p <0.001). RFS remained stable over time (p=0.73) but OS improved (5-year probability, 1990-1999 51%, 2010-2018 62%; p=0.019). Among patients with extravesical and/or node-positive disease, those who received NAC had worse outcomes than those who directly underwent RC (p ≤0.001).

Conclusions: Despite perioperative and surgical advances, and improved pT0N0M0 rates, there has been no overall change in RFS trend following RC, although OS rates have improved. While patients who are downstaged with NAC derive great benefit, our real-world experience highlights the importance of preemptively identifying NAC nonresponders who may have worse post-RC outcomes.

Keywords: cystectomy; neoadjuvant therapy; prognosis; urinary bladder neoplasms; urinary diversion.


Figures

None
Graphical abstract
Figure 1.
Figure 1.
Annualized trends of baseline characteristics of patients with bladder cancer. Line graphs show trends in number of patients (A), median age (solid) with IQR (dotted; B), and proportion of patients who were nonsmokers (blue), females (red) and nonCaucasians (gray; C) across the study duration. Annualized p value calculated by Kruskal-Wallis test for age, and by Mantel-Haenszel test for trend for other categorical measurements.
Figure 2.
Figure 2.
Annualized trends of disease and management characteristics of patients with bladder cancer. Line graphs show trends in proportion of patients who received intravesical therapy (gray), neoadjuvant (red) and AC (blue; A), time from diagnosis to cystectomy (B), postoperative length of hospital stay (D), lymph node yield (G), and proportion of patients with variant histology (indigo), tumor upstaging (magenta), lymphovascular invasion (green) and positive surgical margins (orange; H). Bar graphs show proportions of patients undergoing robotic (purple) and open (tan) radical cystectomy (C), with distribution of pathological stage (E), and type of urinary diversion performed across the study duration (F). Graphs for time to cystectomy, length of stay and nodal yield display median values along solid curve, and IQR between dotted curves; corresponding annualized p values calculated by Kruskal-Wallis test. Annualized p value calculated by Mantel-Haenszel test for trend for all other categorical measurements. Red arrow in panel D indicates institution of enhanced postoperative recovery pathway. Blue arrow in panel G indicates institution of node packeting during pelvic lymphadenectomy.
Figure 3.
Figure 3.
Clinical outcomes of all bladder cancer patients. Kaplan-Meier curves show recurrence-free (solid) and overall (dotted) survival probabilities of patients with urothelial carcinoma of bladder across entire study population.
Figure 4.
Figure 4.
Comparison of clinical outcomes of patients with bladder cancer stratified by pathological stage. Kaplan-Meier curves show recurrence-free (A) and overall survival probabilities (B) of patients with pT0N0M0 (green), nonmuscle-invasive (magenta), pT2N0M0 (aqua), extravesical (orange), and nodal metastatic (purple) disease. Overall p value calculated by log rank test.
Figure 5.
Figure 5.
Annualized trends of clinical outcomes following radical cystectomy for bladder cancer. Five-year probability of recurrence-free (A) and overall survival (B) for patients (solid line) with corresponding standard error estimates (shaded area). Estimates determined for patients undergoing cystectomy until 2013 to allow for adequate followup. Univariable log rank test for trend p=0.94 and 0.009, respectively.
Figure 6.
Figure 6.
NAC administration and association with clinical outcomes. A, flow diagram depicts the relative proportion of patients in each 6-year era who received (purple) or did not receive (orange) NAC, and corresponding proportions who were found to have pT0N0M0 (green), organ-confined (blue), and extravesical and/or nodal metastatic (red) disease on radical cystectomy. Thickness of each colored curve corresponds to relative proportion for respective originating node. Kaplan-Meier curves show probabilities of recurrence-free (B, D), and overall survival (C, E) among patients who did not (B, C) and did (D, E) receive NAC, when stratified by pathological stage. Log rank p values compared across strata shown.

Comment in

  • Editorial Comment.
    Li R, Gilbert SM. Li R, et al. J Urol. 2022 Feb;207(2):312-313. doi: 10.1097/JU.0000000000002242.01. Epub 2021 Nov 8. J Urol. 2022. PMID: 34994655 No abstract available.

References

    1. Abdollah F, Gandaglia G, Thuret R, et al. : Incidence, survival and mortality rates of stage-specific bladder cancer in United States: a trend analysis. Cancer Epidemiol 2013; 37: 219. - PubMed
    1. Shah A, Rachet B, Mitry E, et al. : Survival from bladder cancer in England and Wales up to 2001. Br J Cancer, suppl., 2008; 99: S86. - PMC - PubMed
    1. Morgan TM, Barocas DA, Keegan KA, et al. : Volume outcomes of cystectomy—is it the surgeon or the setting? J Urol 2012; 188: 2139. - PubMed
    1. Scarberry K, Berger NG, Scarberry KB, et al. : Improved surgical outcomes following radical cystectomy at high-volume centers influence overall survival. Urol Oncol 2018; 36: 308.e11. - PubMed
    1. Daneshmand S, Ahmadi H, Schuckman AK, et al. : Enhanced recovery protocol after radical cystectomy for bladder cancer. J Urol 2014; 192: 50. - PubMed

MeSH terms

LinkOut - more resources