Review
. 2022 Feb 9;122(3):3459-3636.
doi: 10.1021/acs.chemrev.1c00746. Epub 2022 Jan 7.

Molecular Probes, Chemosensors, and Nanosensors for Optical Detection of Biorelevant Molecules and Ions in Aqueous Media and Biofluids

Affiliations
Review

Molecular Probes, Chemosensors, and Nanosensors for Optical Detection of Biorelevant Molecules and Ions in Aqueous Media and Biofluids

Joana Krämer et al. Chem Rev. .

Abstract

Synthetic molecular probes, chemosensors, and nanosensors used in combination with innovative assay protocols hold great potential for the development of robust, low-cost, and fast-responding sensors that are applicable in biofluids (urine, blood, and saliva). Particularly, the development of sensors for metabolites, neurotransmitters, drugs, and inorganic ions is highly desirable due to a lack of suitable biosensors. In addition, the monitoring and analysis of metabolic and signaling networks in cells and organisms by optical probes and chemosensors is becoming increasingly important in molecular biology and medicine. Thus, new perspectives for personalized diagnostics, theranostics, and biochemical/medical research will be unlocked when standing limitations of artificial binders and receptors are overcome. In this review, we survey synthetic sensing systems that have promising (future) application potential for the detection of small molecules, cations, and anions in aqueous media and biofluids. Special attention was given to sensing systems that provide a readily measurable optical signal through dynamic covalent chemistry, supramolecular host-guest interactions, or nanoparticles featuring plasmonic effects. This review shall also enable the reader to evaluate the current performance of molecular probes, chemosensors, and nanosensors in terms of sensitivity and selectivity with respect to practical requirement, and thereby inspiring new ideas for the development of further advanced systems.


Conflict of interest statement

The authors declare no competing financial interest.

Figures
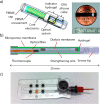
Figure 1
Figure 1
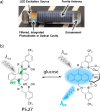
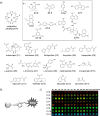
(a) Schematic representation of the “Eversense system” by Senseonics used for the detection of glucose. The hydrogel of the sensor contains glucose-selective and fluorescent phenylboronic acid probes. (b) Schematic representation of the GlySure Ltd. system used for intravenous glucose sensing through immobilized glucose-selective and fluorescent phenylboronic acid probes. Reproduced with permission from ref (18). Copyright 2015 SAGE Publishing. (c) Image of the sensor cassette sold by OPTI Medical Systems, Inc. (www.optimedical.com). The black spots carry the organic polymer fiber mats with the fluorescent sensor molecules that measure the concentration of Na+, K+, Ca2+, and CO2 (indirectly) in whole blood. Reproduced with permission from ref (19). Copyright 2008 The Royal Society of Chemistry.
Figure 2
Figure 2
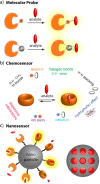
Schematic representation of a molecular probe, a chemosensor, and a nanosensor. An emission turn-on response is shown as an exemplary signal response to the presence of an analyte. (a) Molecular probes typically undergo a strong and irreversible covalent-like bond formation with analytes that carry reactive functional groups. (b) Chemosensors bind their target analytes reversibly through a combination of noncovalent binding interactions. The binding and unbinding kinetics are typically fast on the time scale of the experiment/assay. (c) Nanosensors are (nano)particle-based systems that are either surface functionalized with multiple copies of chemosensors or probes or that possess pores as binding stations for the analyte.
Figure 3
Figure 3
Schematic representation of the different assay types. For details, see text.
Figure 4
Figure 4
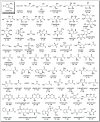
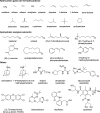
Overview of representative organic substances found in urine. The numbers indicate the concentration range (shown as μM/mM creatinine) at which the compounds were reported in a comprehensive metabolomic study based on NMR spectroscopy. Typical creatinine levels found in human adult urine are 97–230 μmol kg–1 d–1. Many more organic compounds, including additional amino acids, sugars, lipids, etc., are found in the full metabolome at micromolar to trace levels. *Compounds found in urine samples from individuals that had been administered paracetamol (acetaminophen).
Figure 5
Figure 5
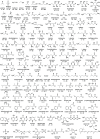
Overview of representative organic substances found in saliva. The numbers indicate the concentration range (values given in μM) at which the compounds were reported in a comprehensive metabolomic study based on NMR, GC-MS, and HPLC methods.
Figure 6
Figure 6
Chemical structures of the 20 proteinogenic L-amino acids.
Figure 7
Figure 7
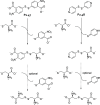
Schematic representation of the reaction sequence of ninhydrin (P2.1) with an α-amino acid.
Figure 8
Figure 8
Schematic representation of the reaction of a primary amine with fluorescamine (P2.2).
Figure 9
Figure 9
Schematic representation of the reaction of P2.3 and P2.4 with amines, thiols, and cyanides.
Figure 10
Figure 10
Amine-reactive BODIPY-based probes P2.5 and P2.6 respond with changes in their absorbance and emission properties upon amide bond formation.
Figure 11
Figure 11
(a) Chemical structures of probe P2.7 and its corresponding indicator dyes. (b) Principle of the colorimetric identification of 20 natural amino acids using indicator-displacement arrays composed of P2.7 and the indicator dyes at different pH. Adapted with permission from ref (113). Copyright 2004 American Chemical Society.
Figure 12
Figure 12
Schematic representation of an enantioselective IDA for amino acids based on CuII-complex P2.8. Adapted with permission from ref (114). Copyright 2008 American Chemical Society.
Figure 13
Figure 13
(a) Schematic representation of amine-reactive probe (P2.9). (b) Table of binding constant and signal transduction selectivity of P2.9 for certain amino acids.
Figure 14
Figure 14
Chemical structures of thiol-functional amino acids.
Figure 15
Figure 15
Chemical structures of the probes P2.10, P2.11, and P2.12.
Figure 16
Figure 16
Chemical structure of the probes P2.13, P2.14, and P2.15.
Figure 17
Figure 17
Schematic representation of the reaction of probe P2.16 with a thiol-containing analyte. Adapted with permission from ref (127). Copyright 2012 American Chemical Society.
Figure 18
Figure 18
Schematic representation of probe P2.17 and its reaction with a thiol. Adapted with permission from ref (128). Copyright 2008 Wiley-VCH.
Figure 19
Figure 19
(a) Schematic representation of the reaction of P2.18 with Cys and Hcys. (b) Kinetic traces of probe P2.18 (10 μM) with 20 μM Hcys and Cys in 1 mM CTAB in 20 mM phosphate buffer, pH 7.4, as obtained by emission intensity monitoring. Adapted with permission from ref (132). Copyright 2011 Wiley-VCH.
Figure 20
Figure 20
(a) Chemical structures of the thiol-reactive probe P2.19. (b) Schematic representation of the reaction of P2.20 with Cys. Adapted with permission from ref (137). Copyright 2015 American Chemical Society.
Figure 21
Figure 21
Chemical structures of probes P2.21P2.23.
Figure 22
Figure 22
Chemical structures of probes P2.24P2.27.
Figure 23
Figure 23
Chemical structures of probes P2.28 and P2.29.
Figure 24
Figure 24
Chemical structures of probes P2.30 and P2.31.
Figure 25
Figure 25
Schematic representation of the reactions of probe P2.32 with Cys, Hcys, and GSH, leading to the formation of weakly emissive product 1 (Hcys) or strongly emissive product 2 (Cys) and product 3 (GSH). Adapted with permission from ref (148). Copyright 2016 The Royal Society of Chemistry.
Figure 26
Figure 26
Schematic representation of the reaction of probe P2.33, with GSH leading to the uncaging of fluorescein in buffered aqueous media. Reproduced with permission from ref (149). Copyright 2013 Elsevier BV.
Figure 27
Figure 27
(a) Schematic representation of the mechanism for the discriminative detection of GSH and Cys/Hcys by using P2.34. (b) Image of aqueous solutions of P2.34 in the presence of GSH, Cys, and Hcys under UV-light (λex = 365 nm). Reproduced with permission from ref (150). Copyright 2014 The Royal Society of Chemistry.
Figure 28
Figure 28
Sensing of thiols with probe P2.35. Reproduced with permission from ref (151). Copyright 2015 The Royal Society of Chemistry.
Figure 29
Figure 29
(a) Chemical structure of molecular probe P2.36. (b,c) Schematic representation of the reaction of probe P2.37 and probe P2.38 with thiols. (b) Adapted with permission from ref (152). Copyright 2015 The Royal Society of Chemistry. (c) Adapted with permission from ref (153). Copyright 2016 Springer Nature.
Figure 30
Figure 30
Chemical structures of probes P2.39 and P2.40.
Figure 31
Figure 31
Reaction of (a) probe P2.41 and (b) probe P2.42 for aromatic and aliphatic thiols. (a) Reproduced with permission from ref (157). Copyright 2012 American Chemical Society. (b) Reproduced with permission from ref (158). Copyright 2010 The Royal Society of Chemistry.
Figure 32
Figure 32
Schematic representation of probe P2.43 upon reaction with Cys and Hcys. Reproduced with permission from ref (159). Copyright 2014 American Chemical Society.
Figure 33
Figure 33
(a) Chemical structures of probe P2.44P2.46. (b) Schematic representation of the reaction mechanism with GSH or Cys and Hcys. Reproduced with permission from ref (160). Copyright 2014 The Royal Society of Chemistry.
Figure 34
Figure 34
Reaction mechanism of Ellman’s reagent (P2.47) and Aldrithiol (P2.48) with Cys. Reproduced with permission from ref (131). Copyright 2016 American Chemical Society.
Figure 35
Figure 35
Chemical structures of probe P2.49P2.52.
Figure 36
Figure 36
Reaction mechanism of probe P2.53 with Cys, Hcys, and GSH. Reproduced with permission from ref (167). Copyright 2012 American Chemical Society.
Figure 37
Figure 37
Reaction mechanism of probe P2.54 upon reaction with (a) NAC, (b) GSH, and (c) Cys/Hcys. (d) Schematic representation of simultaneous sensing of Cys and GSH. Adapted with permission from ref (168). Copyright 2014 American Chemical Society.
Figure 38
Figure 38
Schematic representation of the reaction of HINA with a PtII-precursor to form a non-emissive l-PtII–HINA (P2.55). Upon addition of Cys, the HINA ligand is displaced and becomes emissive. Reproduced with permission from ref (169). Copyright 2021 The Royal Society of Chemistry.
Figure 39
Figure 39
Chemical structure of probe P2.56.
Figure 40
Figure 40
Schematic representation of the selective detection of cysteine and homocysteine in water with probe P2.57 consisting of Au+ and 2-deoxyribose-functionalized rhodamine.
Figure 41
Figure 41
Chemical structures of probes P2.58 and P2.59.
Figure 42
Figure 42
Some of the earliest examples for (a) a thiol-probe (P2.60) that is operational in blood serum, and (b) a thiol probe (P2.61) that can be used for distinction of cysteine and homocysteine from GSH and other amino acids.
Figure 43
Figure 43
IridiumIII-based metal complexes (a) P2.62 and (b) P2.63 function as selective luminescence turn-on probes for histidine as well as the His-rich protein BSA.
Figure 44
Figure 44
Chemical structures of representative macrocyclic hosts that were used as a scaffold for the construction of chemosensors for amino acids.
Figure 45
Figure 45
(a) Schematic representation of a product-selective tandem assay with chemosensor C2.1 for monitoring of the hydrolysis of the Thr-Gly-Ala-Phe-Met-NH2 peptide by the endopeptidase thermolysin. (b) Chemical structure of the dye acridine orange. Reproduced with permission from ref (221). Copyright 2011 American Chemical Society.
Figure 46
Figure 46
(a) Addition of decarboxylases to mixtures of l- and d-amino acids results in the enantioselective decarboxylation of l-amino acids to their corresponding biogenic amines. In the presence of a CB7•dye reporter pair, e.g., CB7•dapoxyl, (C2.2), this enzymatic process can be followed in real time by emission spectroscopy. (b) Representative emission traces for the decarboxylation of d-/l-mixtures of lysine (50 μM total concentration) with lysine decarboxylase in the presence of CB7 (10 μM) and dapoxyl (2.5 μM) as the reporter pair in 10 mM ammonium acetate buffer, pH 6.0. Figure and data traces adapted from ref (226). Copyright 2008 Wiley-VCH.
Figure 47
Figure 47
(a) Crystal structure of the complex between the N-terminal Phe-residue of insulin and the host CB7. Acridine orange was used as an indicator dye. Reproduced with permission from ref (211). Copyright 2011 American Chemical Society. (b) Chemical structures of the chemosensors C2.1, C2.2, and C2.3.
Figure 48
Figure 48
Chemical structures of chromophoric and emissive cucurbit[6]uril analogues: (a) C2.4 and (b) C2.5.
Figure 49
Figure 49
(a) Schematic representation of an IDA with C2.6/C2.7 and lysine or methionine as analytes. (b) Chemical structures of the partially methyl substituted CB6 derivatives Me4CB6 and Me6CB6 and a bipyridinium phenylene-vinylene dye. Adapted with permission from ref (236). Copyright 2017 Wiley-VCH.
Figure 50
Figure 50
Schematic representation of chiral guest complexation by achiral hosts, leading to CD signal generation (a) through deformation of the host into a chiral conformation and (b) via induced circular dichroism (ICD) through electronic coupling between chromophoric hosts and guests. (c) Chemical structures of chemosensor C2.8 and C2.9. Reproduced with permission from ref (246). Copyright 2020 The Royal Society of Chemistry.
Figure 51
Figure 51
Chemical structures of selected dyes (typically halide salts), which are commonly used together in combination with CB8 to form CB8•dye chemosensors.
Figure 52
Figure 52
Chemical structure of the CB8•dye rotaxane-type chemosensor C2.14.
Figure 53
Figure 53
Chemical structure of the covalent linked unimolecular CB7-tetramethyl rhodamine chemosensor C2.15.
Figure 54
Figure 54
Chemical structure of the calix[4]arene-type chemosensor C2.16 and the binding scheme of DDA. Reproduced with permission from ref (275). Copyright 2014 American Chemical Society.
Figure 55
Figure 55
(a) Chemical structure of C2.17 and models of host–guest complexes. (b) Scheme of the aggregation-based sensing system in analogy to C2.17. Adapted with permission from ref (277). Copyright 2014 American Chemical Society.
Figure 56
Figure 56
Chemical structure of chemosensor C2.18.
Figure 57
Figure 57
(a) Chemical structure of chemosensor C2.19. (b) General scheme of enantioselective fluorescent cyclodextrins showcased for chemosensor C2.20.
Figure 58
Figure 58
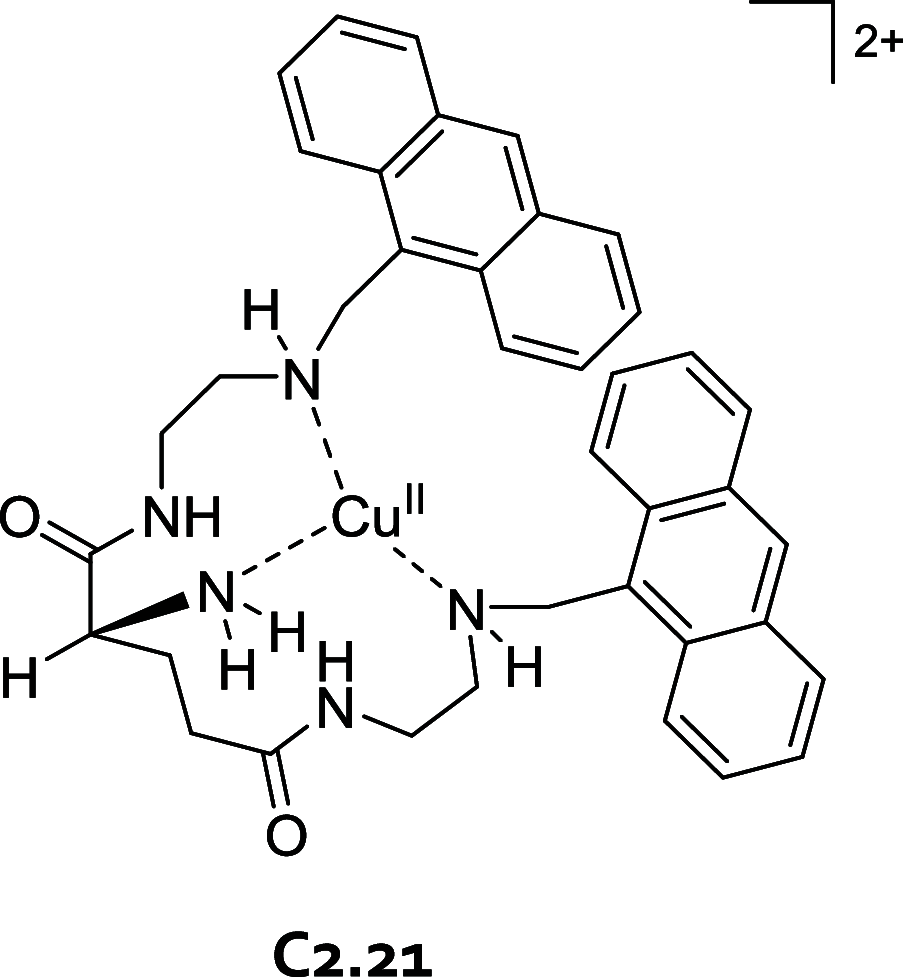
Chemical structure of copper containing anthracene-functionalized chemosensor C2.21.
Figure 59
Figure 59
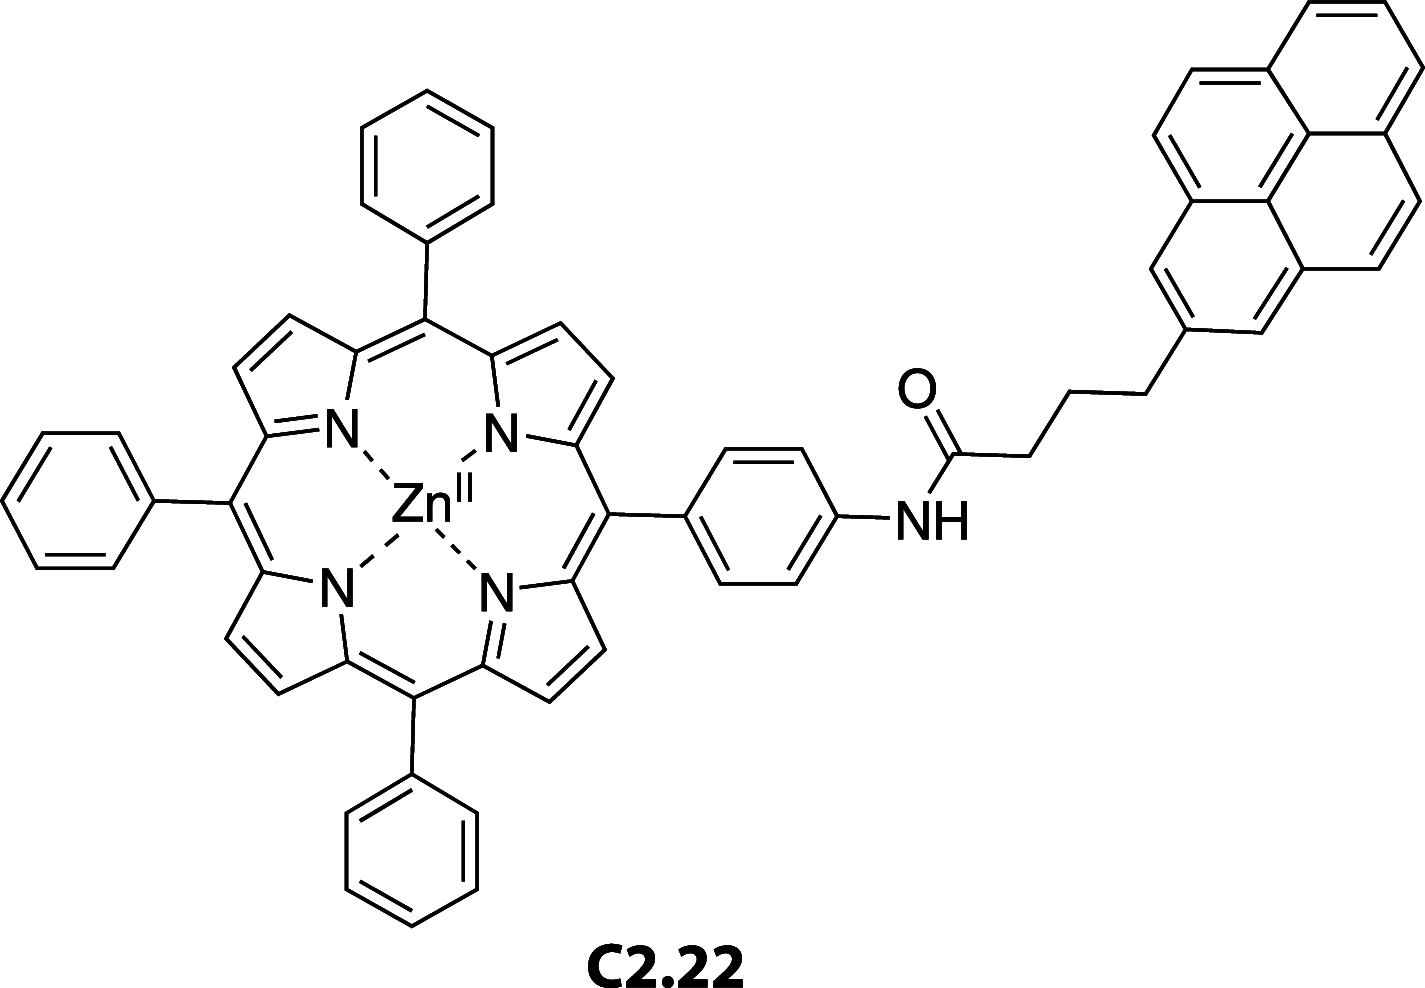
Chemical structure of the zinc porphyrin chemosensor C2.22.
Figure 60
Figure 60
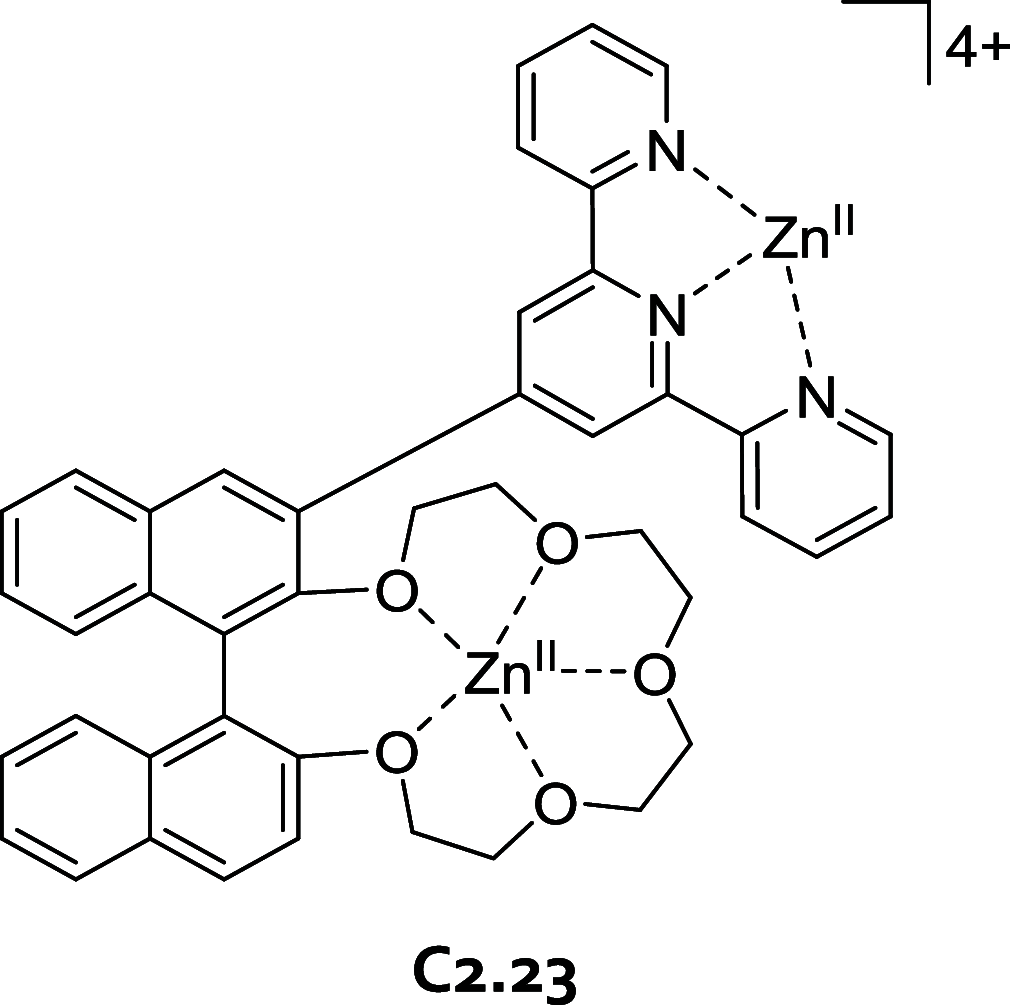
Chemical structure of histidine selective chemosensor C2.23.
Figure 61
Figure 61
(a–c) Three different coumarin-based CuII binding chemosensors (C2.24C2.26) for the detection of histidine that operate through a competitive binding mechanism with emission-quenching CuII ions. (a) Adapted with permission from ref (291). Copyright 2013 The Royal Society of Chemistry.
Figure 62
Figure 62
(a) Chemosensing ensemble C2.27 utilized for the selective detection of histidine obtained by combining CuII-bound paracyclophanes and eosin Y as an indicator dye. (b) Schematic representation of the sensing mechanism for histidine with the sensing ensemble C2.28 in the presence of copper ascorbate. Adapted with permission from ref (296). Copyright 2012 Elsevier BV.
Figure 63
Figure 63
Schematic representation of the emission turn-on indicator displacement assay for the detection of histidine with a heterobimetallic rutheniumII–nickelII complex through competitive binding of NiII ions.
Figure 64
Figure 64
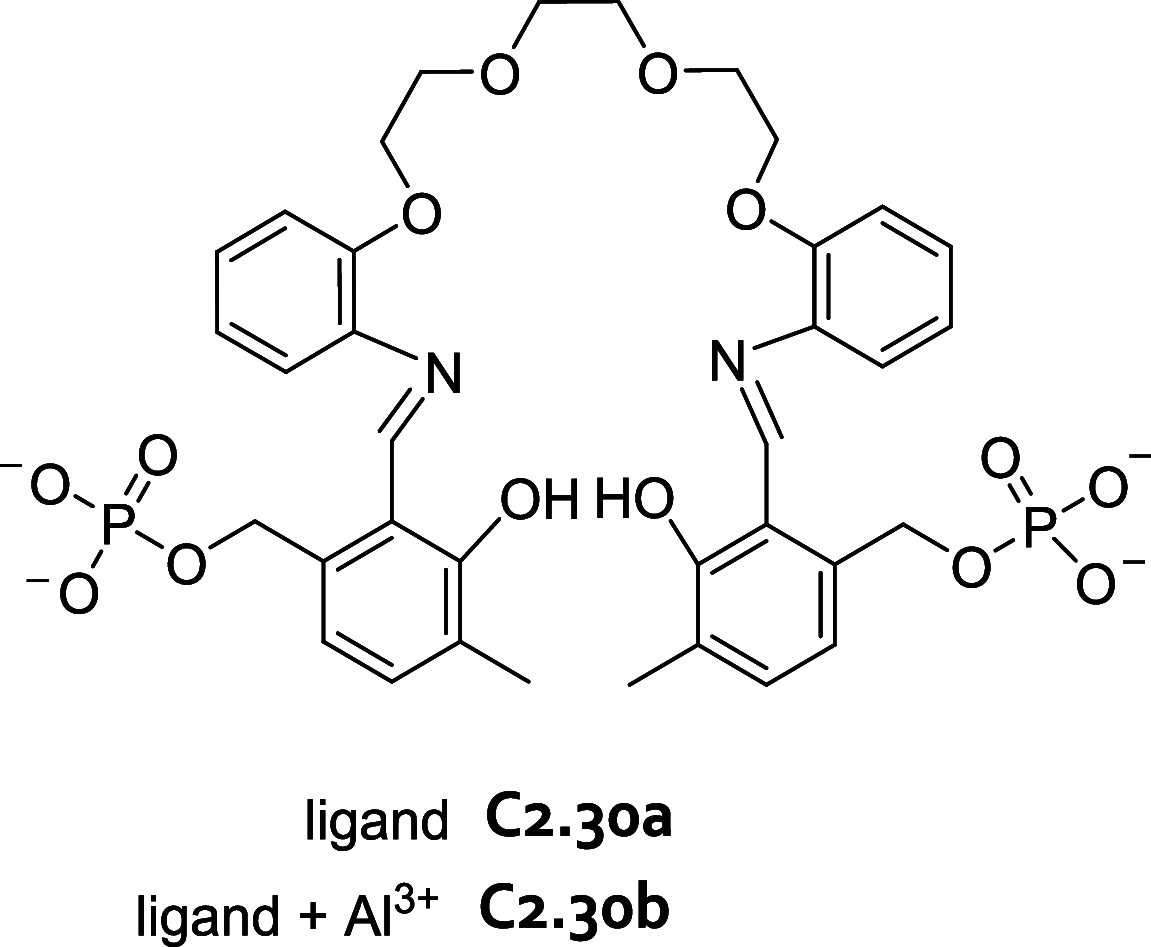
Chemical structure of chemosensor C2.30.
Figure 65
Figure 65
Schematic representation of the chemosensing ensemble C2.31 composed of a guanidinium-functional ZnII complex and the indicator dye pyrocatechol violet for the (selective) detection of the amino acid aspartate in mixed organic–aqueous media.
Figure 66
Figure 66
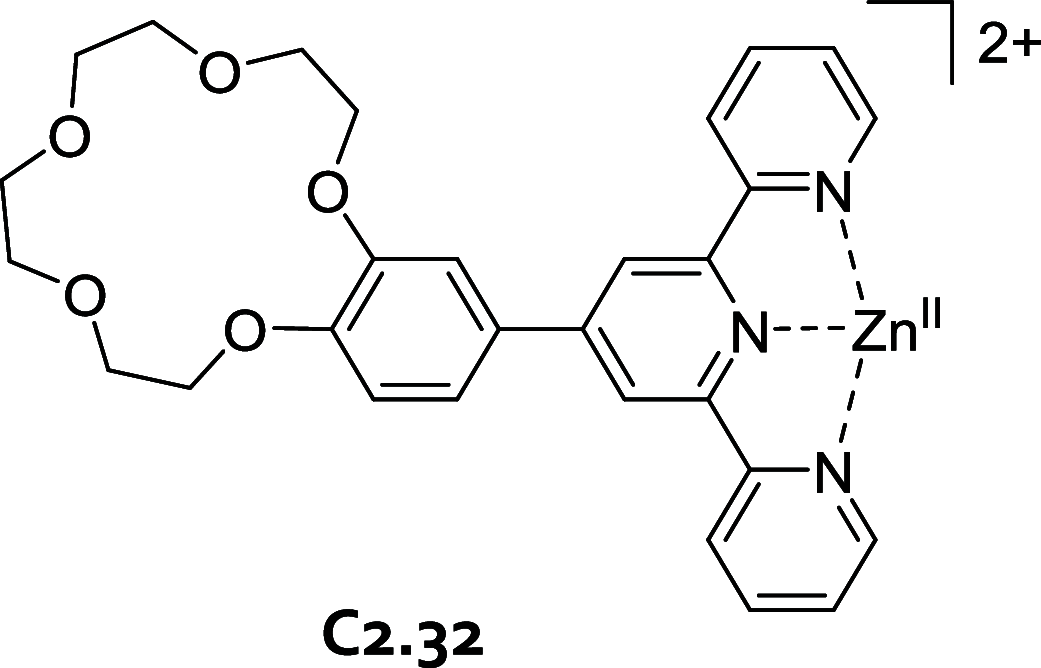
Chemical structure of chemosensor C2.32.
Figure 67
Figure 67
Schematic representation of chemosensor C2.33 upon reaction with phosphatidyl-serine.
Figure 68
Figure 68
p-Sulfonatocalix[4]arene-functionalized plasmonic AuNP (N2.1) for the detection of basic amino acids at μM concentration in PBS, pH 7.0.
Figure 69
Figure 69
Core-shell quantum dots (N2.2) for enantioselective and fluorescence-based detection of tyrosine and phenylalanine in 100 mM phosphate buffer, pH 10.3. Reproduced with permission from ref (309). Copyright 2009 American Chemical Society.
Figure 70
Figure 70
Schematic representation of the preparation of β-CD-functionalized and QD-doped silica particles (N2.3) enabling fluorescence-based detection of l-His in PBS, pH 7.7, at μM concentrations. Adapted with permission from ref (312). Copyright 2016 The Royal Society of Chemistry.
Figure 71
Figure 71
Polymer modified single-walled carbon nanotubes (N2.4) used for the detection of albumin in 1× PBS and urine samples. Adapted with permissions from ref (316). Copyright 2019 Springer Nature.
Figure 72
Figure 72
(a) Fluorescent vesicles (N2.5) used for the detection of thrombin in buffered solutions. (b) Chemical structures of vesicle components. Reproduced with permission from ref (318). Copyright 2014 The Royal Society of Chemistry.
Figure 73
Figure 73
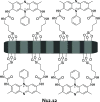
(a) Schematic representation of the luminescent anionic MOF containing the luminescent [Eu(bpda)2] subunits linked to K+ ions (N2.6). (b) Crystal structure of N2.6. Reproduced with permission from ref (323). Copyright 2020 The Royal Society of Chemistry. (c) Chemical structure of the organic ligand 2,2′-bipyridine-6,6′-dicarboxylate (bpda).
Figure 74
Figure 74
Chemical structures of selected amines and polyamines. Note: at physiological pH in biofluids, amines are (partially) protonated.
Figure 75
Figure 75
Chemical structure of P3.1.
Figure 76
Figure 76
Reaction mechanism between P3.2 and n-hexylamine. Reproduced with permission from ref (379). Copyright 2019 The Royal Society of Chemistry.
Figure 77
Figure 77
Chemical structure of creatinine and its tautomeric equilibrium.
Figure 78
Figure 78
Proposed mechanism for the emission-based creatinine detection by an IDA-type metalorganic probe (P3.3). Reproduced with permission from ref (392). Copyright 2016 The Royal Society of Chemistry.
Figure 79
Figure 79
(a) Chemical structure of sensor array P3.4 and (b) reaction of probe P3.4 with an amine (EWG = electron withdrawing group). Adapted with permission from ref (393). Copyright 2015 American Chemical Society.
Figure 80
Figure 80
(a) The chemical structure of chemosensor C3.1. (b) Proposed mechanism of spermine detection with self-assembled chemosensor C3.1. Adapted with permission from ref (394). Copyright 2012 The Royal Society of Chemistry.
Figure 81
Figure 81
Schematic representation of a fluorescent turn-on sensing mechanism for polyamine cations using anionic chemosensor C3.3. Adapted with permission from ref (396). Copyright 2016 The Royal Society of Chemistry.
Figure 82
Figure 82
Chemical structures of (a) a p-sulfonatocalix[4]arene-based chemosensor (C3.4) and (b) a tetracationic porphyrin that can be used to modulate the sensitivity of chemosensor C3.4 for the target analyte spermine.
Figure 83
Figure 83
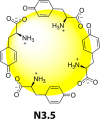
A fluorescent indicator dye that in combination with the host CB6 can be used as a chemosensing ensemble (C3.5) for the detection of biogenic amines in aqueous media.
Figure 84
Figure 84
Chiral host nor-seco-cucurbit[6]uril diastereoselectively recognizes some chiral amines in aqueous media.
Figure 85
Figure 85
Schematic representation of creatinine binding with chemosensor C3.6.
Figure 86
Figure 86
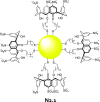
p-Sulfonatocalix[6]arene-modified gold nanoparticles N3.1 used for colorimetric detection of diaminobenzene isomers at μM concentrations in water. Reproduced with permission from ref (407). Copyright 2009 Elsevier BV.
Figure 87
Figure 87
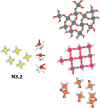
β-CD-functionalized silver nanoparticles N3.2 used for the selective detection of phenylenediamine isomers in water. Adapted with permission from ref (408). Copyright 2010 American Chemical Society.
Figure 88
Figure 88
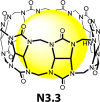
Schematic representation of the supramolecular inclusion complex N3.3 of a AuNPs and cucurbit[7]uril (CB7) used for the colorimetric detection of small aliphatic amines in water.
Figure 89
Figure 89
BODIPY-functionalized AuNPs (N3.4) used for fluorescent turn-on detection of spermine and spermidine in 10 mM HEPES buffer, pH 7.4, at μM concentrations.
Figure 90
Figure 90
Oxidized tyrosine-doped gold nanoparticles N3.5 used for colorimetric detection of the biogenic polyamines spermidine and spermine at nM and μM concentrations in PBS and biological samples.
Figure 91
Figure 91
Surface plasmon coupled emission-based detection of spermidine at fM concentrations in water using silica gold nanohybrid particles (N3.6). Reproduced with permission from ref (412). Copyright 2020 American Chemical Society.
Figure 92
Figure 92
(a) Polyamines such as spermine and spermidine diffuse into the pores of CuII complex-based nanoparticles (N3.7). (b) Polyamines displace the solvent from the CuII centers, changing the photophysical properties of N3.7 and allowing the detection of spermine and spermidine at nM concentrations in water. Adapted with permission from ref (414). Copyright 2017 American Chemical Society.
Figure 93
Figure 93
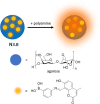
3-((7-Hydroxy-4-methylcoumarin)methylene)aminophenylboronic acid-doped agarose nanoparticles (N3.8) used for the detection of spermine and spermidine in HEPES buffer, blood, and urine samples at μM concentrations.
Figure 94
Figure 94
(a) α-cyclodextrin (N3.10) and (b) CB6 (N3.11) functionalized gold nanoparticles used for colorimetric detection of cadaverine in water samples at μM concentrations.
Figure 95
Figure 95
2,4,6-Triphenylpyrylium-functionalized and hexamethyldisilazane surface passivated mesoporous silica nanoparticles (N3.12) used for colorimetric detection of aliphatic amines in water (pH 7.0–10.0).
Figure 96
Figure 96
Uric acid-functionalized and Hg2+-doped gold nanoparticles (N3.13) aggregate in the presence of creatinine, allowing for its detection at μM concentrations in water, pH 5.0, in artificial urine and in real urine. Reproduced with permission from ref (419). Copyright 2015 Wiley-VCH.
Figure 97
Figure 97
(a) Picric acid-functionalized gold nanoparticles (N3.14) used for colorimetric detection of creatinine in phosphate buffer, pH 7.0, and human serum at μM concentrations. (b) Interaction between picric acid and creatinine.
Figure 98
Figure 98
Gluten-coated and picric acid-functionalized gold nanoclusters (N3.15) allow fluorescence turn-on detection of creatinine in phosphate buffer, pH 9.0, and blood samples at μM concentrations.
Figure 99
Figure 99
Citrate-capped AgNPs (N3.16) form a stable H-bonding network with creatinine allowing for its colorimetric detection in 10 mM NaOH, pH 12.0, and in basic urine samples at μM concentrations.
Figure 100
Figure 100
Europium-doped amorphous calcium phosphate nanoparticles N3.17 enable fluorescence turn-off detection of creatinine at μM concentration in citrate buffer and urine samples. Reproduced with permission from ref (425). Copyright 2020 Elsevier BV.
Figure 101
Figure 101
Plasmonic nanocomposites (N3.18) of cucurbit[7]uril (CB7) and citrate-capped gold AuNPs for creatinine detection. Reproduced with permission from ref (428). Copyright 2020 The Royal Society of Chemistry.
Figure 102
Figure 102
8-Hydroxy-2-quinolinecarboxaldehyde and Al3+ cations doped UiO-66 MOFs (N3.19) allow for fluorescence-based detection of creatinine (μM concentrations) in PBS, diluted urine, and serum samples.
Figure 103
Figure 103
Selected examples of important neurotransmitters (NTs). Possible chemical anchors/molecular recognition motifs that can be targeted by probes, chemosensors, and nanosensors are indicated for dopamine and serotonin.
Figure 104
Figure 104
(a) Synthetic probes (P4.1 and P4.2) with aldehyde and boronic acid functional groups that can be used for the selective detection of primary amine catecholamines. (b) Chemical structures of other catecholamine probes (P4.3P4.7) that feature a boronic acid recognition motif.
Figure 105
Figure 105
Schematic representation of the selectivity of PDI•CB8 (C4.1) towards dopamine in the presence of other catecholamine neurotransmitters, i.e., epinephrine and norepinephrine. Adapted with permission from ref (493). Copyright 2013 Taylor & Francis.
Figure 106
Figure 106
Schematic representation of a chemosensing ensemble (C4.2) based on a combination of fluorescent dyes and cucurbit[n]urils.
Figure 107
Figure 107
Chemical structure of a fluorescent CB6 derivative (C4.3).
Figure 108
Figure 108
Schematic representation of reactions catalyzed by acetylcholinesterase and choline oxidase and the corresponding (enzyme-coupled) tandem assay with chemosensor C4.4 consisting of lucigenin and sCx4. Reproduced with permission from ref (217). Copyright 2011 The Royal Society of Chemistry.
Figure 109
Figure 109
Chemical structures of the discussed fluorescent dye and p-sulfonatocalixarenes (sCxn).
Figure 110
Figure 110
Chemical structure of the ZnII salphen complex (C4.6).
Figure 111
Figure 111
Schematic representation of the chemosensing ensemble (C4.7) composed of a functionalized, negatively charged β-CD host and thiazole orange as a fluorescent reporter dye. Reproduced with permission from ref (502). Copyright 2019 Wiley-VCH.
Figure 112
Figure 112
Chemical structures of the cyanine-based chemosensor (C4.8) and the Nile Red-based chemosensor (C4.9) for histamine detection.
Figure 113
Figure 113
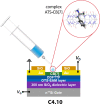
Schematic representation of the top-contact OFET drug sensor platform (C4.10) based on the supramolecular complex of CB7 and amphetamine-type stimulants (ATS). Adapted with permission from ref (505). Copyright 2017 Elsevier BV.
Figure 114
Figure 114
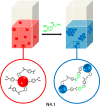
Schematic representation of the colorimetric detection of norepinephrine using aldehyde and phenylboronic acid functionalized AuNPs (N4.1) in phosphate buffer at μM concentrations. Reproduced with permission from ref (508). Copyright 2019 American Chemical Society.
Figure 115
Figure 115
Schematic representation of the working principle of 19F NMR spectroscopy-based IDA for the detection of dopamine (N4.8). Reproduced with permission from ref (518). Copyright 2018 Wiley-VCH.
Figure 116
Figure 116
Bifunctional carbon dots (N4.9) bearing boronic acid and amino groups are used for the detection of dopamine in water and serum samples down to nM concentrations.
Figure 117
Figure 117
Fe3+-doped carbon dots (N4.10) for fluorescence-based detection of dopamine at nM concentrations in HEPES buffer.
Figure 118
Figure 118
(a) Schematic representation of 2,7-diazapyrenium (DAP) functionalized silica nanoparticles (N4.11) for the fluorescence-based detection of dopamine in phosphate buffer containing 100 mM NaCl, pH 7.0. (b) Chemical structures of CB8 and silica-bound DAP.
Figure 119
Figure 119
Bacterial cytochrome P450-BM3 heme domain protein- or tyramine-functionalized superparamagnetic iron oxide nanoparticles (SPIOs, N4.12) used for MRI-based detection of dopamine and serotonin in PBS at μM concentrations. Reproduced with permission from ref (524). Copyright 2019 American Chemical Society.
Figure 120
Figure 120
ssDNA functionalized SWCNTs (N4.13) used for fluorescence-based detection of dopamine at μM concentrations in PBS.
Figure 121
Figure 121
Biocompatible polymeric nanoparticles N4.14 allow for fluorescence turn-off detection of dopamine at μM concentrations in 20 mM PBS, pH 7.4. Reproduced with permission from ref (526). Copyright 2015 American Chemical Society.
Figure 122
Figure 122
(a) Schematic representation of core–shell particles N4.15 used for fluorescence-based detection of dopamine in PBS and human serum at nM and μM concentrations. (b) Paper strips were impregnated with N4.15 by a soaking procedure and used for biofluid analysis. Reproduced with permission from ref (528). Copyrights 2019 Wiley-VCH.
Figure 123
Figure 123
Schematic representation of preparation and sensing with reporter dye-loaded zeolite-based chemosensors (N4.34). Adapted with permission from ref (547). Copyright 2021 Wiley-VCH.
Figure 124
Figure 124
Chemical structures of selected carbohydrates.
Figure 125
Figure 125
Thermodynamic cycle of the reversible transformation of boronic acids with 1,2-diols to boronic esters.
Figure 126
Figure 126
(a) Chemical structures of the d-glucose-sensing probes P5.1P5.3. (b) Schematic representation of the binding of a saccharide to the molecular probes P5.2 and P5.3. Adapted with permission from ref (596). Copyright 2002 The Royal Society of Chemistry.
Figure 127
Figure 127
Chemical structures of probe P5.4 and P5.5.
Figure 128
Figure 128
Chemical structures of probes P5.6P5.9.
Figure 129
Figure 129
(a) Schematic representation showing the binding of d-glucose and d-fructose to a molecular tweezer. (b) Chemical structure of molecular probe P5.10. Adapted with permission from ref (602). Copyright 2009 The Royal Society of Chemistry.
Figure 130
Figure 130
Schematic representation of the binding event of d-glucosamine to probe P5.11, causing a fluorescence turn-on.
Figure 131
Figure 131
Schematic representation of heparin binding to probes P5.12 and P5.13. While probe P5.12 operates through an IDA mechanism, probe P5.13 is inherently fluorescent and can be used in a DBA. Adapted with permission from ref (606). Copyright 2002 American Chemical Society.
Figure 132
Figure 132
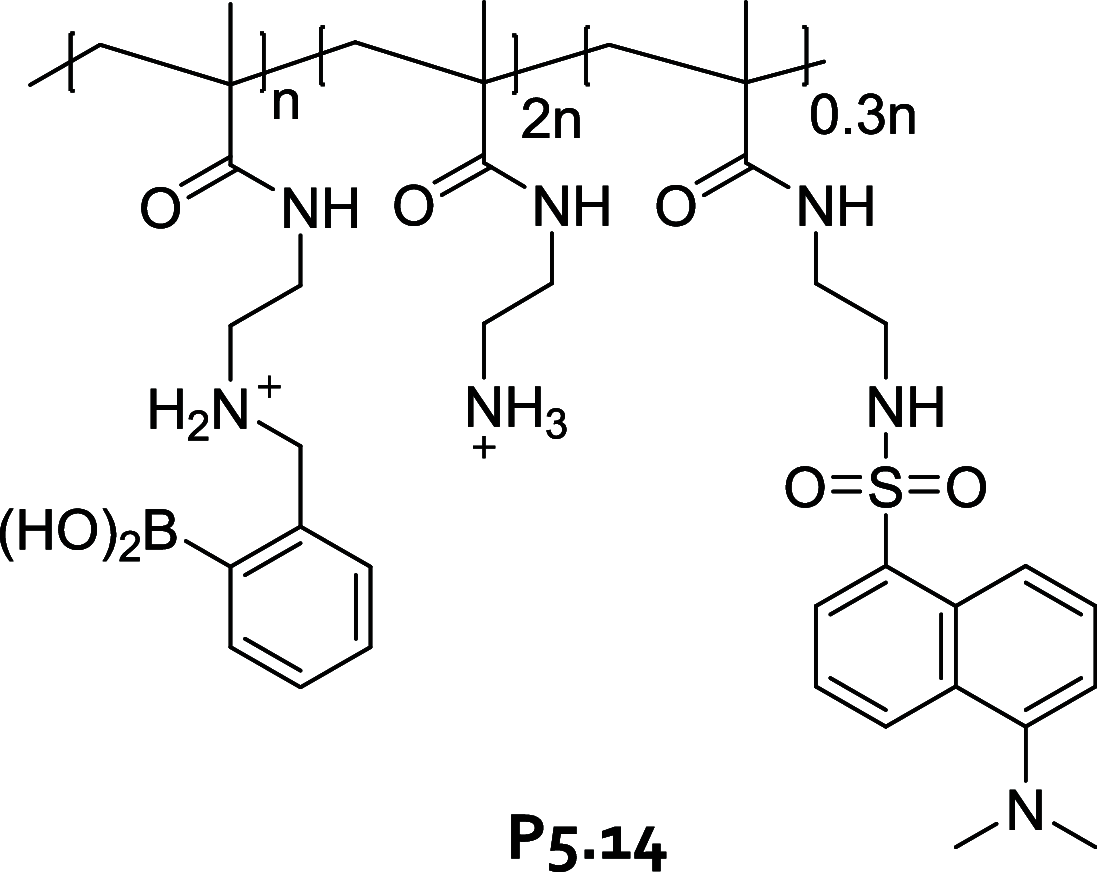
Chemical structure of the copolymer-based probe P5.14.
Figure 133
Figure 133
(a) Chemical structure of d-glucose sensing with probe P5.15. (b) Interaction of probe P5.16 (2:2 complex) with d-glucose and d-fructose. Adapted with permission from refs (609) and (610). Copyrights 2009 and 2012 The Royal Society of Chemistry.
Figure 134
Figure 134
Proposed mechanism for the d-glucose-specific sensing with probe P5.17. Adapted with permission from ref (614). Copyright 2010 American Chemical Society.
Figure 135
Figure 135
(a) Chemical structures of the probes P5.18P5.20. (b) Proposed binding mechanism for d-glucose binding of probe P5.18, causing an emission turn-on response. Adapted with permission from ref (615). Copyright 2013 Elsevier BV.
Figure 136
Figure 136
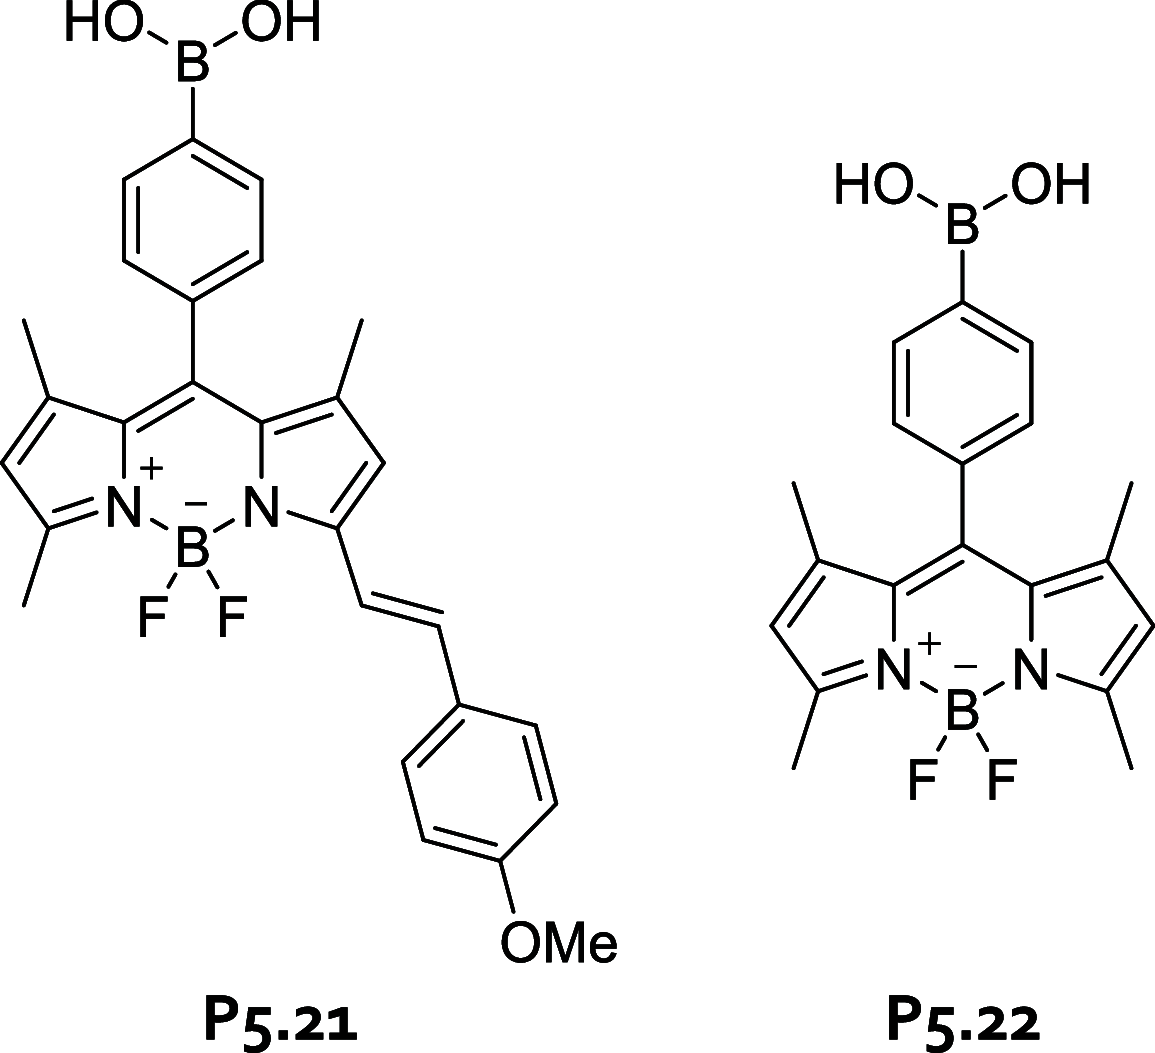
Chemical structures of probes P5.21 and P5.22.
Figure 137
Figure 137
Detection mechanism of d-glucose with the azaBODIPY modified probe P5.23. Adapted with permission from ref (618). Copyright 2015 American Chemical Society.
Figure 138
Figure 138
Schematic representation of the 1:1 fructose complex and the 1:2 glucose aggregate formed with P5.24. Adapted with permission from ref (619). Copyright 2013 American Chemical Society.
Figure 139
Figure 139
(a) Schematic representation of probe P5.25 that releases the indicator dye hematoxylin upon d-glucose binding. (b) Linear discriminant analysis (LDA) score plot of the interaction of P5.25 with several different mono- and disaccharides in 50 mM HEPES buffer, pH 7.4. Adapted with permission from ref (620). Copyright 2019 American Chemical Society.
Figure 140
Figure 140
Schematic representation of d-glucose binding to the phenylboronic acid-based hydrogel matrix P5.26 and resulting swelling of the hydrogel matrix. Adapted with permission from ref (621). Copyright 2019 American Chemical Society.
Figure 141
Figure 141
(a) Photograph of the sensor device developed by Senseonics. (b) Schematic representation of the glucose sensing mechanism for probe P5.27. Adapted with permission from ref (17). Copyright 2014 Elsevier BV.
Figure 142
Figure 142
Schematic representation of glucose sensing with probe P5.28.
Figure 143
Figure 143
Schematic representation of the temple design for synthetic lectins. Reproduced with permission from ref (624). Copyright 2019 Wiley-VCH.
Figure 144
Figure 144
Chemical structure of the macrotricyclic chemosensor C5.1. Adapted with permission from ref (627). Copyright 2005 Wiley-VCH.
Figure 145
Figure 145
(a) Chemical structure of the monocyclic lectin-based chemosensor C5.2. (b) 3D structure for the complex of C5.2 with methyl-β-d-glucoside. Reproduced with permission from ref (582). Copyright 2012 Springer Nature.
Figure 146
Figure 146
Chemical structure of chemosensor C5.3. Reproduced with permission from ref (629). Copyright 2018 Springer Nature.
Figure 147
Figure 147
Chemical structure of Mallard Blue C5.4.
Figure 148
Figure 148
Chemical structure of chemosensor C5.5.
Figure 149
Figure 149
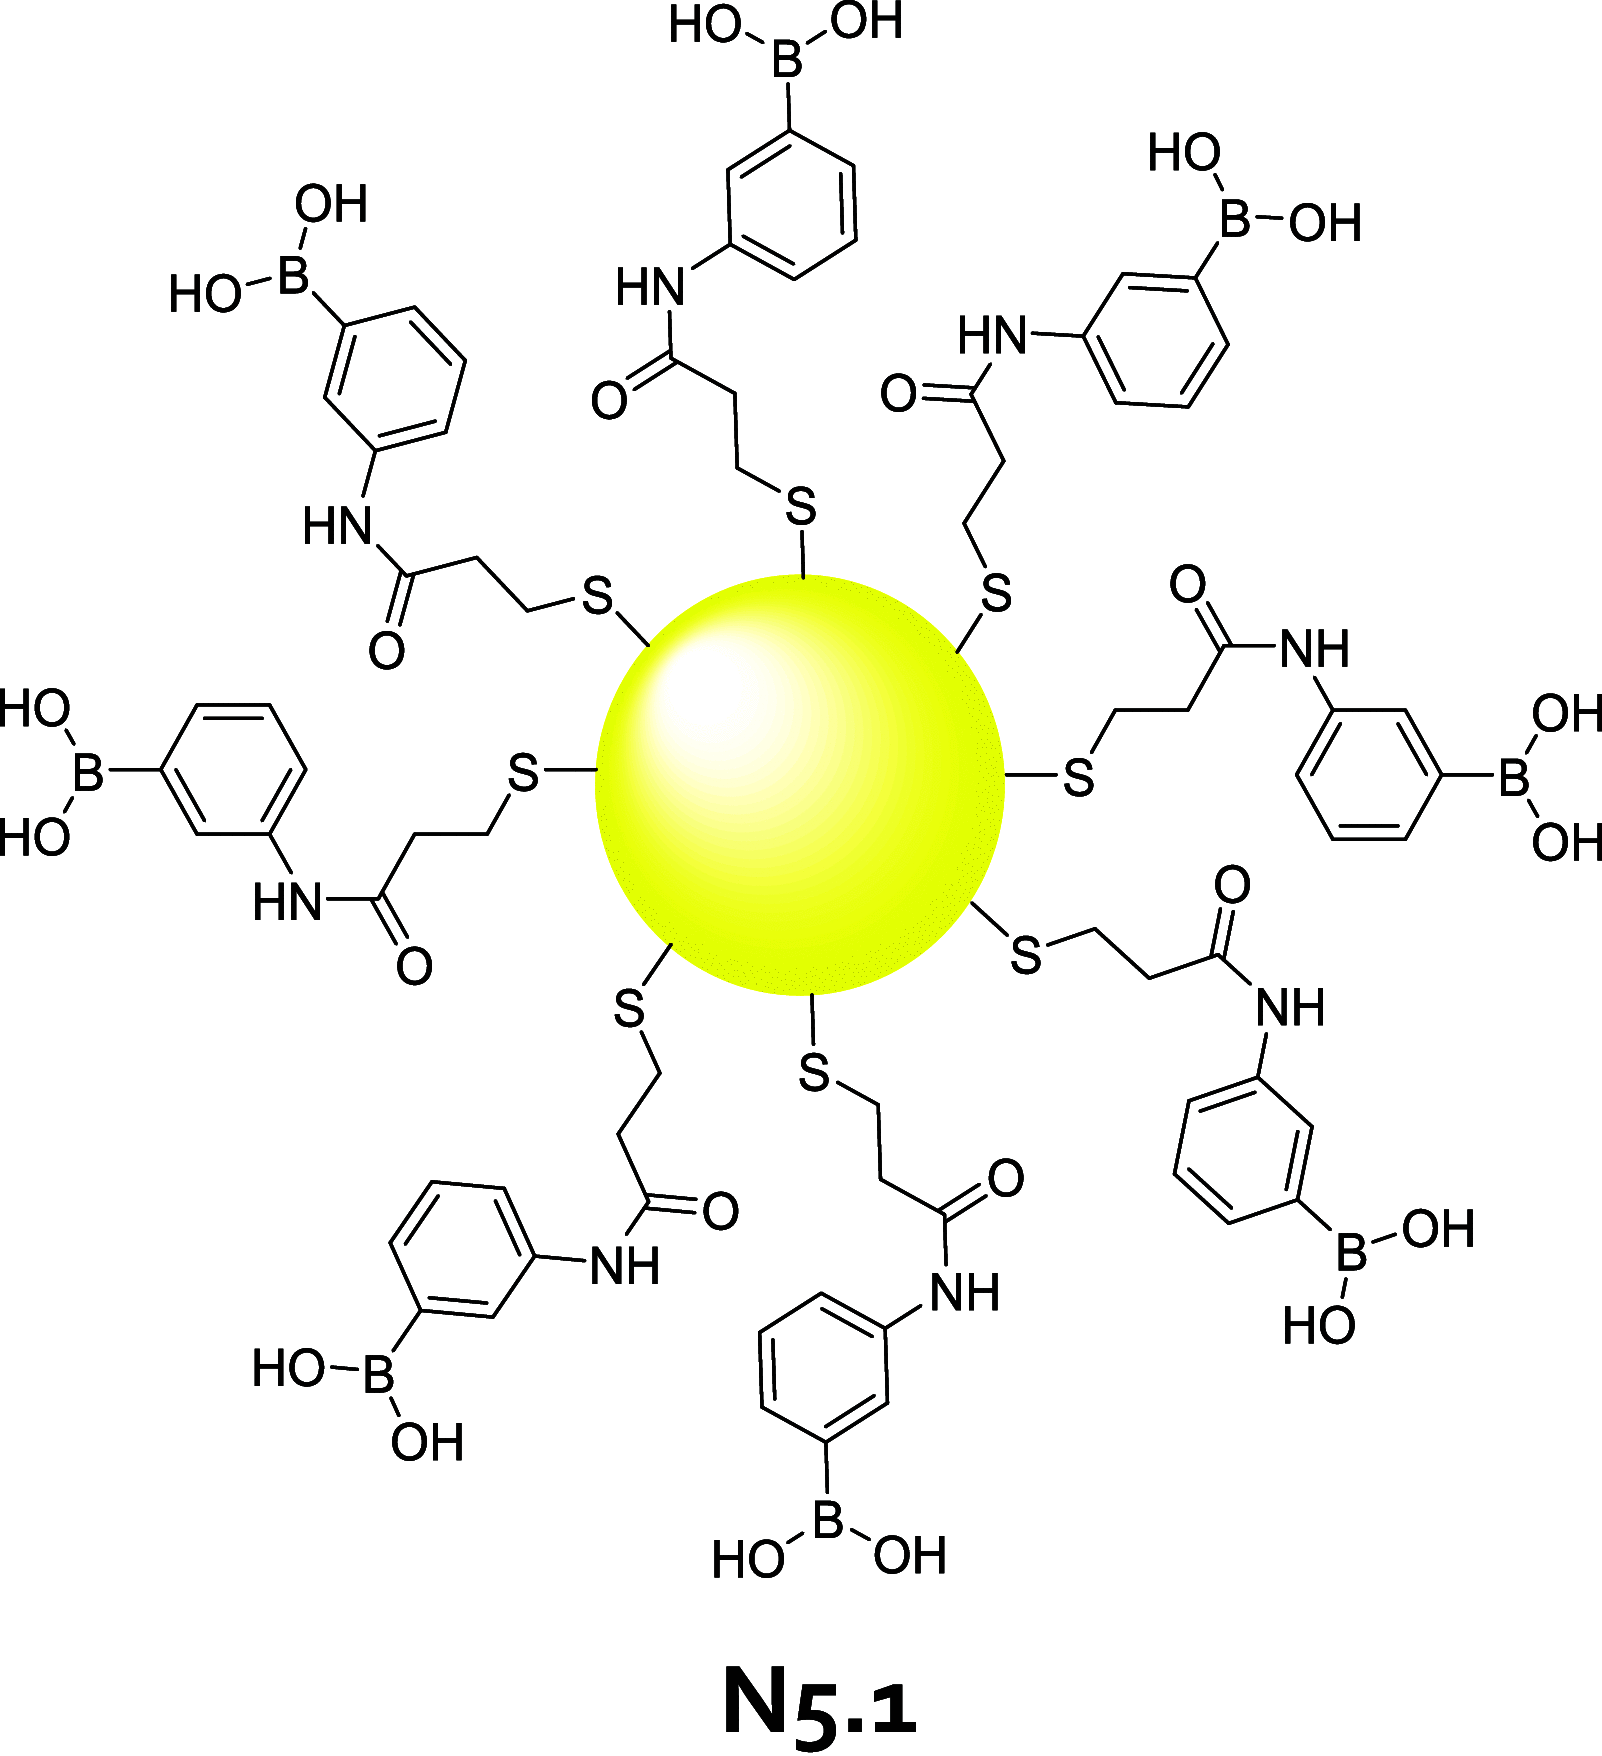
Phenylboronic acid functionalized AuNPs (N5.1) for nM−μM detection of sialic acid in 5 mM phosphate buffer, pH 5.6, and serum samples.
Figure 150
Figure 150
Boronic acid functionalized boron-doped graphene quantum nanodots (N5.2) used for the detection of glucose in phosphate buffer. Reproduced with permission from ref (634). Copyright 2014 American Chemical Society.
Figure 151
Figure 151
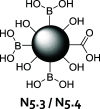
Schematic representation of boronic acid functionalized carbon dots N5.3 and N5.4.
Figure 152
Figure 152
Boronic acid functionalized C-dots (N5.5) used for smartphone-assisted μM glucose detection in water and in human blood samples.
Figure 153
Figure 153
(a) Schematic representation of boronic acid-functionalized carbon-based nanoparticles used in combination with the 9-anthracene methyl acrylate polymer (N5.6) for fluorescence-based glucose detection in water at μM concentrations. (b) Chemical structure of the 9-anthracene methyl acrylate polymer.
Figure 154
Figure 154
(a) Phenylboronic acid-based micelles doped with alizarin red S (N5.7) can be used for the detection of glucose in PBS at mM concentrations. (b) Schematic representation of a proposed mechanism of the fluorescence-based detection of glucose with N5.7. Reproduced with permission from ref (640). Copyright 2019 American Chemical Society.
Figure 155
Figure 155
Chemical structure of tetraphenylethylene-based amphiphilic molecules (TPE4S and TPE4L) used for the preparation of the fluorescent organic nanoparticles N5.8. Adapted with permission from ref (641). Copyright 2020, Wiley-VCH.
Figure 156
Figure 156
Chemical structures of the most common nucleotides, nucleosides, and nucleobases.
Figure 157
Figure 157
Chemical structure of the amino-bearing rhodamine B spirolactam that undergoes environment-responsive ring-opening/-closure, alternating between a nonemissive and an emissive state.
Figure 158
Figure 158
Chemical structures of probes P6.1P6.3 used for the detection of ATP.
Figure 159
Figure 159
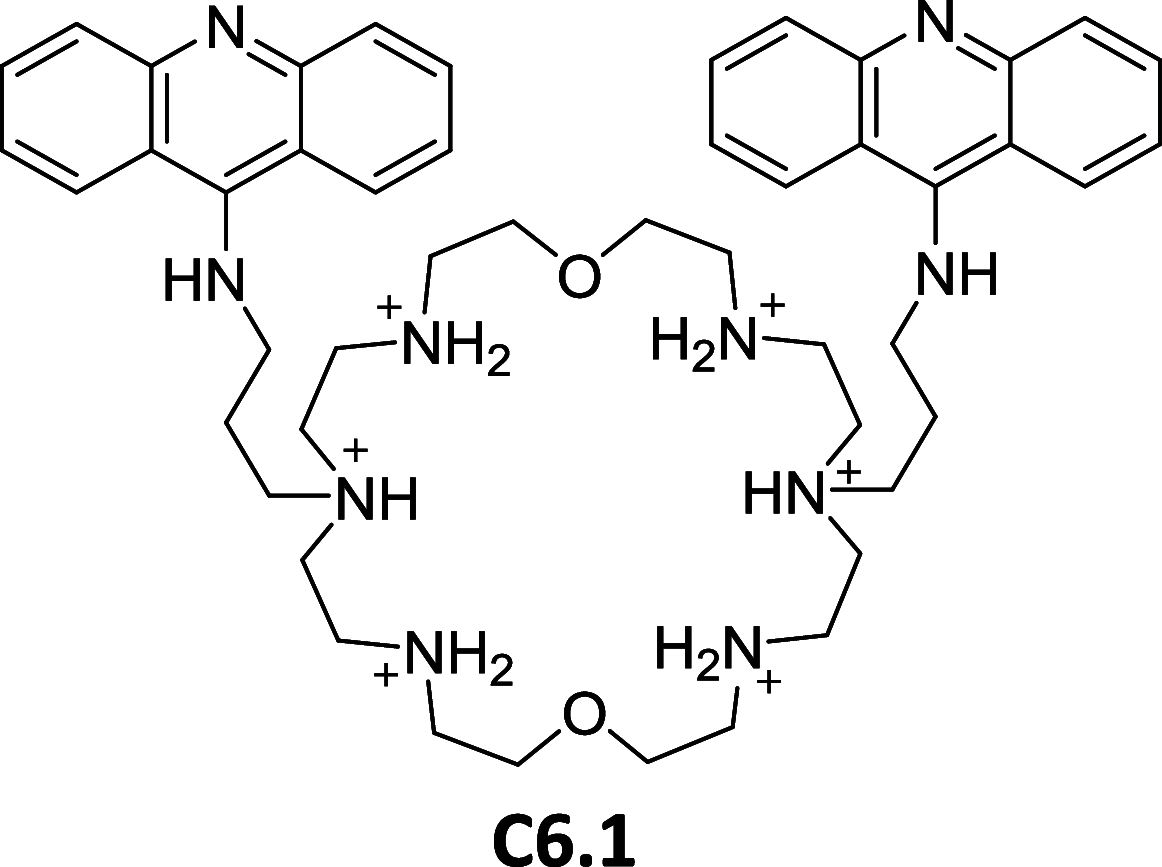
Chemical structure of an acridine-functionalized aza-crown (C6.1) that can be used for the selective detection of NADPH and ATP.
Figure 160
Figure 160
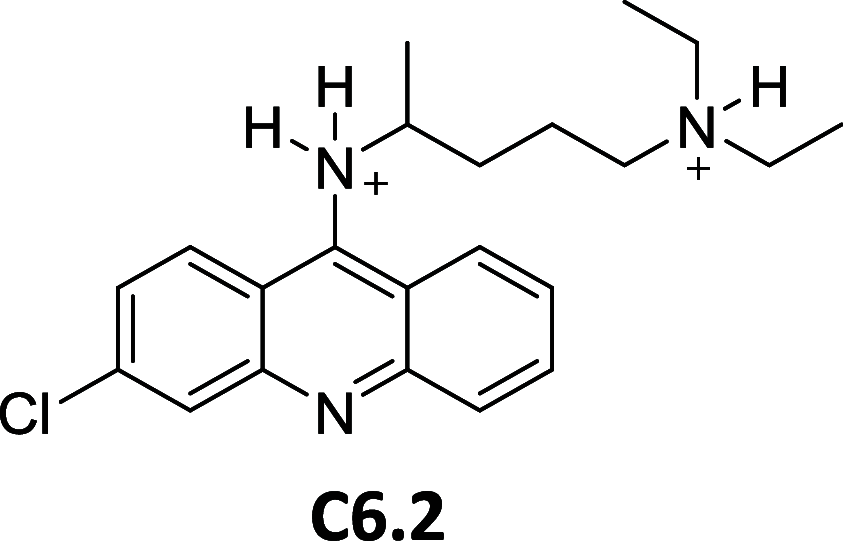
Chemical structure of quinacrine (C6.2) that is commercially available for the detection of polynucleotides in aqueous solutions.
Figure 161
Figure 161
Chemical structure of bisantrene-based chemosensor (C6.3) used for selective fluorescence-based detection of ATP at μM concentrations in Tris buffer.
Figure 162
Figure 162
Chemical structure of terpyridine-based chemosensor (C6.4) that is applicable for μM detection of ATP in HEPES buffer solutions.
Figure 163
Figure 163
Structure of the complex of chemosensor C6.5 with (a) ADP and (b) ATP (Y = EuIII). Reproduced with permission from ref (698). Copyright 2018 Wiley-VCH.
Figure 164
Figure 164
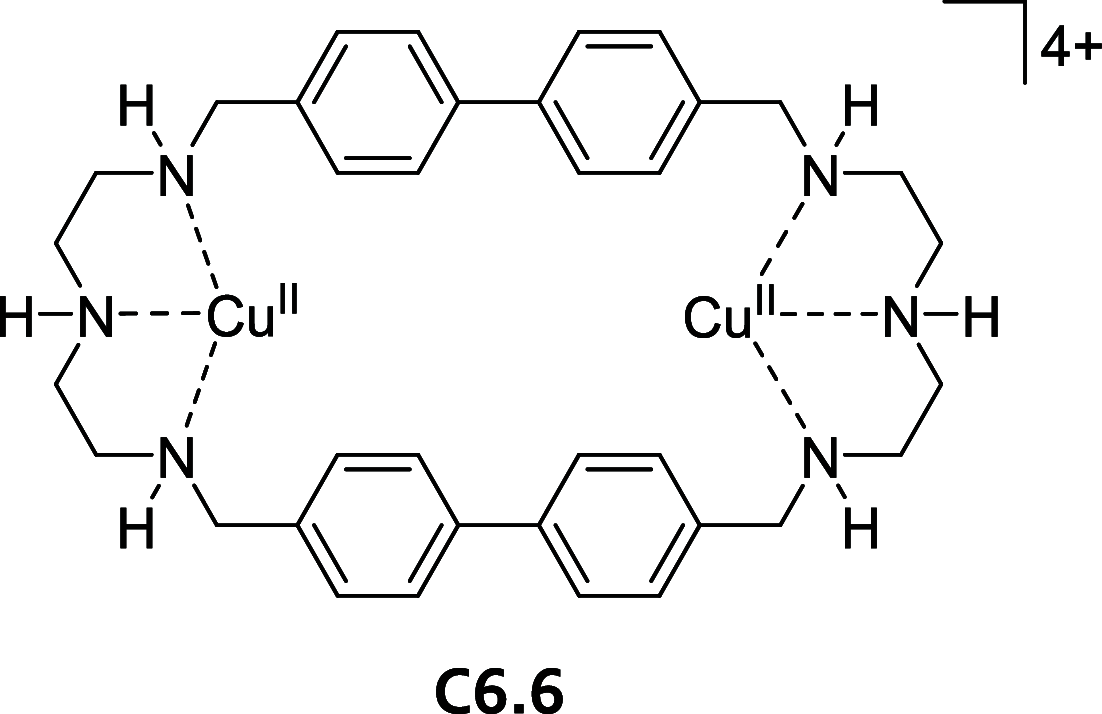
Chemical structure of dicopperII polyazamacrocyclic receptor (C6.6) used for IDA-based detection of ATP (c = 10–6–10–5 M) in HEPES buffer solutions.
Figure 165
Figure 165
Schematic representation of a sulfated β-cyclodextrin that is combined with Zn2+ and the indicator dye thioflavin T to furbish fluorescence turn-on chemosensor ensemble (C6.7) for the detection of ATP in water and human serum samples at μM concentrations. Adapted with permission from ref (703). Copyright 2020 The Royal Society of Chemistry.
Figure 166
Figure 166
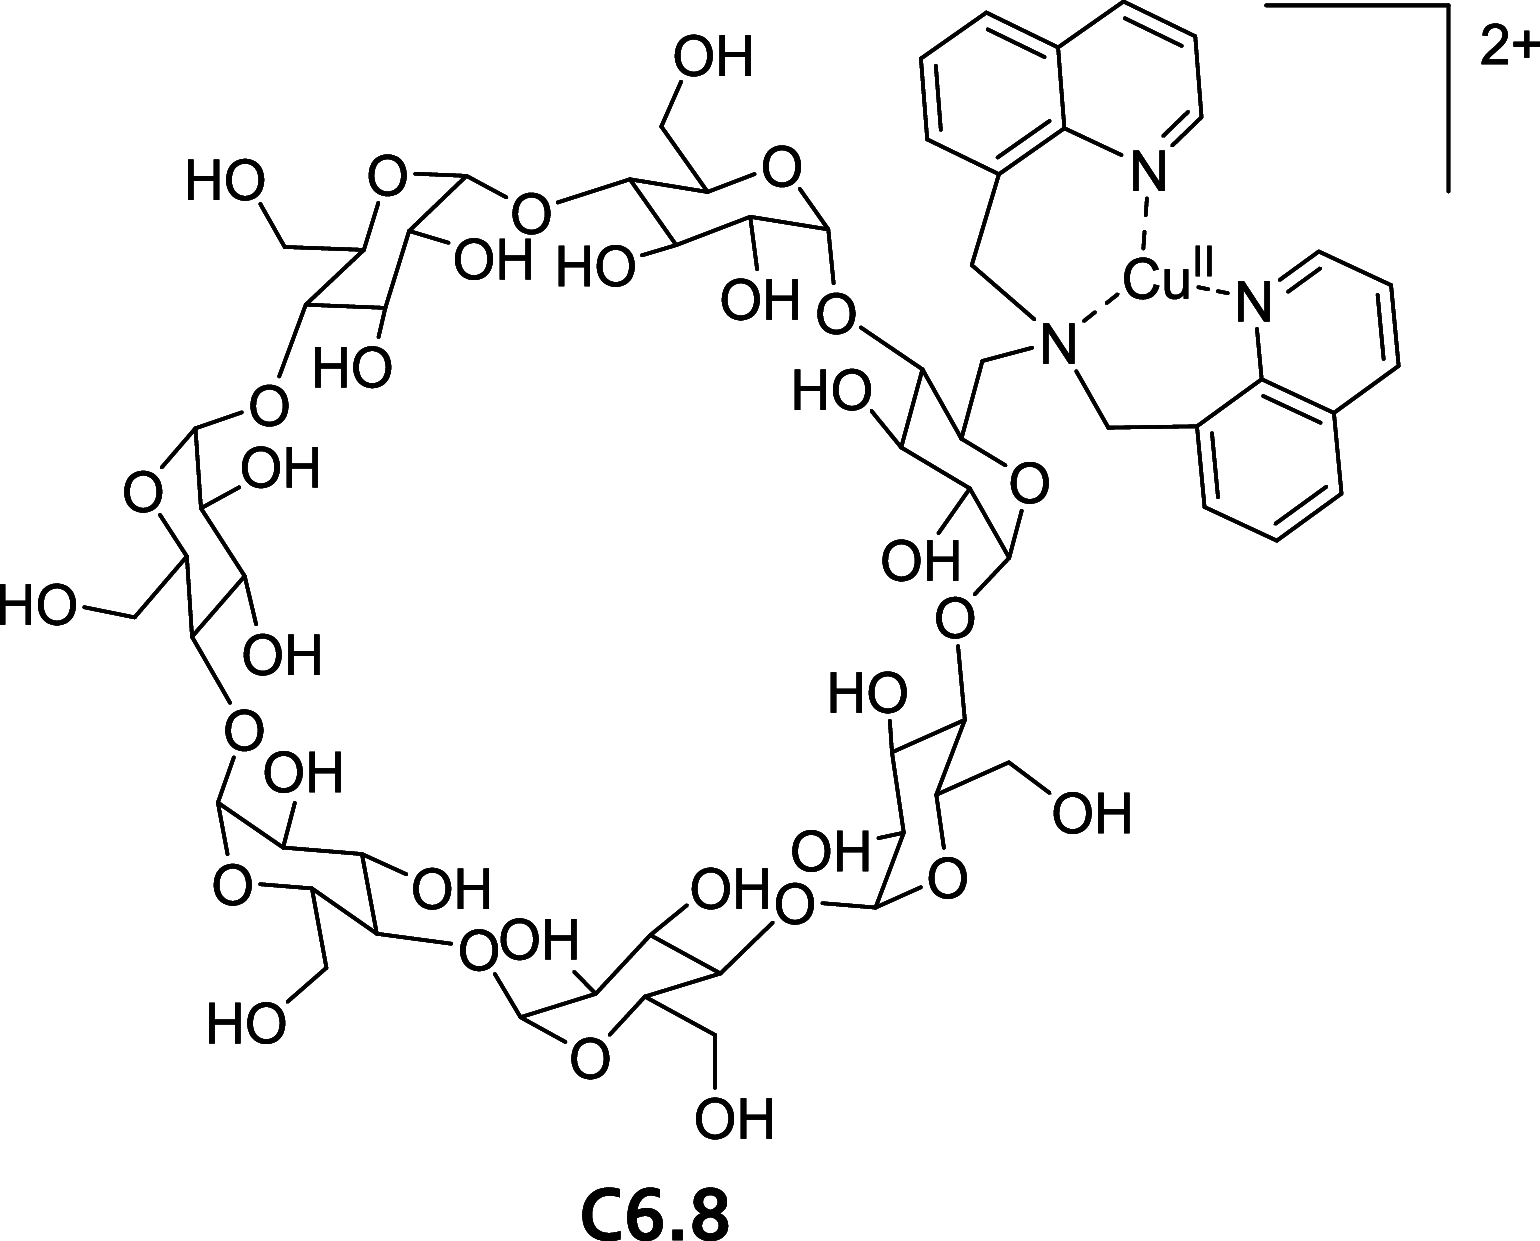
Chemical structure of quinoline-functionalized β-cyclodextrin CuII-complex (C6.8) used for the detection of AMP, ATP, and ADP in HEPES buffer at μM concentrations.
Figure 167
Figure 167
(a) Chemical structure of acyclic and positively charged CBn-type chemosensor (C6.9). (b) 3D rendering of an acyclic and positively charged CBn-analogue that is bound to ATP. Reproduced with permission from ref (708). Copyright 2016 Taylor & Francis.
Figure 168
Figure 168
Chemical structures of positively charged chemosensors used for the detection of nucleosides. (a) Phenanthroline-based polyamine receptor C6.10. (b) Anthraquinone-functionalized tetrandrine derivative C6.11. (c) Polycationic pyrenophane-based chemosensor C6.12.
Figure 169
Figure 169
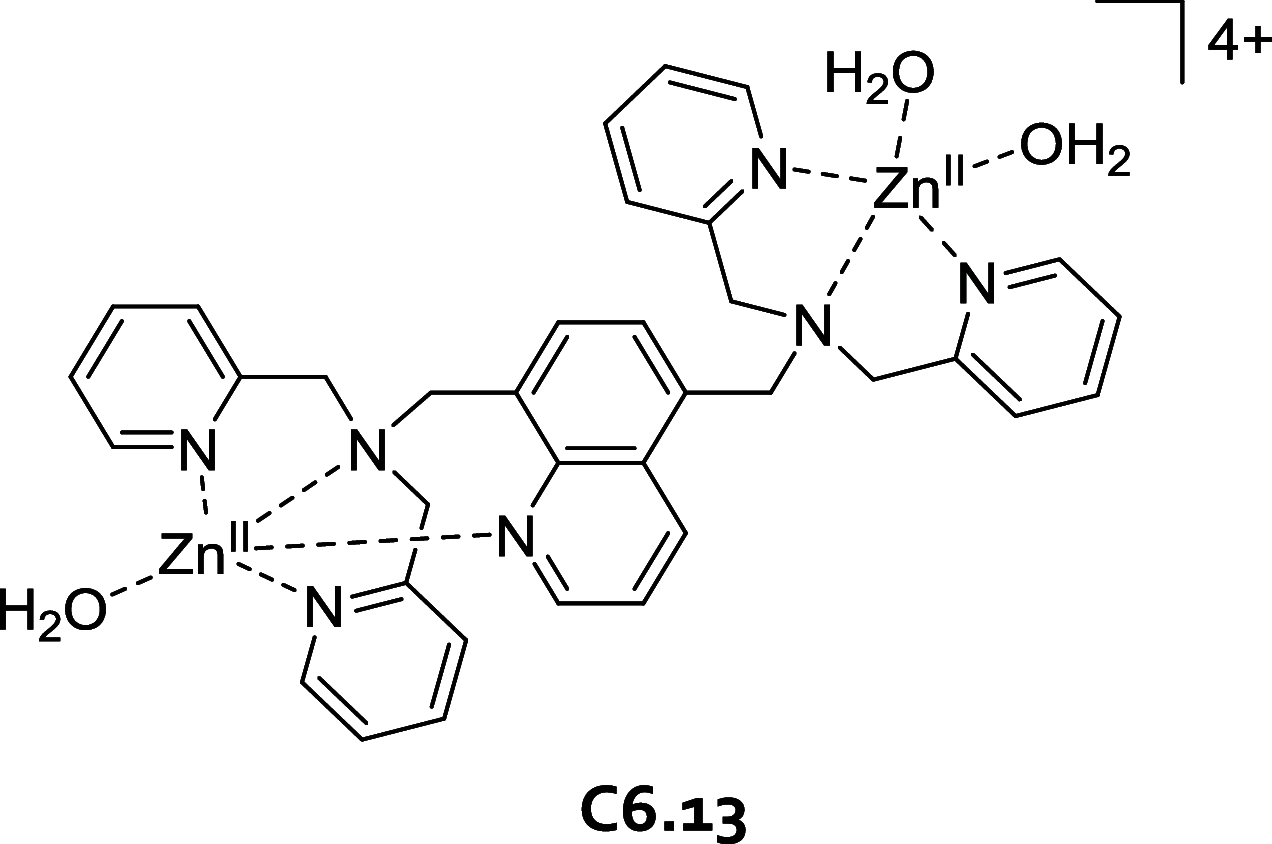
Chemical structure of dinuclear ZnII–dipicolylamine (ZnII–dpa) complex (C6.13) that can be used for the selective detection of GTP.
Figure 170
Figure 170
(a) Cyclophane-based chemosensor (C6.14) and (b) indicator dye 8-hydroxypyrene-1,3,6-trisulfonic acid (HPTS) used for IDA-based detection of GTP.
Figure 171
Figure 171
Chemical structures of selected EuIII- and TbIII-based anion receptors used in an array-based assay design for fluorescence-based nucleoside phosphate detection at mM concentration in 10 mM HEPES buffer, pH 7.0. Adapted with permission from ref (716). Copyright 2020 The Royal Chemical Society.
Figure 172
Figure 172
Chemical structures of DNA-staining dyes used in commercially available assays.
Figure 173
Figure 173
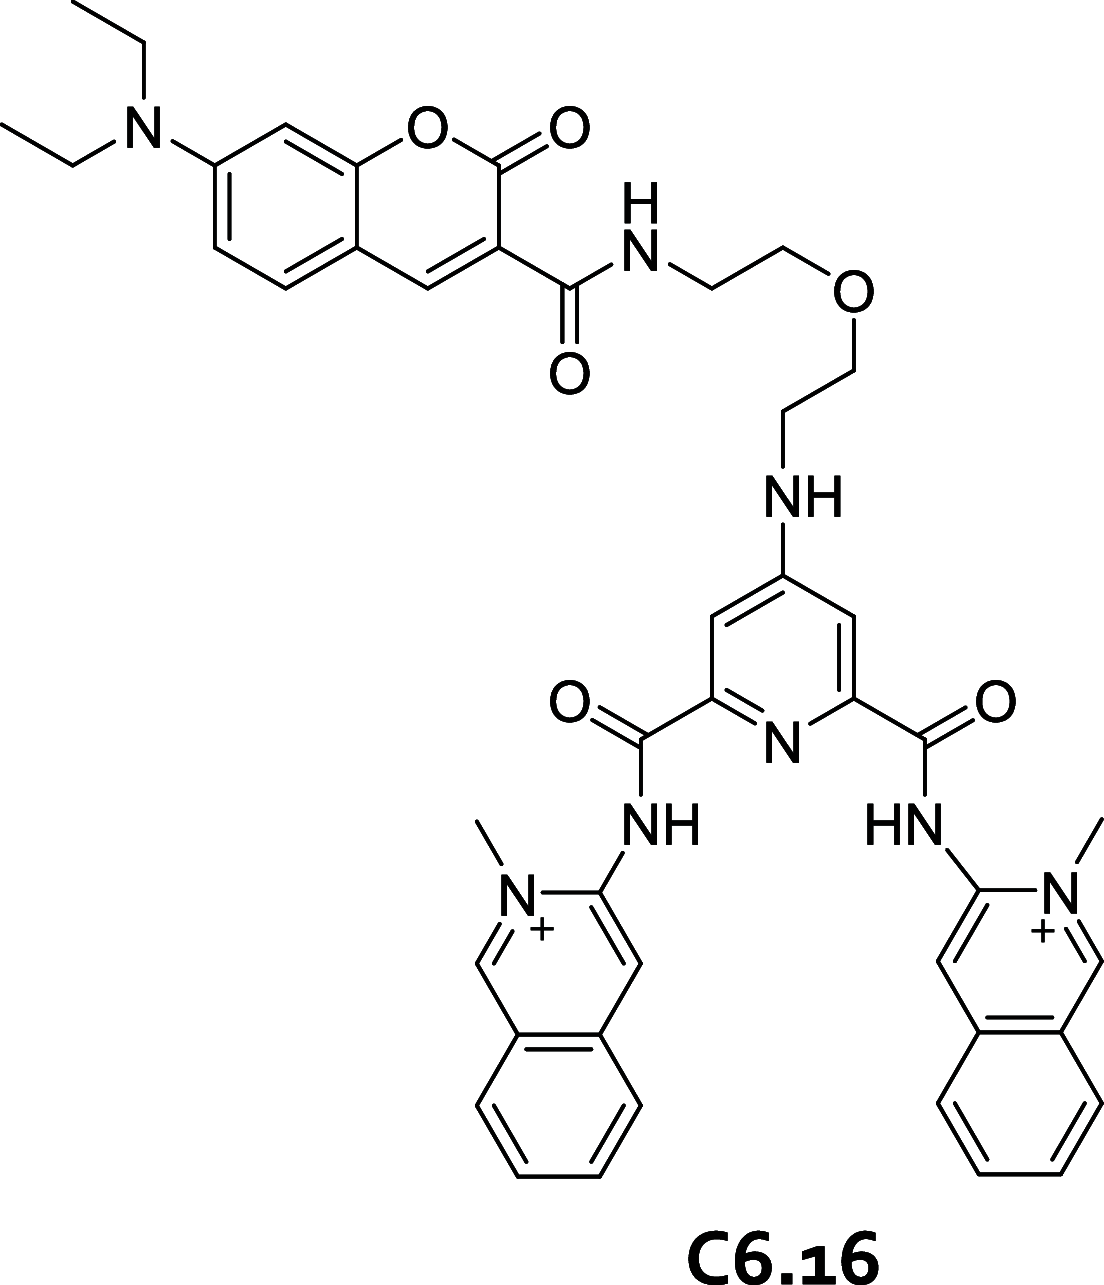
Chemical structure of a bis(quinolinium)pyridodicarboxamide (PDC)-based fluorescent chemosensor (C6.16) for the selective G4 staining of DNA.
Figure 174
Figure 174
(a) Chemical structure of a dapoxyl-dye used in combination with aptamer strands (C6.17) for the detection of DNA polymorphism. (b) Two ssDNA strands (blue and purple) bind a target sequence (black) to form a high affinity “binding pocket” for the dye. Adapted with permission from ref (728). Copyright 2019 American Chemical Society.
Figure 175
Figure 175
Chemical structure of thioflavin T (C6.18).
Figure 176
Figure 176
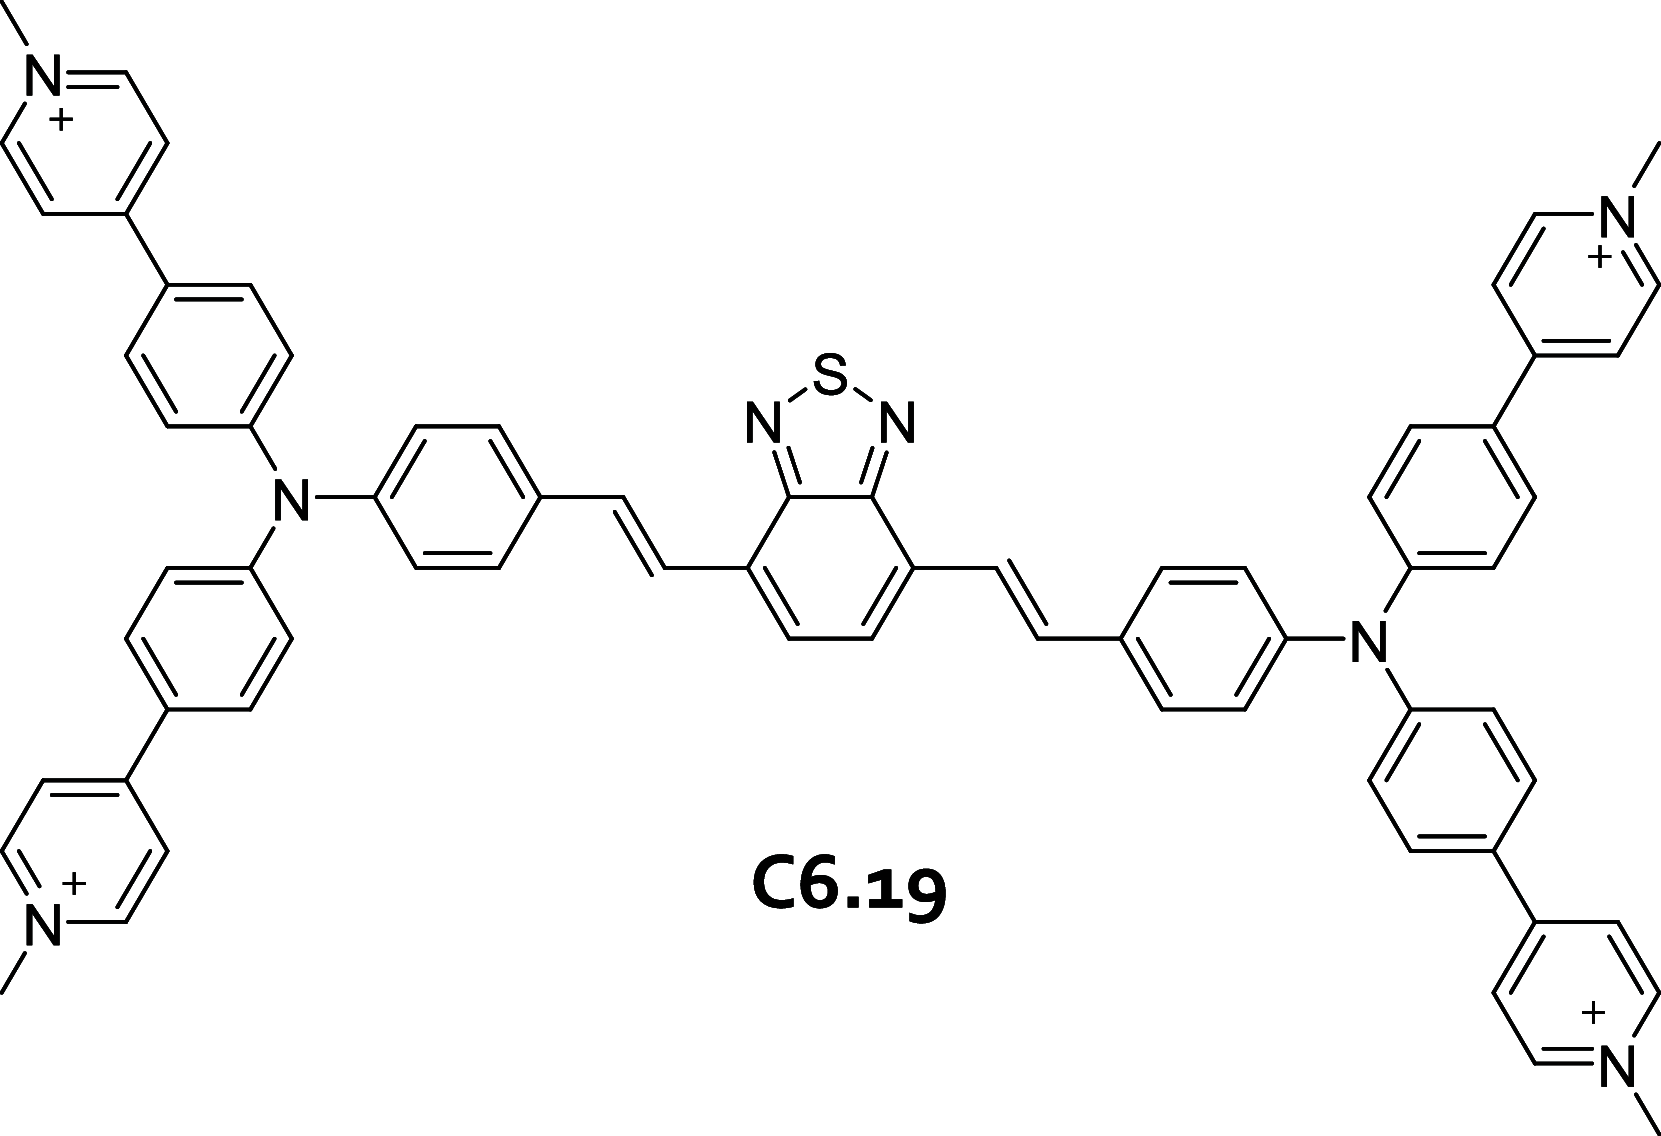
Structure of triphenylamine-based chemosensor (C6.19) for simple fluorescence-based detection of dsDNA at μM concentrations in water.
Figure 177
Figure 177
(a) Chemical structures of a carboxyfluorescein-labelled cucurbit[7]uril and the dye DAPI. (b) Schematic illustration of a DNA chemosensing ensemble featuring FRET. Reproduced with permission from ref (731). Copyright 2019 The Royal Society of Chemistry.
Figure 178
Figure 178
Schematic representation of dual fluorescent silica nanoparticles (N6.1) used for fluorescence-based detection of ATP at μM concentrations in aqueous buffers.
Figure 179
Figure 179
(a) Schematic representation of the sensing mechanism for nucleotides by nanosensor N6.2 in HEPES buffer at micromolar concentrations. (b) Chemical structures of Zn2Trp and Tb-1 used in the sensing system. Adapted with permission from ref (735). Copyright 2013 The Royal Society of Chemistry.
Figure 180
Figure 180
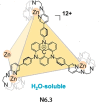
Chemical structure of the triazatriangulenium (TATA+)-ZnII cage (N6.3) used for fluorescence-based detection of nucleoside phosphates at μM concentrations in deuterated water. Adapted with permission from ref (736). Copyright 2019 Wiley-VCH.
Figure 181
Figure 181
Chemical structures of carboxylates.
Figure 182
Figure 182
Schematic representation of the boronic-acid-based IDA-type probe P7.1 for the detection of α-hydroxy acids in organic aqueous media at mM concentrations. Adapted with permission from ref (782). Copyright 2004 American Chemical Society.
Figure 183
Figure 183
Chemical structure of a boronic acid-based fluorescent probe (P7.2; (R)-enantiomer shown) for the enantioselective detection of tartaric acid and sugar acids in aqueous organic media at μM concentrations.
Figure 184
Figure 184
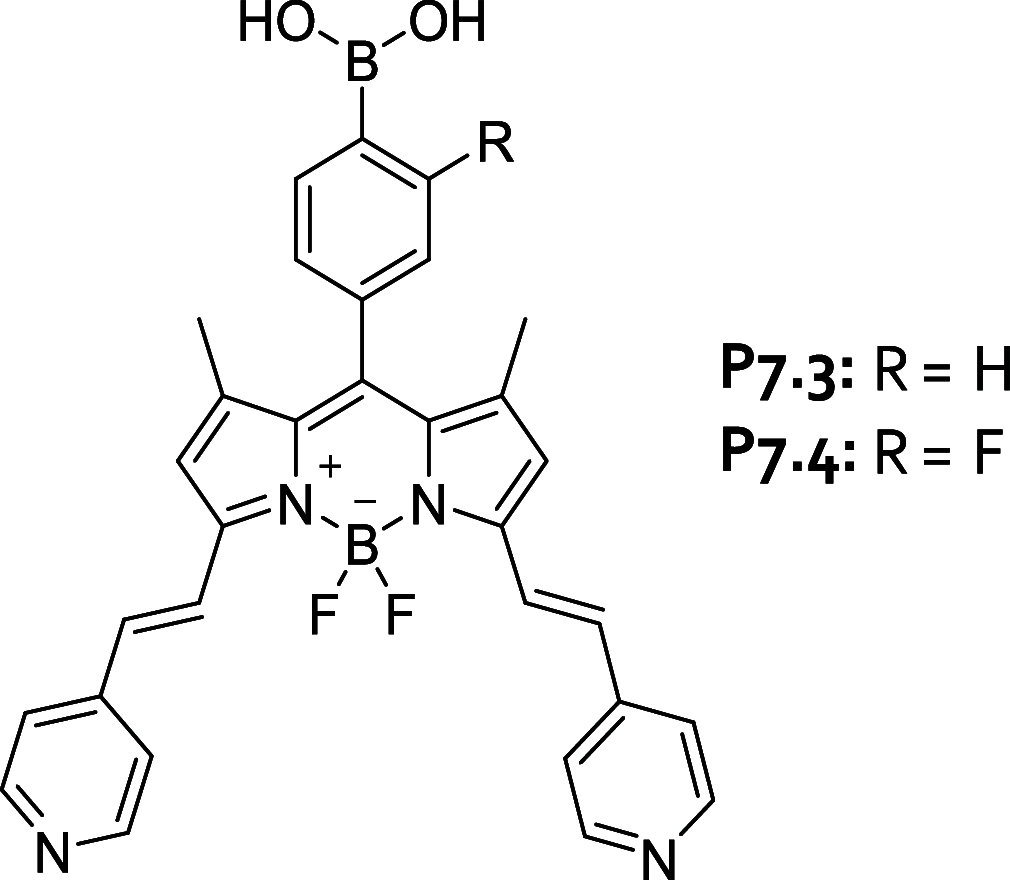
Chemical structure of the BODIPY-based boronic acid probes P7.3 and P7.4 for the detection of lactate in 25 mM phosphate buffer containing 52% MeOH, pH 7.4.
Figure 185
Figure 185
Emission turn-on sensing of ascorbic acid with the Nile blue nitroxide conjugate (P7.5) in 100 mM PBS containing 1% DMSO, pH 7.4.
Figure 186
Figure 186
(a) Chemical structure of nitroxide-based fluorescent probe P7.6 that is appliable for the detection of ascorbic acid in fruit juices (LOD, 14 μM). (b) Chemical structure of naphthalene imide-nitroxide probe P7.7 that can be used for the detection of ascorbic acid at nM to μM concentrations in 50 mM PBS, pH 7.0.
Figure 187
Figure 187
Fluorescent pinwheel-shaped chemosensor C7.1 allows for the cooperative recognition and selective sensing of dicarboxylates in Tris- or sodium acetate buffer at μM concentrations. Adapted with permission from ref (795). Copyright 2002 American Chemical Society.
Figure 188
Figure 188
Aza-crown ether substituted binaphthol (C7.2) used for enantioselective and fluorescence-based detection of (S,S)-tartaric acid in 5 mM Tris buffer, pH 7.0.
Figure 189
Figure 189
(a) Protonatable molecular tubes forming buried salt-bridges are general binders for carboxylates in aqueous buffers, providing emission quenching and induced circular dichroism signals (for chiral analytes) as optical readout. (b) Chemical structures of amine naphthotubes (C7.3a and C7.3b). Reproduced with permission from ref (799). Copyright 2020 Wiley-VCH.
Figure 190
Figure 190
(a) Chemical structures of dye-substituted calix[4]pyrroles C7.4C7.11 which function as fluorescent chemosensors for aliphatic and aromatic carboxylates in pure aqueous media. (b) Analyte-indicative modulation of emission spectra occurs via intramolecular partial charge transfer (IPCT) and allows for fluorescence-based discrimination of different carboxylates from each other. (c) Fluorescence responses of the chemosensor array to the presence of carboxylates D1– D14 (1 mM in water at pH 8.5, 200 nL). Adapted with permission from ref (800). Copyright 2013 American Chemical Society.
Figure 191
Figure 191
(a) Fluorescence sensor array (“chemical tongue”) reported by the Bunz group. (b) Chemical structure for one type of positively charged poly(p-arylene ethynylene)s used in this assay. Adapted with permission from ref (801). Copyright 2016 American Chemical Society.
Figure 192
Figure 192
Formation of a luminescent ternary complex upon the reaction of the TbIII-complex C12.7 with an aromatic carboxylate that serves as an antenna ligand.
Figure 193
Figure 193
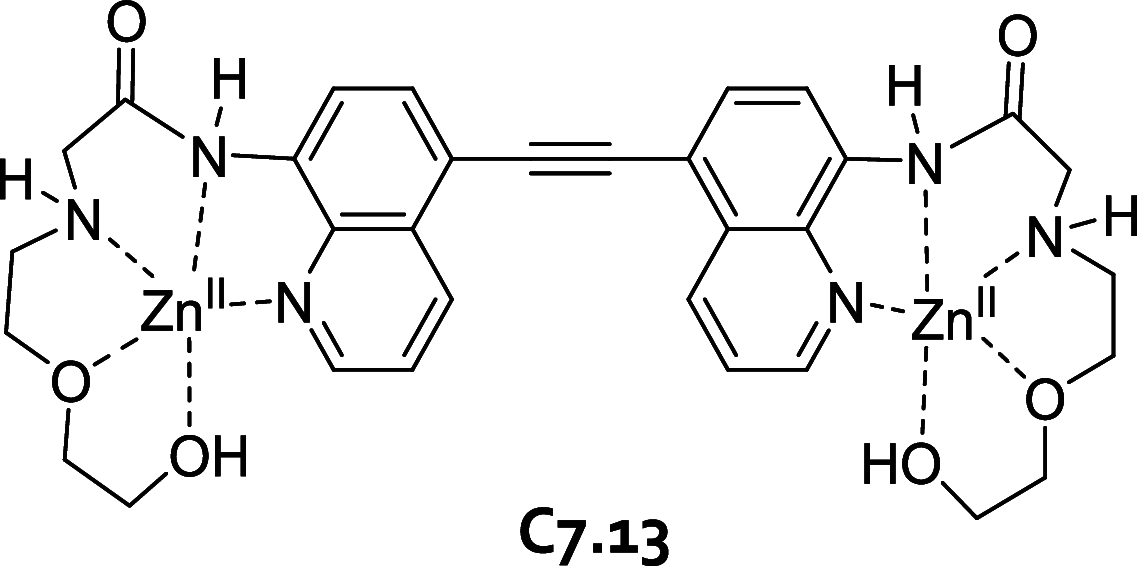
Chemical structure of the alkyne-conjugated carboxamidoquinoline chemosensor (C7.13) used for the detection of oxalate in Tris buffer at μM concentrations.
Figure 194
Figure 194
(a) A metal-complex based indicator displacement assay (C7.14) for the array-based sensing of 11 biologically relevant carboxylates, which are shown in (b), in borate buffer and in human urine. Indicator dyes are shown in (c). Adapted with permission from ref (805). Copyright 2017 Elsevier BV.
Figure 195
Figure 195
Schematic representation of o-(trifluoroacetyl)carboxanilide functionalized gold nanoparticles (N7.1) for colorimetric millimolar detection of trans-fumarate in water. trans-Fumarate reacts with o-(trifluoroacetyl)carboxanilide to form covalent adducts that assist to particle crosslinking and aggregation.
Figure 196
Figure 196
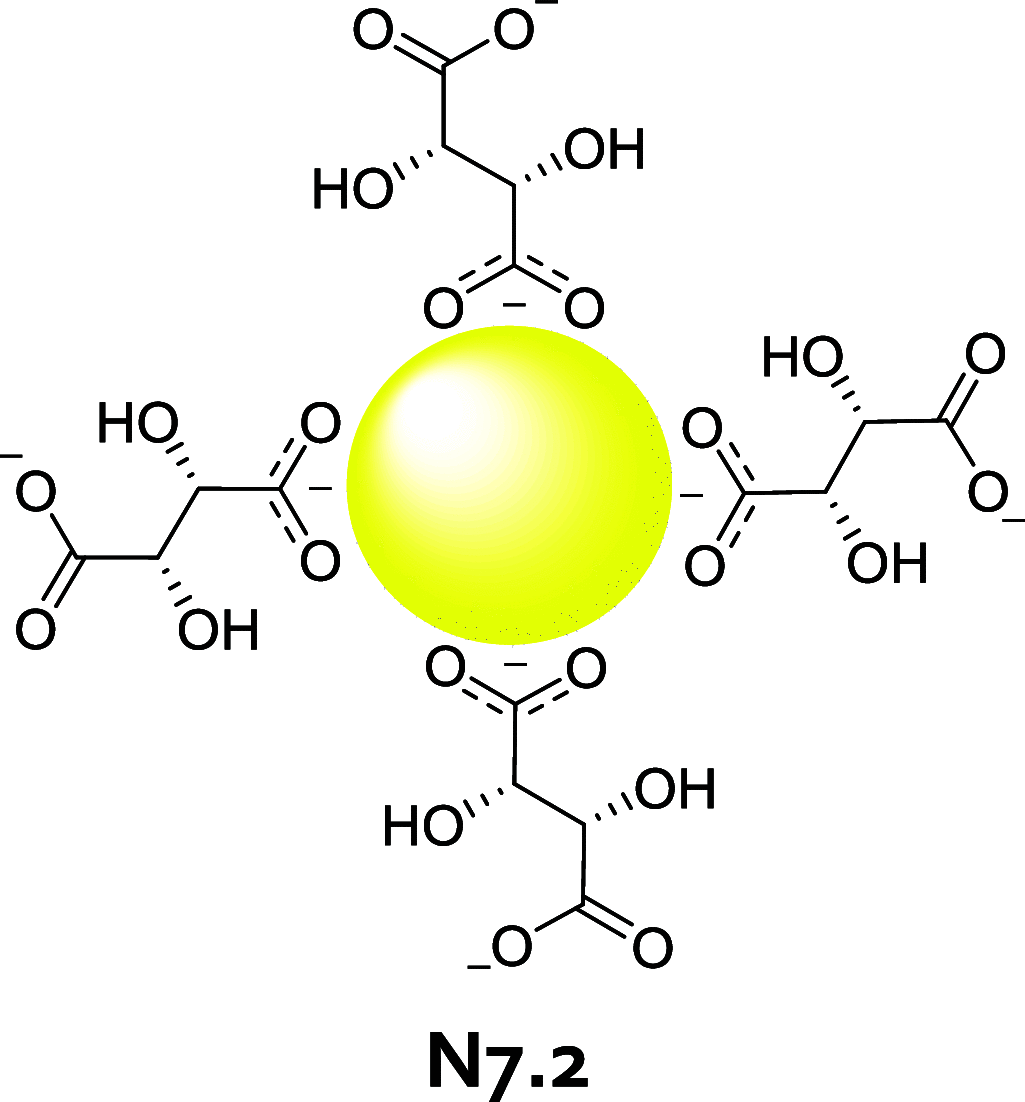
Schematic representation of l-tartaric acid functionalized gold nanoparticles N7.2 used for colorimetric and enantioselective micromolar detection of d-mandelic acid in Britton–Robinson buffer.
Figure 197
Figure 197
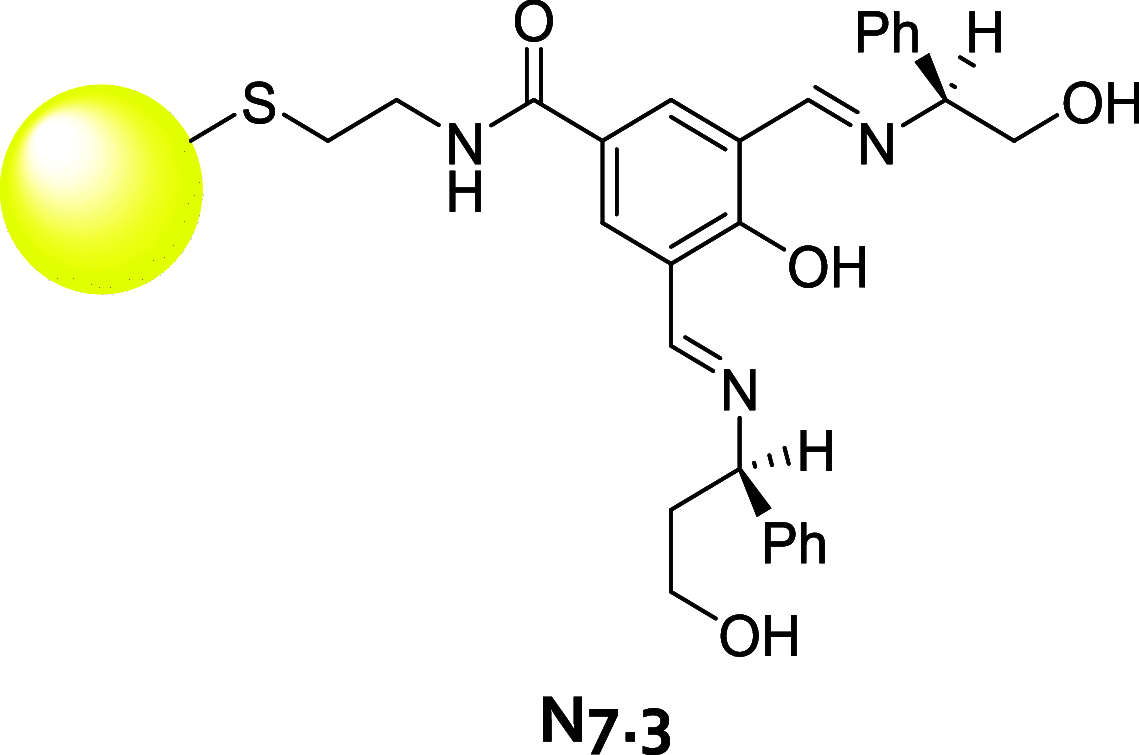
Schematic representation of nanosensor N7.3 that consist of gold nanoparticles functionalized with chiral diimine complexes. N7.3 can be used for the enantioselective detection of chiral carboxylic acids at μM and mM concentrations in water containing 20% MeOH and 100 μM ZnCl2, pH 9.0.
Figure 198
Figure 198
Schematic representation of spirobenzopyran and thiourea functionalized silica nanoparticles (N7.4) that can be used for the millimolar detection of aliphatic carboxylic acids in HEPES buffer.
Figure 199
Figure 199
Schematic representation of squaramide functionalized iron oxide nanoparticles N7.5 used for IDA-based detection of mono- and dicarboxylates in the mM concentration range in Tris-HCl buffer.
Figure 200
Figure 200
Schematic representation of persistent luminescence nanoparticles (PLNPs) that can be used in combination with fluorescence quenching oxyhydroxide nanoflakes N7.6 for μM detection of ascorbic acid in various buffer solutions, cells, and in mice.
Figure 201
Figure 201
Schematic representation of FeIII-doped carbon nanocages (N7.7) for fluorescence-based detection of ascorbic acid in Britton–Robinson buffer at μM concentrations.
Figure 202
Figure 202
Schematic representation of the use of green emissive carbon dots (N7.8) for fluorescence turn-on detection of ascorbic acid in PBS, urine samples, and in cells at μM concentrations.
Figure 203
Figure 203
Chemical structures of representative lipids and steroids.
Figure 204
Figure 204
Schematic representation of the binding between the lipid lysophosphatidic acid (LPA) and a guanidinium-modified calix[5]arene (C8.1). Fluorescence turn-on sensing of LPA by C8.1 is achieved with an IDA format using fluorescein as a reporter dye. Reproduced with permission from ref (882). Copyright 2018 The Royal Society of Chemistry.
Figure 205
Figure 205
Chemical structure of a molecular tube (C8.2) and its binding geometry with a fatty acid. Reproduced with permission from the ref (883). Copyright 2004 American Chemical Society.
Figure 206
Figure 206
Design and use of a polarity-sensitive probe P8.1 for lipid droplet imaging to differentiate normal from cancer cells. Reproduced with permission from the ref (894). Copyright 2018 The Royal Society of Chemistry.
Figure 207
Figure 207
Chemical structures of probes P8.2P8.16 used for lipid droplet-based sensing.
Figure 208
Figure 208
Schematic representation of the sensing mechanism for dehydrocholesterol via FRET using β-CD-RuII host–guest complex functionalized AuNPs (N8.1) in 10 mM Tris-HCl buffer containing 5% MeOH, pH 8.0, at mM concentrations.
Figure 209
Figure 209
Schematic representation of the fluorescence-based detection mechanism for cholesterol using carboxyfluorescein (6-FAM)-loaded unilamellar vesicles in combination with polyarginine as the counterion transport system (N8.2). Reproduced with permission from ref (916). Copyright 2009 Wiley-VCH.
Figure 210
Figure 210
(a) Steroid-polymer-coated SWCNTs (N8.3) for fluorescence turn-on detection of human steroids, e.g., cortisol and progesterone. Reproduced with permission from ref (921). Copyright 2020 Wiley-VCH. (b) Chemical structure of the steroid polymer.
Figure 211
Figure 211
Chemical structures of selected drugs described in this section.
Figure 212
Figure 212
(a) Sensing mechanism of chemosensors C9.1C9.2 for cannabinols. (b) Chemical structures of cannabinols. (c) Chemical structures of components used in the chemosensor array. Adapted with permission from ref (946). Copyright 2020 The Royal Society of Chemistry.
Figure 213
Figure 213
Schematic representation of the DimerDyes (DDs)-based chemosensor array (C9.3) used for the detection of cationic drugs in biological media. Reproduced with permission from ref (276). Copyright 2019 America Chemistry Society.
Figure 214
Figure 214
Chemical structure and 3D rendering of the (a) cyclic cucurbit[n]uril chemosensors (C9.4) and (b) acyclic cucurbit[n]uril chemosensors (C9.5) used for the micromolar detection of addictive over-the-counter (OTC) drugs (e.g., histamine, acetaminophen, and pseudoephedrine) in water. Adapted with permission from ref (235). Copyright 2013 American Chemical Society.
Figure 215
Figure 215
Chemical structure of the unimolecular chemosensor C9.6 that can be used for the micromolar detection of the drug amantadine in urine and saliva.
Figure 216
Figure 216
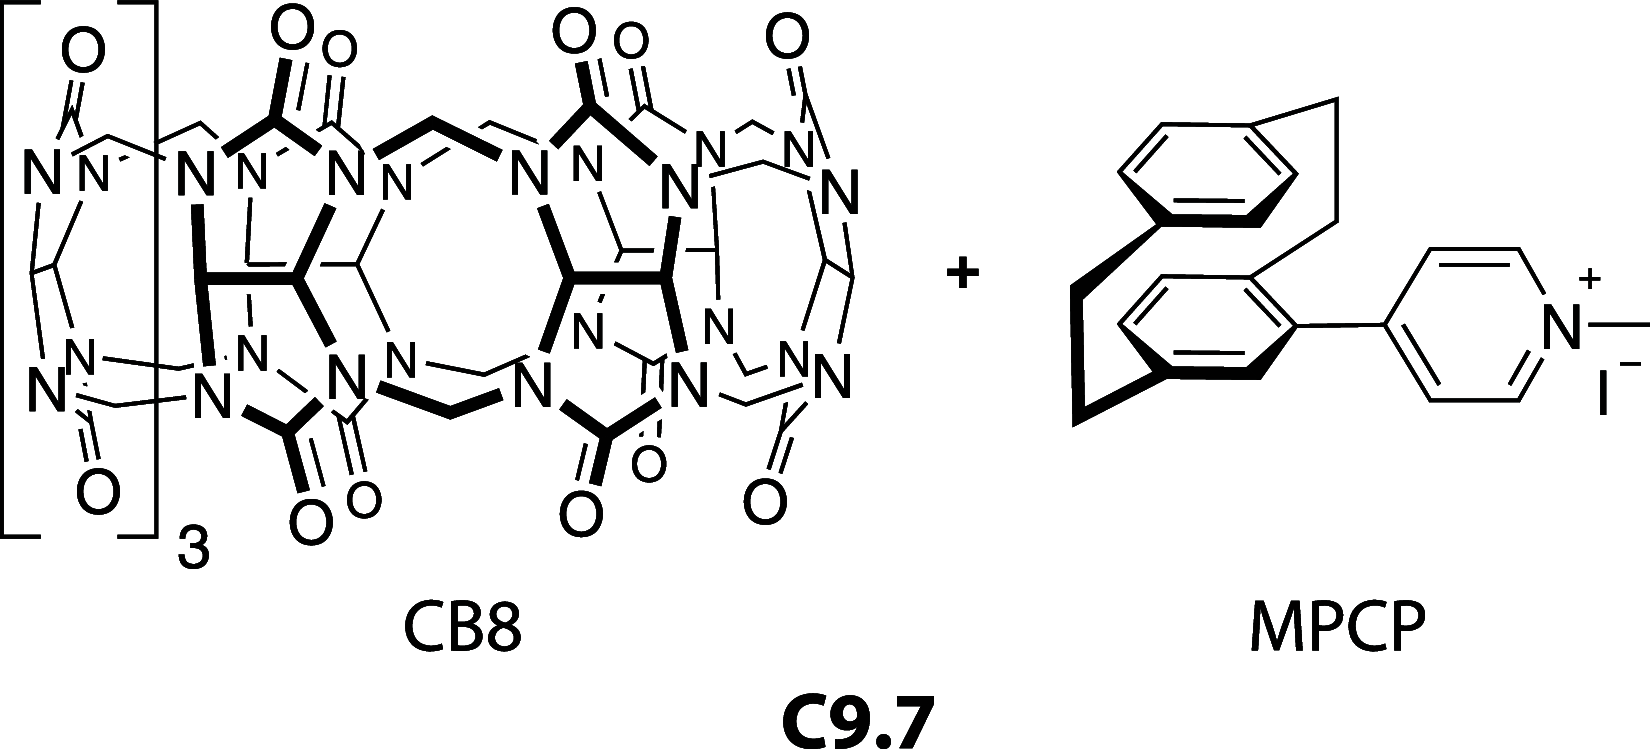
Chemical structure for chemosensor C9.7 that we employed for memantine sensing in the physiologically relevant micromolar concentration range in blood serum.
Figure 217
Figure 217
(a) Operational principle of self-assembling probes (SAPs) and their capability to provide analyte-indicative spectroscopic fingerprints. (b) Chemical structure of the PtII-complex used as fluorescence turn-on chemosensor (C9.8). (c) Representative example of a luminescent platinum complex-based SAP (C9.8) for the detection and differentiation of aza-heterocyclic drugs and toxins in 0.5% P123 as surfactant in 1× PBS. Adapted with permission from ref (184). Copyright 2017 Wiley-VCH. (d) Chemical structures of aza-heterocyclic drugs and toxins.
Figure 218
Figure 218
Schematic representation of melamine functionalized AuNPs (N9.1) used for the colorimetric detection of morphine and codeine in 10 mM phosphate buffer, pH 7.0, serum, and urine samples at μM concentrations.
Figure 219
Figure 219
(a) 3D structural representation of the monomeric unit in CrIII–MOF (N9.2). Reproduced with permission from ref (951). Copyright 2020 American Chemical Society. (b) Chemical structure of CrIII-based MOF-NPs (N9.2) used for fluorescence-based detection of morphine at nM concentrations in water, urine, and serum samples.
Figure 220
Figure 220
(a) Schematic representation of fluorescein-loaded and pseudorotaxane-capped mesoporous silica particles (MSPs, N9.3) that can be used for μM detection of MDMA in water. Adapted with permission from ref (952). Copyright 2017 The Royal Society of Chemistry. (b) Sulfonic acid functionalized AuNPs (N9.4) for NMR-based detection of phenethylamine related drugs at μM concentrations in deuterated water/HEPES buffer. (c) Chemical structures of phenethylamine related drugs.
Figure 221
Figure 221
Schematic representation of β-CD functionalized AuNPs (N9.5) used for colorimetric detection of the nonsteroidal anti-inflammatory drugs nabumetone in urine and wastewater samples at μM concentrations.
Figure 222
Figure 222
Subcutaneous implanted ssDNA functionalized SWCNTs (N9.6) allow for μM detection of doxorubicin. Reproduced with permission from ref (955). Copyright 2019 American Chemical Society.
Figure 223
Figure 223
A molecularly imprinted polymer (N9.7) offers binding pockets for irinotecan and thereby can be employed for its fluorescence-based nanomolar detection in aqueous-organic mixtures and in deproteinized plasma.
Figure 224
Figure 224
Chemical structures of selected xenobiotics.
Figure 225
Figure 225
(a) Chemical structures of CB6 and the indicator dye, which form the chemosensor ensemble for the detection of hydrocarbon gases (C10.1). (b) Schematic representation of the fluorescence-based detection on n-butane and isobutane in water. The traces refer to the sequential analyte uptake and release. Reproduced with permission from ref (971). Copyright 2011 Wiley-VCH.
Figure 226
Figure 226
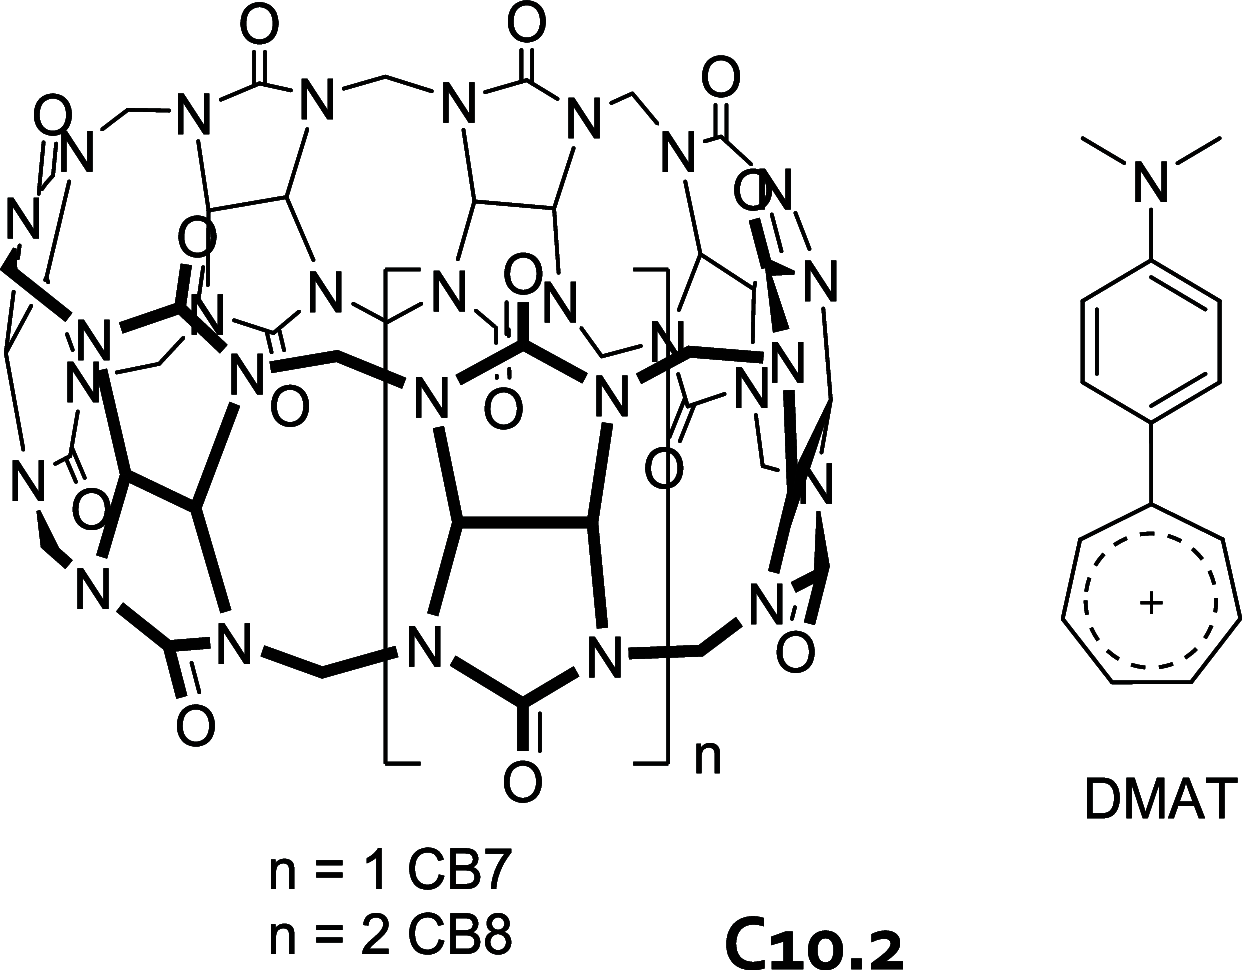
Chemical structures of the macrocyclic hosts CB7 and CB8 and the dye N,N-dimethylaminophenyltropylium perchlorate (DMAT).
Figure 227
Figure 227
Schematic representation of the homoternary complex C10.3, which binds cyclic hydrocarbons in water allowing for NMR-based detection of such analytes in D2O. Reproduced with permission from ref (973). Copyright 2017 American Chemical Society.
Figure 228
Figure 228
(a) Crystal structure of the CB10–acridine chemosensor ensemble for IDA-based detection of dodine at μM concentration in water, pH 4.0. Reproduced with permission from ref (974). Copyright 2002 American Chemical Society. (b) Chemical structure of dodine acetate.
Figure 229
Figure 229
Schematic representation of the fluorescence-based detection mechanism for odorants using dye-loaded unilamellar vesicles (N10.1) and the polyion-counterion transport system. Adapted with permission from ref (975). Copyright 2011 The Royal Society of Chemistry.
Figure 230
Figure 230
Schematic representation of the Cd2+ binding probe 2,9-di-(pyrid-2-yl)-1,10-phenanthroline (P11.1) for nanomolar Cd2+ detection in aqueous solutions of 100 mM NaClO4.
Figure 231
Figure 231
Chemical structures of a terpyridine-substituted and tetraphenylethylene-based probe (P11.2) for Zn2+ detection. The 1,10-phenanthroline-based probe (P11.3) and the coumarin-based probe (P11.4) can be used for the detection of Fe3+ in aqueous solutions.
Figure 232
Figure 232
Chemical structures of the probes P11.5P11.7 used for the detection of Hg2+.
Figure 233
Figure 233
Chemical structures of the chemosensors C11.1C11.4.
Figure 234
Figure 234
Chemical structures of the chemosensors C11.5C11.7.
Figure 235
Figure 235
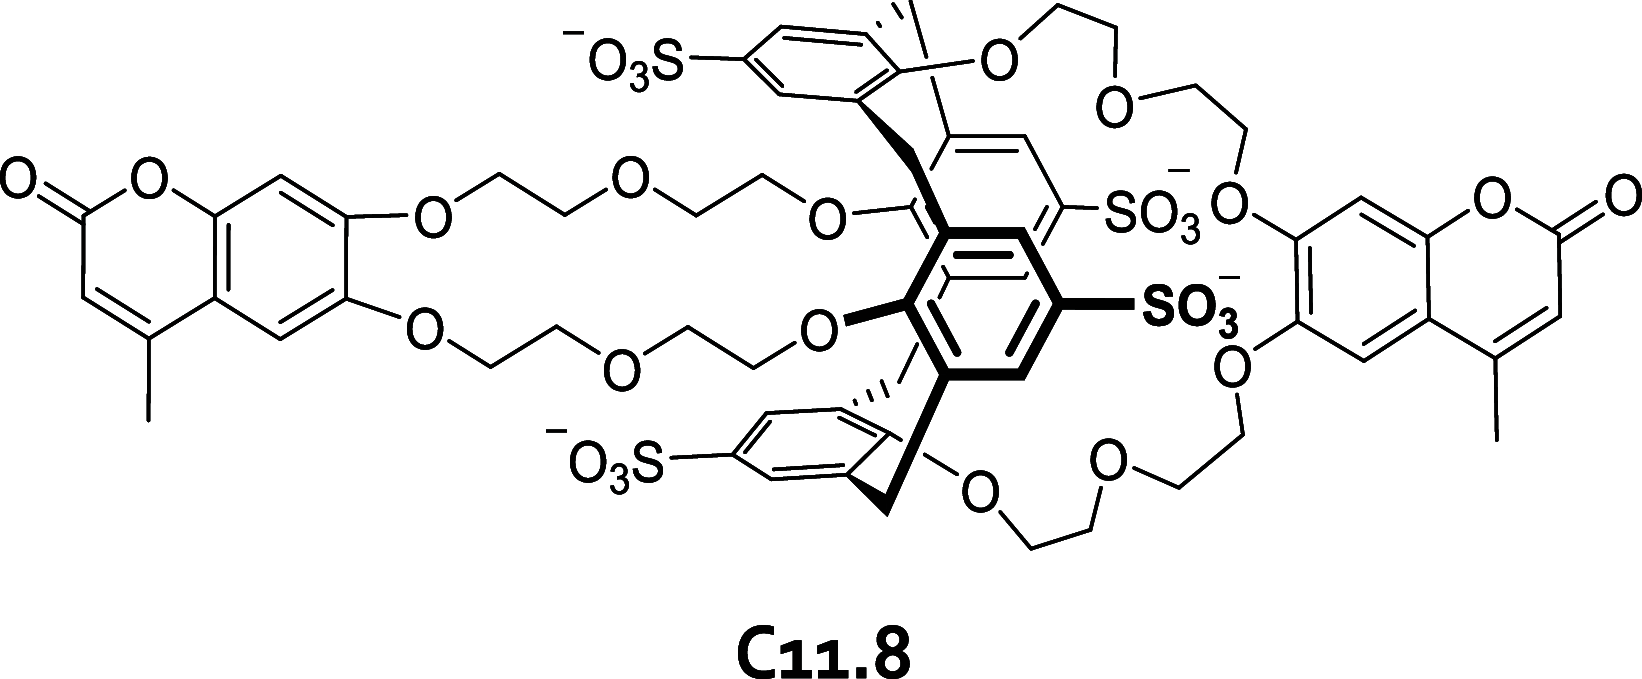
Chemical structure of the chemosensor C11.8 used for fluorescence-based detection of Cs+ at μM concentrations in 50 mM MES buffer, pH 7.0.
Figure 236
Figure 236
(a) Chemical structures of the chemosensors C11.9C11.10 used for μM detection of Mg2+ in DPBS buffer, pH 7.0. (b) Chemical structure of the chemosensor C11.11 used for Ba2+ detection at μM concentrations in 10 mM Tris buffer, pH 10.2. (c) Chemical structure of the fura-2 chemosensor C11.12 used for Ca2+ detection at μM concentrations in biofluids and in cells.
Figure 237
Figure 237
(a) Chemical structure of the chemosensor C11.13 used for luminescence-based intra- and extracellular sensing of Zn2+. (b) Chemical structure of the chemosensor C11.14 used for luminescence-based Zn2+ detection in PIPES buffer at mM concentrations.
Figure 238
Figure 238
Mechanism for Zn2+ detection by chemosensor C11.15 in 5% DMSO in 500 mM HEPES buffer, pH 7.4. Adapted with permission from ref (1046). Copyright 2012 The Royal Society of Chemistry.
Figure 239
Figure 239
Chemical structure of chemosensor C11.16 for aggregation-induced emission (AIE)-based detection of Al3+ at μM concentrations in water/acetonitrile mixtures and within cells.
Figure 240
Figure 240
(a) Chemical structures of chemosensors C11.17C11.25. (b) Fluorescence response of the chemosensor array in the presence of 1 mM of different cations in water, pH 7.0. Adapted with permission from ref (1048). Copyright 2008 American Chemical Society.
Figure 241
Figure 241
Plots of log Kavs cation radius for different cucurbit[n]urils that function as metal cation binders in aqueous solutions. Reproduced with permission from ref (40). Copyright 2019 The Royal Society of Chemistry.
Figure 242
Figure 242
Schematic representation of the chemosensor ensemble C11.26, composed of CB7 and the cation-binding dye molecule N-(2-benzimidazolylmethyl)-N,N-bis(2-pyridylmethyl)-amine (BIBPA), allows for μM detection of Zn2+ and Cd2+ in 10 mM phosphate buffer, pH 6.5. Adapted with permission from ref (1053). Copyright 2020 Taylor & Francis.
Figure 243
Figure 243
(a) Chemical structure of the chemosensor C11.27 formed from carboxylate-functionalized pillar[5]arenes and PDI. (b) Schematic representation of the detection mechanism for Fe3+ with C11.27. Reproduced with permission from ref (1056). Copyright 2017 American Chemical Society.
Figure 244
Figure 244
(a,b) Schematic representation of the fluorescence-based sensing mechanism of Ag+ and Hg2+ by the chemosensors C11.28 and C11.29. Both chemosensors allow for μM detection of Ag+ and Hg2+ in acetonitrile/water mixtures. Reproduced with permission from ref (1060). Copyright 2008 American Chemical Society.
Figure 245
Figure 245
(a) Schematic representation of the detection mechanism for CN with probe P12.1. The probe allows for the μM detection of CN in 30% MeOH in 100 mM CHES buffer, pH 9.6. (b) Chemical structure of P12.2 used for μM to mM detection of CN in 50% MeOH in 10 mM Na2CO3–NaHCO3 buffer, pH 9.4.
Figure 246
Figure 246
(a) Schematic representation of the detection of CN by probes P12.3. The probe allows for the μM detection of CN in 20% DMSO in water. (b) Schematic representation of the nucleophilic attack of CN on P12.4 resulting in a quenched fluorescence of the probe. (c,d) Chemical structures of probes P12.5 and P12.6 for fluorescence-based detection of CN at μM concentration in water containing 1% DMSO and 2 mM CTAB.
Figure 247
Figure 247
(a) Schematic representation of the fluorescence turn-on detection of CN at low μM concentration by P12.7 in 30% THF in water. (b) Schematic representation of the fluorescence turn-on detection of CN at low μM concentration by P12.8 in 30% DMSO in HEPES buffer, pH 7.4.
Figure 248
Figure 248
(a) Schematic representation of the detection of CN at μM concentrations by P12.9 in HEPES buffer containing 0.4% MeCN, pH 7.0. (b) Chemical structure of probe P12.10, which allows for fluorescence-based detection of CN at μM concentrations in 20 mM HEPES buffer containing 0.5% MeCN. (c) Schematic representation of the detection for CN at μM concentrations in 20 mM HEPES buffer, pH 7.2, by P12.11. (d) Chemical structure of probe P12.12 used for μM detection of CN in 1% DMSO in HEPES buffer.
Figure 249
Figure 249
Schematic representation of the detection of S2– by P12.13.
Figure 250
Figure 250
(a) Schematic representation of the sensing of I by probe P12.14. I disrupts the complexation of P12.14 with Hg2+ cations resulting in quenched fluorescence which allows for μM iodide detection in 10% EtOH in water. Reproduced with permission from ref (1118). Copyright 2014 Elsevier BV. (b) Schematic representation of the detection of I at μM concentrations in water containing 1% DMSO and 2 mM CTAB by P12.15. Reproduced with permission from ref (1119). Copyright 2011 American Chemical Society.
Figure 251
Figure 251
Schematic representation of the micromolar detection of S2– by probe P12.16 in 10 mM Bis-Tris buffer, pH 7.0.
Figure 252
Figure 252
Schematic representation of the detection of HS by (a) probe P12.17 and (b) probe P12.18.
Figure 253
Figure 253
Schematic representation of the reaction between HS and the probe P12.19 used for hydrogen sulfide detection at μM concentration in 10 mM PBS containing 30% MeCN.
Figure 254
Figure 254
(a) Schematic representation of the phenol deprotection reaction promoted by F leading to a colorimetric response of P12.20. (b) Schematic representation of the alcohol deprotection reaction promoted by F, allowing for mM detection of F by P12.21 in HEPES buffer.
Figure 255
Figure 255
Schematic representation of the phenol deprotection reaction promoted by F resulting in the colorimetric reaction of P12.22 in the presence of F at mM concentrations in 20 mM PBS, pH 7.4, containing 30% EtOH.
Figure 256
Figure 256
Schematic representation of fluoride-induced deprotection of P12.23 used to detect F in 10 mM HEPES buffer containing 20% MeCN, pH 7.4, at mM concentrations.
Figure 257
Figure 257
Chemical structures of the fluoride-reactive probes P12.24P12.26.
Figure 258
Figure 258
Chemical structure of the halogen binding [RuII(bpy)3]-based rotaxane chemosensor C12.1. The chemosensor C12.1 allows for luminescence-based detection of I at mM concentrations in water (D2O). Reproduced with permission from ref (1154). Copyright 2016 Wiley-VCH.
Figure 259
Figure 259
Schematic representation of the proposed sensing mechanism for CN with chemosensor C12.2. Fluorescence-based CN detection was achieved at μM concentrations in water.
Figure 260
Figure 260
Chemical structure of the chemosensor C12.3 used for fluorescence-based detection of CN at mM concentrations in 20 mM HEPES buffer, pH 7.0.
Figure 261
Figure 261
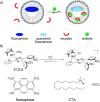
(a) Chloride sensing (mM range) in 50 mM MOPS buffer, pH 7.0, with a Rh-based anion-binding metal complex that partitions into a CTA micelle, where it then quenches the emission of the fluorescent dye 8-hydroxypyrene-1,3,6-trisulfonate (HPTS). (b) Chemical structure of the Rh-complex (C12.4), the fluorophore (HPTS) and the surfactant CTA. Adapted with permission from ref (1163). Copyright 2010 Wiley-VCH.
Figure 262
Figure 262
Schematic representation for the detection of CN with bisindole functionalized mesoporous silica particles (N12.1). Colorimetric detection allows for CN quantification at μM concentrations in water/MeCN mixtures (7:1 v/v).
Figure 263
Figure 263
Pt2Ag-complex-loaded hybrid silica particles (N12.2) designed for fluorescence-based detection of cyanides at μM concentrations in carbonate buffer, pH 11.0. Adapted with permission from ref (1165). Copyright 2014 The Royal Society of Chemistry.
Figure 264
Figure 264
(a) Schematic representation for the detection mechanism of CN using fluorescent reporter-loaded and nanovalve-capped mesoporous silica particles (N12.3). CN anions were detected at millimolar concentrations in PBS, pH 7.4. (b) Chemical structure of the pseudorotaxane-based nanovalve and the fluorescent reporter dye fluorescein.
Figure 265
Figure 265
(a) Chemical structure of the [Pd6L4]12+ (L = 1,3,5-triimidazoylbenzene) nanocage BODIPY ensemble (N12.4) used for fluorescence-based CN detection at μM concentrations in water. (b) 3D-structure of N12.4. (c) Schematic representation of the sensing mechanism using N12.4. In the presence of CN the nanocage disassembles to release BODIPY, which is detected spectroscopically. Adapted with permission from ref (1169). Copyright 2020 American Chemical Society.
Figure 266
Figure 266
Polysorbate-stabilized and fluorescein decorated gold nanoparticles (N12.5) used for dual, colorimetric, and fluorescence-based detection of cyanides at μM concentrations in 40 mM phosphate buffer, pH 7.4. Reproduced with permission from ref (1170). Copyright 2016 Elsevier BV.
Figure 267
Figure 267
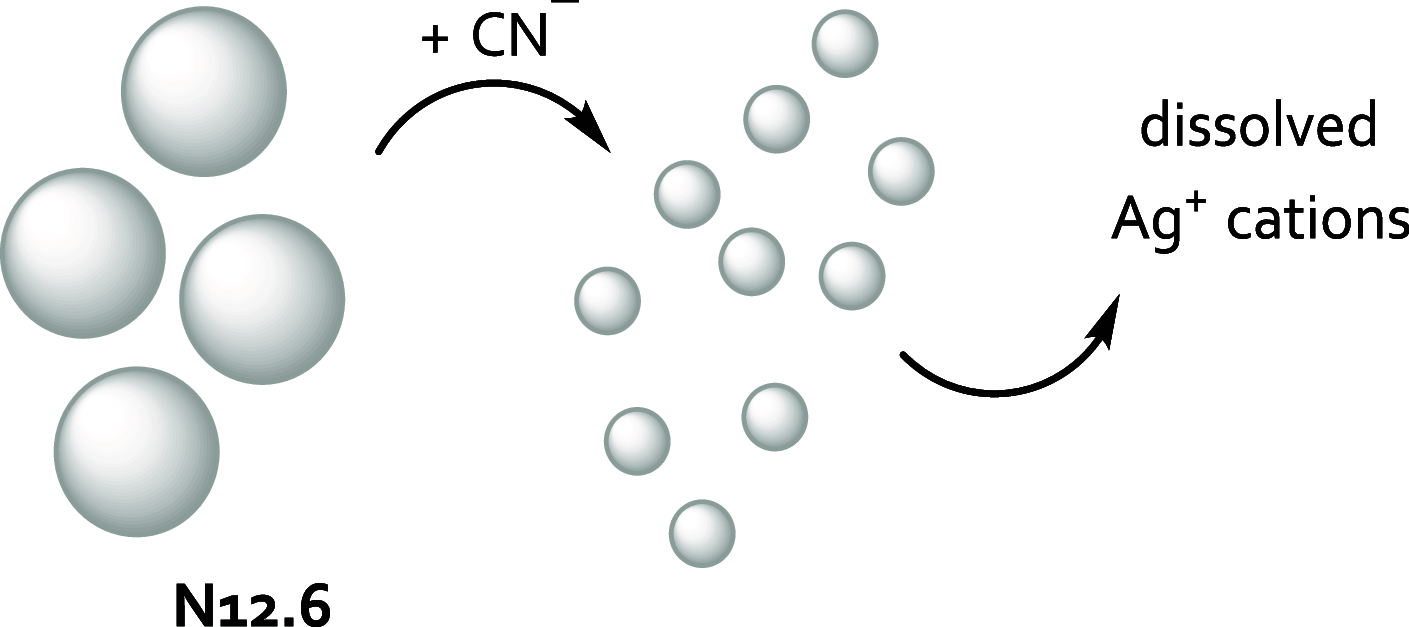
Sodium dodecyl sulfate (SDS) stabilized silver nanoparticles (N12.6) used for colorimetric μM detection of cyanide anions in water and wastewater samples.
Figure 268
Figure 268
Cysteamine decorated gold nanoparticles (N12.7) used for colorimetric-based detection of sulfate anions at μM concentrations in acetate buffer.
Figure 269
Figure 269
(a) Cyclopeptide functionalized gold nanoparticles (N12.8) for colorimetric detection of sulfate anions at mM concentrations in water. (b) The cyclopeptide binds with the sulfate anion in a 2:1 ratio. Adapted with permission from ref (1174). Copyright 2020 The Royal Society of Chemistry.
Figure 270
Figure 270
Schematic representation of the sensing mechanism for the detection of H2S/HS in phosphate buffer using gold nanoparticles that have been surface-functionalized with hydrogen sulfide and amine reactive crosslinkers (N12.9). Note that, for better visualization, only the reactive and truncated chemical structures are shown.
Figure 271
Figure 271
(a) Pyronine functionalized mesoporous silica particles (N12.10) used for fluorescence-based detection of H2S/HS at μM concentration in water, blood, and urine samples. (b) Schematic representation of the Michael-type addition reaction occurring between pyronine and of H2S/HS. Adapted with permission from ref (1176). Copyright 2019 Elsevier BV.
Figure 272
Figure 272
Chemical structure of the metallosupramolecular coordination polymer (N12.11) for fluorescence turn-on detection of hydrogen sulfide HS at μM concentrations in PBS, pH 7.4.
Figure 273
Figure 273
o-Safranin functionalized cuboid mesoporous silica particles (N12.12) used for fluorescence-based detection of permanganate anions at μM concentrations in water and in vivo.
Figure 274
Figure 274
Calix[4]arene functionalized AuNPs (N12.13) can be used for the colorimetric detection of iodides at μM concentrations in 10 mM HEPES buffer, pH 7.4.
Figure 275
Figure 275
Schematic representation of the detection mechanism of I with N12.14. The nanosensor N12.4 allows for the detection of I at μM concentrations in 200 mM phosphate buffer.
Figure 276
Figure 276
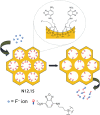
Nitrobenzoxadiazole functionalized mesoporous silica particles (N12.15) used for fluorometric detection of F at μM concentrations in 70% MeCN in water containing 100 mM potassium hydrogen phthalate and HCl, pH 2.5. Adapted with permission from ref (1183). Copyright 2015 The Royal Society of Chemistry.
Figure 277
Figure 277
Fluorescent silica nanoparticles (N12.16) used for ratiometric fluorescence-based detection of chloride anions in cells. Reproduced with permission from ref (1184). Copyright 2020 American Chemical Society.
Figure 278
Figure 278
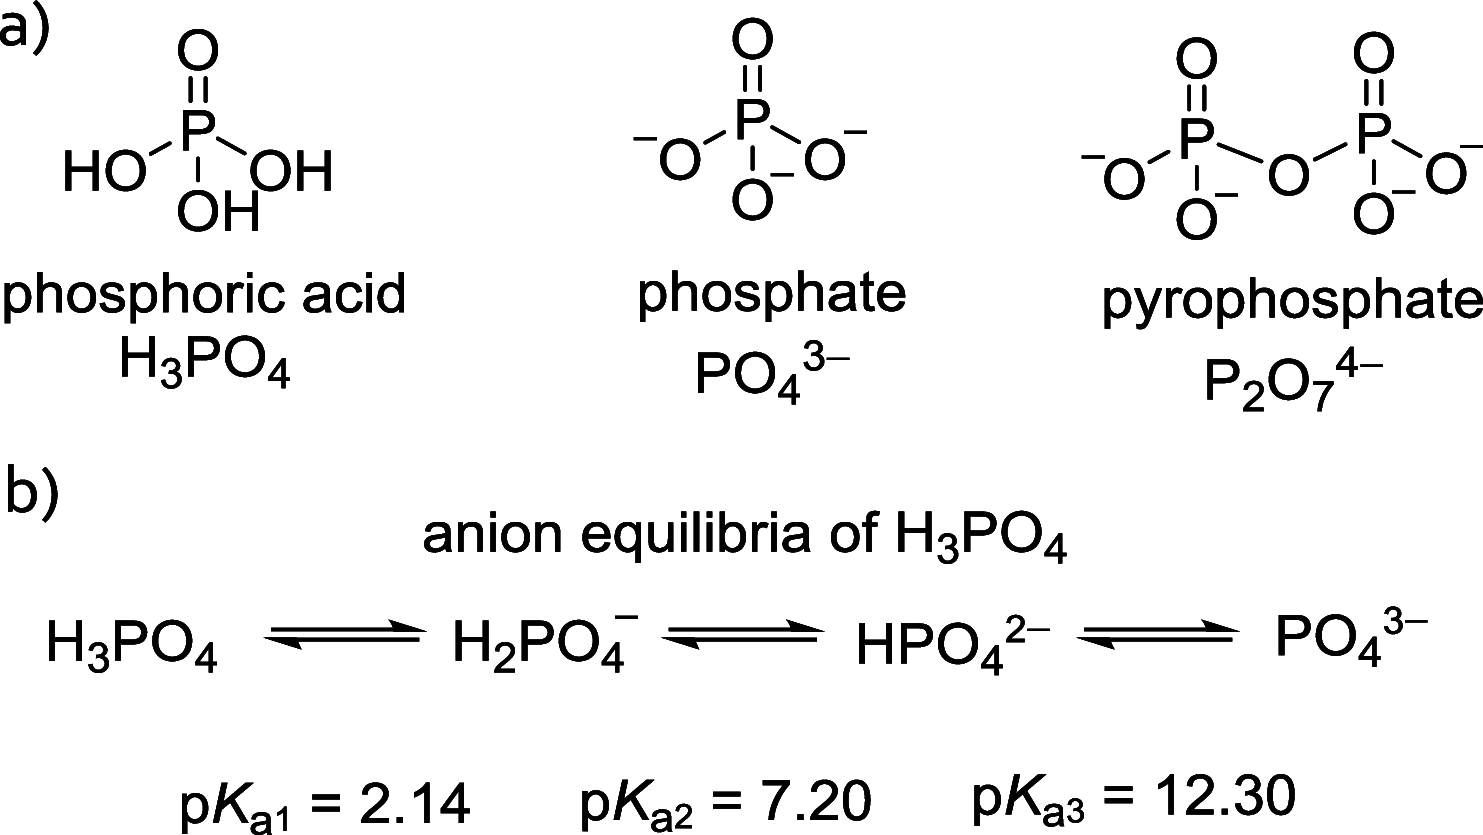
(a) Chemical structures and formula of different phosphate species. (b) Dissociation equilibria of phosphoric acid in water.
Figure 279
Figure 279
(a) Schematic representation of the molybdate blue reaction for phosphate detection at μM concentrations in aqueous media and biological fluids. (b) 3D rendering of the Keggin ion [PW12O40]3–. Reproduced with permission from ref (1214). Copyright 2015 Elsevier BV.
Figure 280
Figure 280
(a) Chemical structure of 1,3,5-trinitro-2,4-dimethylbenzene (C13.1) for fluorescence-based detection of PO43– at mM concentrations in urine. (b) Chemical structure of perylene diimide and CuII ensemble (C13.2) used for the detection of pyrophosphate at mM concentrations in 10 mM HEPES buffer, pH 7.4.
Figure 281
Figure 281
Schematic representation of the fluorescence-based detection of pyrophosphate (μM concentrations) in HEPES buffer containing 20% DMSO using a Cu(II) complex (C13.3). Reproduced with permission from ref (1219). Copyright 2020 American Chemical Society.
Figure 282
Figure 282
Schematic representation of the sensing mechanism for H2PO4 with C13.4. The chemosensor C13.4 enables colorimetric-based detection of phosphate species at μM concentrations in Tris-HCl buffer solutions and spiked saliva samples.
Figure 283
Figure 283
Schematic representation of the detection mechanism of pyrophosphate anions at μM concentrations by isoniazid functionalized calix[4]arene (C13.5) in 10 mM Tris-HCl buffer, pH 7.2. Adapted with permission from ref (1221). Copyright 2019 The Royal Society of Chemistry.
Figure 284
Figure 284
(a) EuIII–cyclen functionalized gold nanoparticles (N13.1) used for fluorescence turn-off sensing of phosphate anions in HEPES buffer solutions at μM concentrations. (b) Chemical structure of EuIII–cyclen and the β-diketone.
Figure 285
Figure 285
Carboxylic acid-functionalized AuNPs used in combination with EuIII ions (N13.2) used for colorimetric detection of pyrophosphate at μM concentrations in 25 mM Tris-HCl buffer, pH 7.4. Reproduced with permission from ref (1223). Copyright 2013 Elsevier BV.
Figure 286
Figure 286
Resorcinarene-functionalized AuNPs (N13.3) used for colorimetric detection of phosphates at μM concentrations in 10 mM HEPES buffer, pH 7.4. Adapted with permission from ref (1224). Copyright 2017 Elsevier BV.
Figure 287
Figure 287
AgNPs-based and smartphone-assisted sensor (N13.4) used for sensitive detection (1 μM) of pyrophosphate in water and food samples. Adapted with permission from ref (1225). Copyright 2020 Elsevier BV.
Figure 288
Figure 288
Plasmonic silver nanoparticles coated with silk fibroin for fluorescence turn-on detection of pyrophosphate (μM) in Britton–Robinson buffer and urine.
Figure 289
Figure 289
Fe3+-doped carbon-dots (N13.6) used for fluorescence turn-on detection of pyrophosphate at μM concentration in urine samples. Reproduced with permission from ref (1227). Copyright 2019 Elsevier BV.
Figure 290
Figure 290
(a) Schematic representation of the detection of orthophosphates at μM concentrations with carbon dot/ZIF-90 nanoparticles in 10 mM Tris-HCl buffer, pH 8.6. (b) Crystal structure and chemical composition of ZIF-90 MOF. Adapted with permission from ref (1228). Copyright 2010 American Chemistry Society.
Figure 291
Figure 291
Chemical structure of the nanoaggregates (N13.8) formed when inorganic phosphates are added to a solution of EuIII salts, adenine, and 2,6-pyridinecarboxylic. These fluorescent nanoparticles allow for luminescence-based detection of phosphate at μM concentrations in 15 mM HEPES buffer, pH 7.4.

References

    1. Cram D. J. The Design of Molecular Hosts, Guests, and Their Complexes (Nobel Lecture). Angew. Chem., Int. Ed. Engl. 1988, 27, 1009–1020. 10.1002/anie.198810093. - DOI - PubMed
    1. Pedersen C. J. The Discovery of Crown Ethers (Noble Lecture). Angew. Chem., Int. Ed. Engl. 1988, 27, 1021–1027. 10.1002/anie.198810211. - DOI
    1. Lehn J.-M. Supramolecular Chemistry: Where From? Where To?. Chem. Soc. Rev. 2017, 46, 2378–2379. 10.1039/C7CS00115K. - DOI - PubMed
    1. Sauvage J.-P. From Chemical Topology to Molecular Machines (Nobel Lecture). Angew. Chem., Int. Ed. 2017, 56, 11080–11093. 10.1002/anie.201702992. - DOI - PubMed
    1. Stoddart J. F. Mechanically Interlocked Molecules (Mims)–Molecular Shuttles, Switches, and Machines (Nobel Lecture). Angew. Chem., Int. Ed. 2017, 56, 11094–11125. 10.1002/anie.201703216. - DOI - PubMed

Publication types