. 2022 Jan 25;38(3):968-978.
doi: 10.1021/acs.langmuir.1c02293. Epub 2022 Jan 7.

Understanding the Adhesion Mechanism of Hydroxyapatite-Binding Peptide

Affiliations

Understanding the Adhesion Mechanism of Hydroxyapatite-Binding Peptide

Tal Duanis-Assaf et al. Langmuir. .

Abstract

Understanding the interactions between the protein collagen and hydroxyapatite is of high importance for understanding biomineralization and bone formation. Here, we undertook a reductionist approach and studied the interactions between a short peptide and hydroxyapatite. The peptide was selected from a phage-display library for its high affinity to hydroxyapatite. To study its interactions with hydroxyapatite, we performed an alanine scan to determine the contribution of each residue. The interactions of the different peptide derivatives were studied using a quartz crystal microbalance with dissipation monitoring and with single-molecule force spectroscopy by atomic force microscopy. Our results suggest that the peptide binds via electrostatic interactions between cationic moieties of the peptide and the negatively charged groups on the crystal surface. Furthermore, our findings show that cationic residues have a crucial role in binding. Using molecular dynamics simulations, we show that the peptide structure is a contributing factor to the adhesion mechanism. These results suggest that even small conformational changes can have a significant effect on peptide adhesion. We suggest that a bent structure of the peptide allows it to strongly bind hydroxyapatite. The results presented in this study improve our understanding of peptide adhesion to hydroxyapatite. On top of physical interactions between the peptide and the surface, peptide structure contributes to adhesion. Unveiling these processes contributes to our understanding of more complex biological systems. Furthermore, it may help in the design of de novo peptides to be used as functional groups for modifying the surface of hydroxyapatite.


Conflict of interest statement

The authors declare no competing financial interest.

Figures

Figure 1
Figure 1
Comparison between the adhesion of the native peptide and SVSV derivatives to HAp using QCM-D analysis. (a) A typical adhesion curve of the native peptide. The blue line represents the change in measured frequency, and the red line represents the change in dissipation signal. (b) Typical adhesion curves of the native peptide, SVSV, and ΔSVSV sequences. (a and b) The arrows illustrate the point of injection (continuous line) and washing with buffer (dashed line). (c) The change in the measured frequency (between the point of injection and end of washing) between the native peptide and SVSV derivatives. (d) The peptide surface concentration, after the washing period, was calculated according to the Voigt mass. The error bars represent the standard error of the mean based on 2−3 repeats. Frequency data are taken from the ninth overtone.
Figure 2
Figure 2
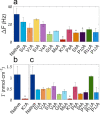
A comparison between the adhesion of the different peptides to HAp monitored by QCM-D. (a) A comparison of the measured frequency change between the native peptide and all alanine scan derivatives. (b and c) Peptide surface concentration after the washing period, calculated according to Voigt mass. (b) A comparison between the native peptide and K7A. (c) A comparison between the native peptide and all alanine scan derivatives. The error bars represent the standard error of the mean based on 2−3 measurements. The asterisks represent significantly different mean values in comparison to the native peptide as determined by one-way ANOVA followed by the post hoc Tukey test.
Figure 3
Figure 3
Adhesion force measurements using SMFS. The top panel shows details about the native peptide, and the bottom panel shows details about the K7A derivative. (left) Typical force profiles of the adhesion interaction. (middle) Unbinding force histograms with the calculated most probable force (MPF) and average loading rate (LR). The errors are confidence intervals calculated for α = 0.05. (right) Bell–Evans plots.
Figure 4
Figure 4
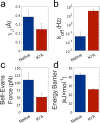
Kinetic parameters of the interaction between HAp and the native peptide and K7A derivative were calculated using the Bell–Evans model. (a) The transition state distance (χβ). (b) The bond dissociation rate (koff). (c) The rupture force was calculated according to the Bell–Evans model using the kinetic parameters (χβ, koff) at a loading rate of 10 nN s–1. (d) The dissociation energy barrier. The error bars represent the standard error of the mean.
Figure 5
Figure 5
Peptide adhesion under different ionic strengths monitored by QCM-D. (a) The adhesion curves of the native peptide in increasing buffer ionic strength. (b) The change in frequency over the course of 18 h starting from the point of injection. The adhesion decreases with the increase in ionic strength. The error bars represent the standard error of the mean of 2−3 measurements.
Figure 6
Figure 6
Energy, force of interaction, and peptide conformation between the native, K7A and R11A peptides and HAp (100) surface, predicted by molecular dynamics simulations. The left panel shows the magnitude of the different potentials between the peptide and the HAp surface during the first 50 ns of energy simulation. Hydrophobic interactions were calculated using the Lennard-Jones potential (a), Coulombic potential (b), and the total binding energy (c). The middle panel shows the change in force versus pull-off distance calculated using SMD simulations (d). The right panel shows snapshots of peptide conformations taken at the beginning of the SMD simulation (initial state) and two force peaks marked I and II on the corresponding SMD force versus distance curve.

References

    1. Olszta M. J.; Cheng X.; Jee S. S.; Kumar R.; Kim Y.-Y.; Kaufman M. J.; Douglas E. P.; Gower L. B. Bone structure and formation: A new perspective. Mater. Sci. Eng. R 2007, 58 (3–5), 77–116. 10.1016/j.mser.2007.05.001. - DOI
    1. Nair A. K.; Gautieri A.; Chang S.-W.; Buehler M. J. Molecular mechanics of mineralized collagen fibrils in bone. Nat. Commun. 2013, 4 (1), 1–9. 10.1038/ncomms2720. - DOI - PMC - PubMed
    1. Weiner S.; Wagner H. D. The material bone: structure-mechanical function relations. Annu. Rev. Mater. Sci. 1998, 28 (1), 271–298. 10.1146/annurev.matsci.28.1.271. - DOI
    1. Liebi M.; Georgiadis M.; Menzel A.; Schneider P.; Kohlbrecher J.; Bunk O.; Guizar-Sicairos M. Nanostructure surveys of macroscopic specimens by small-angle scattering tensor tomography. Nature 2015, 527 (7578), 349–352. 10.1038/nature16056. - DOI - PubMed
    1. Seknazi E.; Pokroy B. Residual strain and stress in biocrystals. Adv. Mater. 2018, 30 (41), 1707263.10.1002/adma.201707263. - DOI - PubMed