. 2022 Feb 8;17(2):369-383.
doi: 10.1016/j.stemcr.2021.12.002. Epub 2022 Jan 6.

RNF43/ZNRF3 negatively regulates taste tissue homeostasis and positively regulates dorsal lingual epithelial tissue homeostasis

Affiliations

RNF43/ZNRF3 negatively regulates taste tissue homeostasis and positively regulates dorsal lingual epithelial tissue homeostasis

Chanyi Lu et al. Stem Cell Reports. .

Abstract

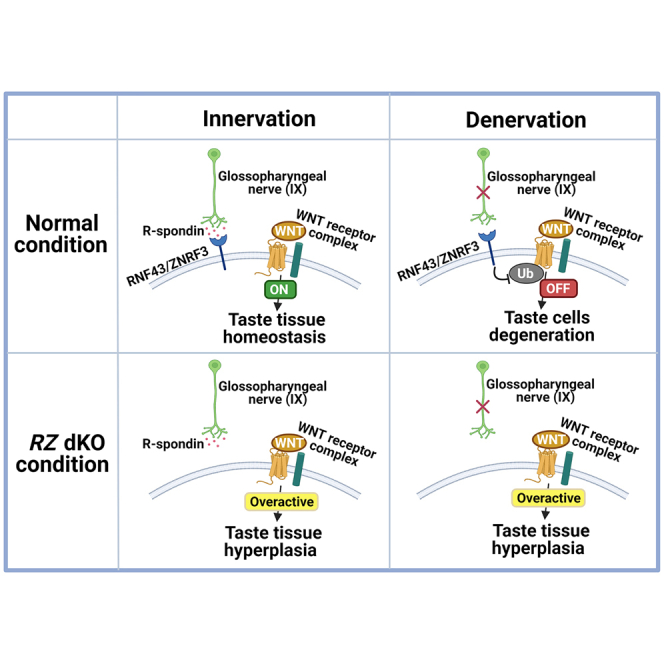
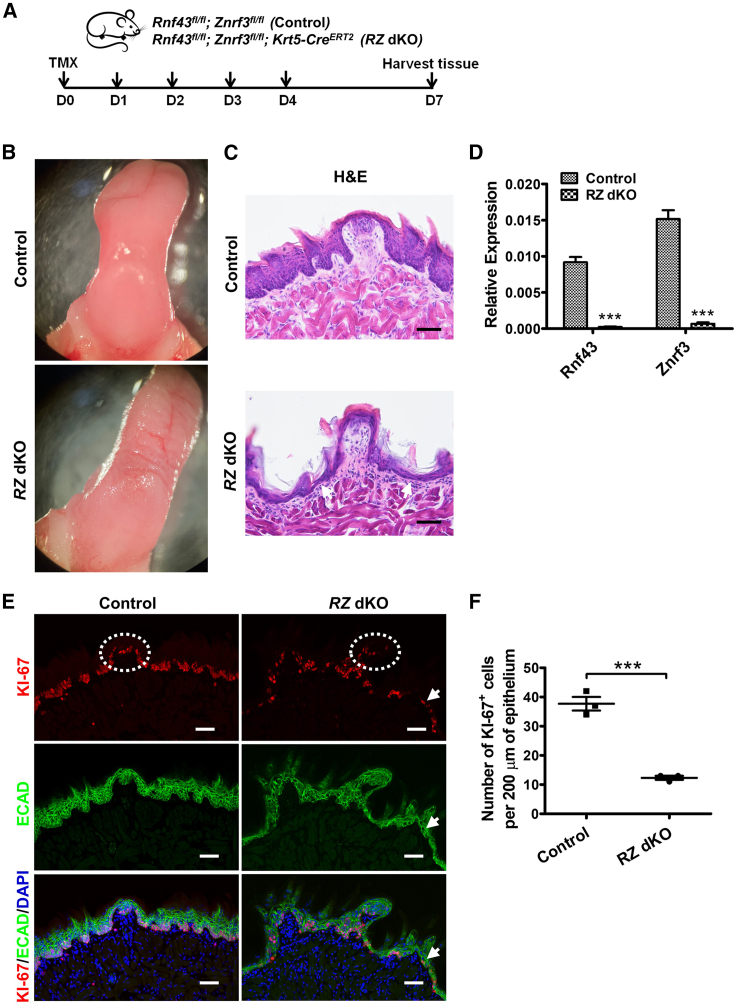
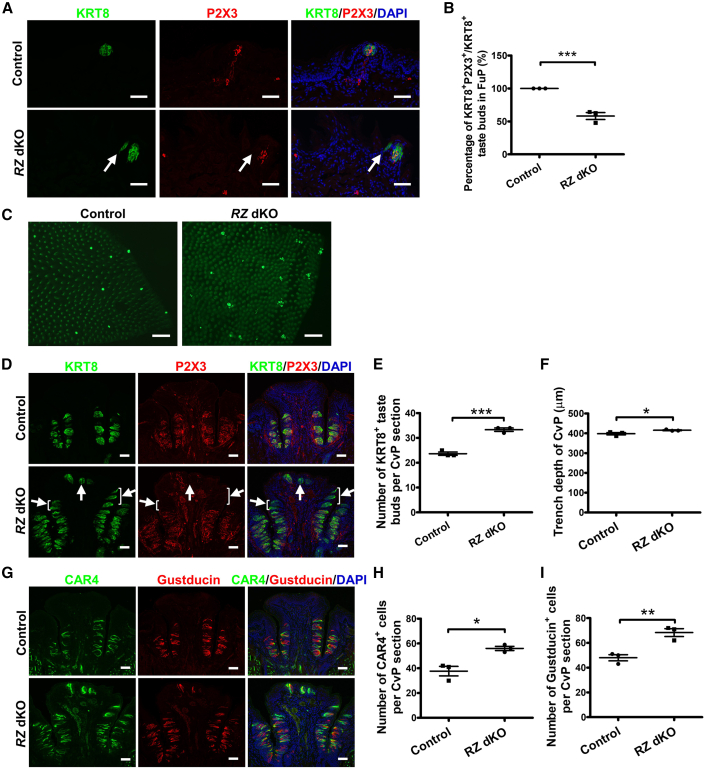
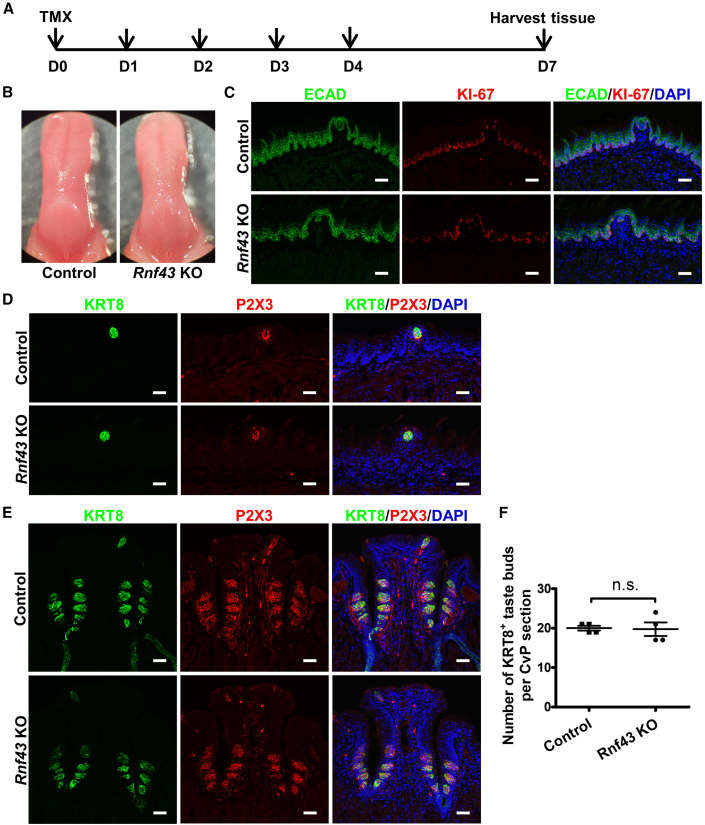
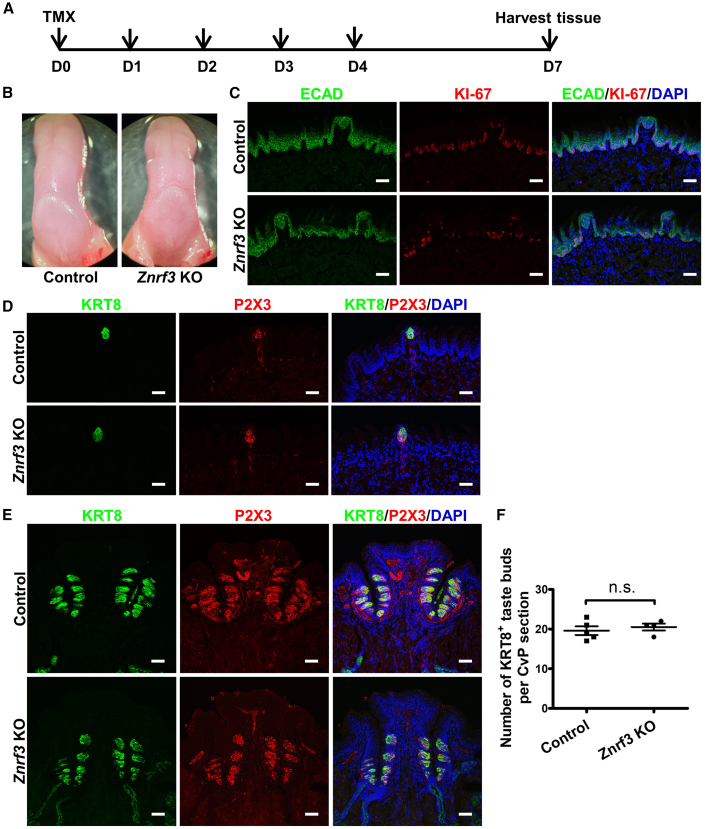
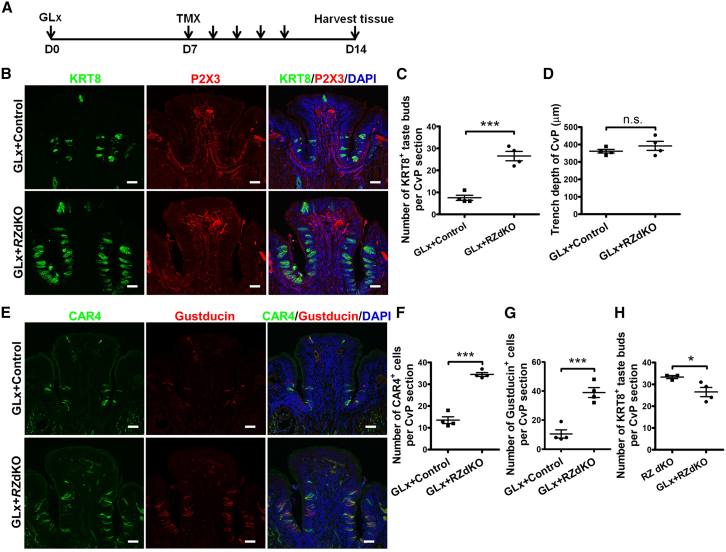
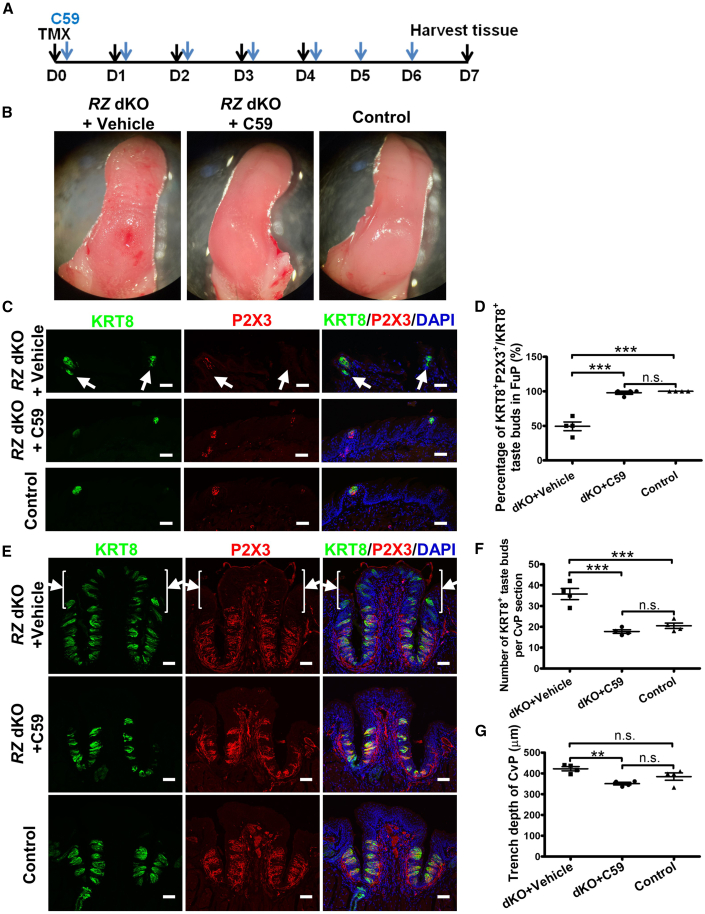
Taste bud cells are renewed throughout life in a process requiring innervation. Recently, we reported that R-spondin substitutes for neuronal input for taste cell regeneration. R-spondin amplifies WNT signaling by interacting with stem-cell-expressed E3 ubiquitin ligases RNF43/ZNRF3 (negative regulators of WNT signaling) and G-protein-coupled receptors LGR4/5/6 (positive regulators of WNT signaling). Therefore, we hypothesized that RNF43/ZNRF3 may serve as a brake, controlled by gustatory neuron-produced R-spondin, for regulating taste tissue homeostasis. Here, we show that mice deficient for Rnf43/Znrf3 in KRT5-expressing epithelial stem/progenitor cells (RZ dKO) exhibited taste cell hyperplasia; in stark contrast, epithelial tissue on the tongue degenerated. WNT signaling blockade substantially reversed all these effects in RZ dKO mice. Furthermore, innervation becomes dispensable for taste cell renewal in RZ dKO mice. We thus demonstrate important but distinct functions of RNF43/ZNRF3 in regulating taste versus lingual epithelial tissue homeostasis.

Keywords: LGR5; R-spondin; RNF43; WNT; ZNRF3; taste stem cells.


Figures

None
Graphical abstract
Figure 1
Figure 1
Expression of Rnf43 and Znrf3 in the circumvallate papillae, fungiform papillae, and surrounding lingual epithelium (A and B) In situ hybridization of Rnf43 and Znrf3 with antisense riboprobes in circumvallate papilla in posterior tongue (A) and in fungiform papillae and the surrounding lingual epithelium (e.g., filiform papillae) in anterior tongue (B). Dotted lines in insets demarcate epithelial-mesenchymal boundaries. Arrows, fungiform papillae; arrowheads, filiform papillae. Scale bars, 50 μm.
Figure 2
Figure 2
Ablation of Rnf43/Znrf3 leads to a wrinkled tongue and thinner tongue epithelium (A) Schematic illustration of the experimental design. Control (Rnf43fl/fl;Znrf3fl/fl) and Rnf43fl/fl;Znrf3fl/fl;Krt5-CreERT2 mice were treated with tamoxifen for five continuous days (D0–D4), and tongue tissue was collected at day 7. TMX, tamoxifen. (B) Representative bright-field images of tongues collected from control (n = 3) and RZ dKO (n = 3) mice. (C) Representative images of hematoxylin and eosin (H&E) staining of anterior tongue sections from control and RZ dKO mice. Note the thinner lingual epithelium (arrows) in RZ dKO mice. n = 3 for each group. Scale bars, 50 μm. (D) qRT-PCR analysis of the expression of Rnf43 and Znrf3 in tongue epithelium in control and RZ dKO mice. Expression levels of Rnf43 and Znrf3 were normalized to Gapdh. Data are presented as mean ± SEM. ∗∗∗p < 0.0001. n = 3 for control group and n = 4 for RZ dKO group. (E) Immunofluorescence staining of sections of anterior tongues of control and RZ dKO mice for KI-67 (red) and E-cadherin (ECAD, green). We frequently noted a single layer of sparse KI-67+ cells in the dorsal lingual epithelium in RZ dKO sections (arrow), but not in sections from control mice. Dashed circles show fungiform papillae. Cell nuclei were counterstained with DAPI (blue). n = 3 for each group. Scale bars, 50 μm. (F) Tabulation of KI-67+ cells in the dorsal lingual epithelium. Fewer KI-67+ cells are present in the dorsal lingual epithelium of RZ dKO mice than of control mice. Data are presented as mean ± SEM. ∗∗∗p = 0.0005. n = 3 for each group. See also Figures S1.
Figure 3
Figure 3
Deletion of Rnf43/Znrf3 leads to taste tissue hyperplasia in the fungiform papillae and circumvallate papilla (A) Immunofluorescence staining for KRT8 (green) and P2X3 (red) in fungiform papillae. Ectopic (uninnervated) taste bud cells (arrow) are present near fungiform taste buds in dKO mice. Cell nuclei were counterstained with DAPI (blue). n = 3 for each group. Scale bars, 50 μm. (B) Percentage of KRT8+ taste buds that are also positive for P2X3 (i.e., innervated) in fungiform papillae (FuP). Data are presented as mean ± SEM. ∗∗∗p = 0.0001. n = 3 for each group. Each point represents a single mouse. (C) Representative images of KRT8 immunostaining of whole-mount tongue epithelium in the tip of the tongue. Unlike the single KRT8+ bright spot (i.e., KRT8+ taste bud) in each fungiform papilla in control mice (n = 3) shown in (A), here a few small scattered spots are visible in some fungiform papillae in RZ dKO mice (n = 3). Scale bars, 200 μm. (D) Representative images of KRT8 and P2X3 immunostaining of circumvallate papilla sections from control and RZ dKO mice. KRT8+ ectopic taste buds (arrows) are present in the upper cleft and dorsum of the circumvallate papilla in RZ dKO mice. Cell nuclei were counterstained with DAPI (blue). n = 3 for each group. Scale bars, 50 μm. (E) Number of KRT8+ taste buds in the circumvallate papilla from control and RZ dKO mice. Data are presented as mean ± SEM. ∗∗∗p = 0.0005. n = 3 for each group. Each point represents a single mouse. CvP, circumvallate papilla. (F) Analysis of the depth of trench of the circumvallate papilla in control and RZ dKO mice. Note the small variation of the depth of trench of the circumvallate papilla within the group. Data are presented as mean ± SEM. p = 0.049. n = 3 for each group. CvP, circumvallate papilla. (G) Immunofluorescence staining for CAR4 (green) and α-Gustducin (red) of circumvallate papilla sections. Cell nuclei were counterstained with DAPI (blue). Scale bars, 50 μm. (H and I) Numbers of CAR4+ cells (H) and α-Gustducin+ cells (I) show proportionate increases in type II and III taste cell with loss of Rnf43 and Znrf3 in circumvallate papilla. Data are presented as mean ± SEM. p = 0.0122, ∗∗p = 0.0074. n = 3 for each group. Each point represents a single mouse. See also Figures S2.
Figure 4
Figure 4
Mice deficient for Rnf43 show no detectable changes in taste tissues and mild changes in the dorsal lingual epithelium (A) Schematic illustration of the experimental design. (B) Representative bright-field images of tongues collected from control and single Rnf43 KO mice. (C) Immunofluorescence staining of anterior tongue sections of control and single Rnf43 KO mice for E-cadherin (ECAD, green) and KI-67 (red). Note that KI-67+ cells are fewer in Rnf43 KO mice than control mice. Cell nuclei were counterstained with DAPI (blue). Scale bars, 50 μm. (D and E) Immunofluorescence staining for KRT8 (green) and P2X3 (red) of anterior tongue sections (D) and circumvallate papilla sections (E) from control and single Rnf43 KO mice. There are no apparent changes in the KRT8 and P2X3 staining patterns. Cell nuclei were counterstained with DAPI (blue). Scale bars, 50 μm. (F) Number of KRT8+ taste buds in the circumvallate papilla from control and single Rnf43 KO mice. Data are presented as mean ± SEM. n.s., not significant. n = 4 for each group. Each point represents a single mouse. CvP, circumvallate papilla.
Figure 5
Figure 5
Mice deficient for Znrf3 show no detectable changes in taste tissues and mild changes in the dorsal lingual epithelium (A) Schematic illustration of the experimental design. (B) Representative bright-field images of tongues collected from control and single Znrf3 KO mice. (C) Immunofluorescence staining of anterior tongue sections of control and single Znrf3 KO mice for E-cadherin (ECAD, green) and KI-67 (red). Cell nuclei were counterstained with DAPI (blue). Scale bars, 50 μm. (D and E) Immunofluorescence staining for KRT8 (green) and P2X3 (red) of anterior tongue sections (D) and circumvallate papilla sections (E) from control and single Znrf3 KO mice. Cell nuclei were counterstained with DAPI (blue). Scale bars, 50 μm. (F) Number of KRT8+ taste buds in the circumvallate papilla from control and single Znrf3 KO mice. Data are presented as mean ± SEM. n.s., not significant. n = 5 for control group and n = 4 for Znrf3 KO group. Each point represents a single mouse. CvP, circumvallate papilla.
Figure 6
Figure 6
Rnf43/Znrf3 dKO promotes maintenance of taste bud after glossopharyngeal nerve transection (GLx) (A) Schematic illustration of the experimental design. Bilateral GLx was performed at day 0 (D0), followed by tamoxifen induction of conditional deletion of Rnf43/Znrf3 at day 7. Tissues were collected at day 14. TMX, tamoxifen. (B) Representative images of KRT8 and P2X3 immunostaining of circumvallate papilla sections from control and RZ dKO mice. Only a few residual KRT8+ taste cells are present in control mice; in contrast, numerous KRT8+ taste cells have regenerated in RZ dKO mice. Little or no P2X3 staining is present in taste tissues in either control or RZ dKO mice, although P2X3 signal is detected in the mesenchymal core. n = 4 for each group. Scale bars, 50 μm. (C) Number of KRT8+ taste buds in the circumvallate papilla from control and RZ dKO GLx mice. Data are presented as mean ± SEM. ∗∗∗p = 0.0002. n = 4 for each group. Each point represents a single mouse. CvP, circumvallate papilla. (D) Analysis of the depth of trench of the circumvallate papilla in GLx + Control and GLx + RZ dKO mice. Data are presented as mean ± SEM. n.s., not significant. n = 4 for each group. (E) Immunofluorescence staining for CAR4 (green) and α-Gustducin (red) of circumvallate papilla sections. Few residual CAR4+ or α-Gustducin+ cells are present in control mice after GLx, compared with multiple CAR4+ or α-Gustducin+ cells in RZ dKO mice after GLx. Cell nuclei were counterstained with DAPI (blue). Scale bars, 50 μm. (F and G) Numbers of CAR4+ taste cells (F) and α-Gustducin+ taste cells (G) in circumvallate papilla in RZ dKO and control mice after GLx. Data are presented as mean ± SEM. ∗∗∗p < 0.0001 in (F) and p = 0.0007 in (G). n = 4 for each group. Each point represents a single mouse. (H) Number of KRT8+ taste buds in the circumvallate papilla from RZ dKO and GLx RZ dKO mice. Data are presented as mean ± SEM. p = 0.0437. n = 3 for RZ dKO group and n = 4 for GLx RZ dKO group. Each point represents a single mouse. CvP, circumvallate papilla.
Figure 7
Figure 7
WNT signaling blockade prevents taste tissue hyperplasia and lingual epithelium degeneration in RZ dKO mice (A) Schematic illustration of the experiment design. Rnf43fl/fl;Znrf3fl/fl and Rnf43fl/fl;Znrf3fl/fl;Krt5-CreERT2 mice were treated with tamoxifen for five continuous days and C59 for seven continuous days, and tongue tissue was harvested at day 7. TMX, tamoxifen. (B) Representative bright-field images of the tongue (dorsal surface) from RZ dKO mice with or without C59 treatment and from control mice. The dorsal surface of RZ dKO mice that received C59 treatment reverted to a normal, smooth appearance. n = 4 for each group. (C) Immunofluorescence staining of KRT8 (green) and P2X3 (red) of anterior tongue sections. Ectopic taste bud cells (arrows) are present in dKO mice treated with vehicle but not in dKO mice treated with C59. Cell nuclei were counterstained with DAPI (blue). n = 4 for each group. Scale bars, 50 μm. (D) Percentage of KRT8+ taste buds that are also positive for P2X3 (i.e., innervated) in fungiform papillae (FuP). Data are presented as mean ± SEM. ∗∗∗p < 0.0001. n.s., not significant. n = 4 for each group. Each point represents a single mouse. (E) Immunofluorescence staining of KRT8 (green) and P2X3 (red) of circumvallate papilla sections. Ectopic taste bud cells (arrows) are present in the upper cleft and dorsum of the circumvallate papilla in RZ dKO mice treated with vehicle but not in dKO mice treated with C59. Cell nuclei were counterstained with DAPI (blue). n = 4 for each group. Scale bars, 50 μm. (F) Number of KRT8+ taste buds in the circumvallate papilla in RZ dKO mice with or without C59 treatment and in control mice. Data are presented as mean ± SEM. ∗∗∗p < 0.001. n.s., not significant. n = 4 for each group. Each point represents a single mouse. CvP, circumvallate papilla. (G) Analysis of the depth of trench of the circumvallate papilla in RZ dKO mice receiving vehicle or C59 or in control mice. Data are presented as mean ± SEM. ∗∗p = 0.0083. n.s., not significant. n = 4 for each group. See also Figures S5–S7.

Similar articles

Cited by

References

    1. Aihara E., Mahe M.M., Schumacher M.A., Matthis A.L., Feng R., Ren W., Noah T.K., Matsu-ura T., Moore S.R., Hong C.I., et al. Characterization of stem/progenitor cell cycle using murine circumvallate papilla taste bud organoid. Sci. Rep. 2015;5:17185. doi: 10.1038/srep17185. - DOI - PMC - PubMed
    1. Bachmanov A.A., Beauchamp G.K. Taste receptor genes. Annu. Rev. Nutr. 2007;27:389–414. doi: 10.1146/annurev.nutr.26.061505.111329. - DOI - PMC - PubMed
    1. Barlow L.A., Klein O.D. Developing and regenerating a sense of taste. Curr. Top. Dev. Biol. 2015;111:401–419. doi: 10.1016/bs.ctdb.2014.11.012. - DOI - PMC - PubMed
    1. Basham K.J., Rodriguez S., Turcu A.F., Lerario A.M., Logan C.Y., Rysztak M.R., Gomez-Sanchez C.E., Breault D.T., Koo B.K., Clevers H., et al. A ZNRF3-dependent Wnt/beta-catenin signaling gradient is required for adrenal homeostasis. Genes Dev. 2019;33:209–220. doi: 10.1101/gad.317412.118. - DOI - PMC - PubMed
    1. Beidler L.M., Smallman R.L. Renewal of cells within taste buds. J. Cell Biol. 1965;27:263–272. - PMC - PubMed

Publication types

Substances