

Portability of 245 polygenic scores when derived from the UK Biobank and applied to 9 ancestry groups from the same cohort
- PMID: 34995502
- PMCID: PMC8764121
- DOI: 10.1016/j.ajhg.2021.11.008
Portability of 245 polygenic scores when derived from the UK Biobank and applied to 9 ancestry groups from the same cohort
Erratum in
-
Portability of 245 polygenic scores when derived from the UK Biobank and applied to 9 ancestry groups from the same cohort.Am J Hum Genet. 2022 Feb 3;109(2):373. doi: 10.1016/j.ajhg.2022.01.007. Am J Hum Genet. 2022. PMID: 35120604 Free PMC article. No abstract available.
Abstract
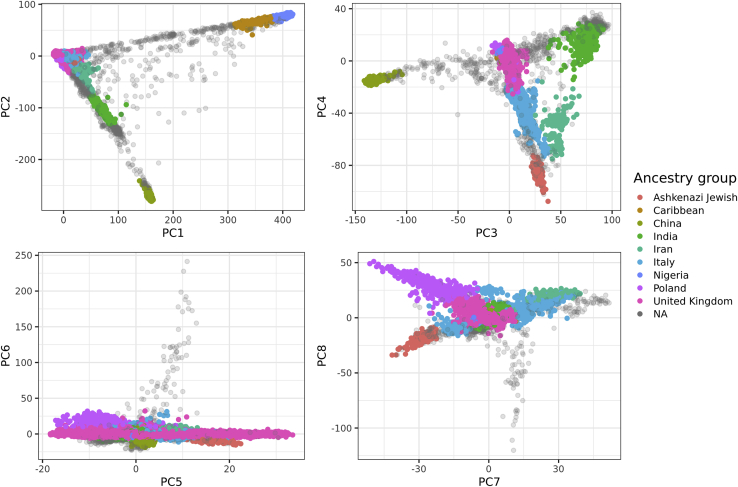
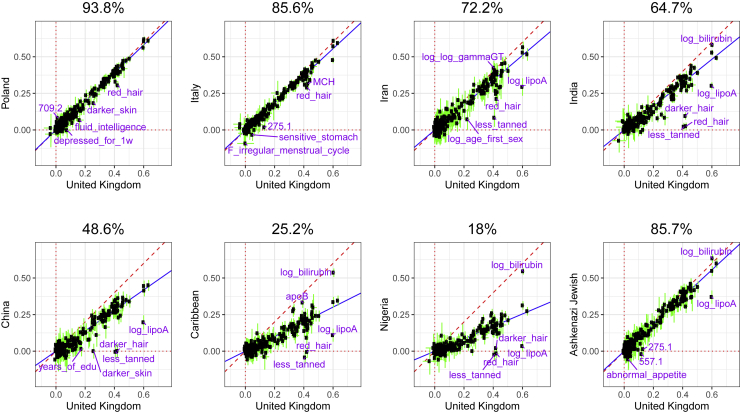
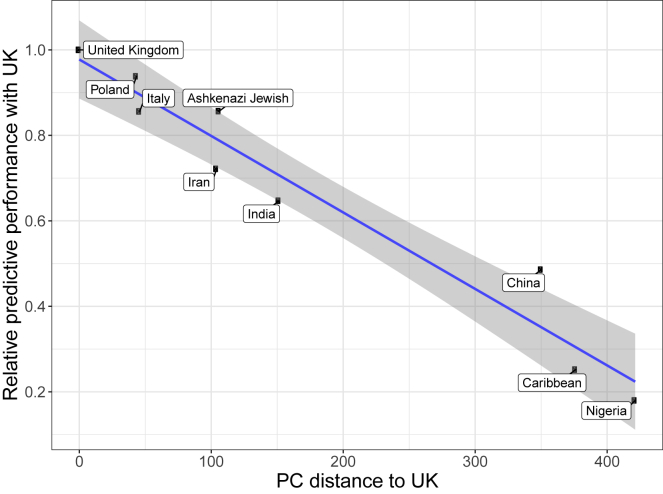
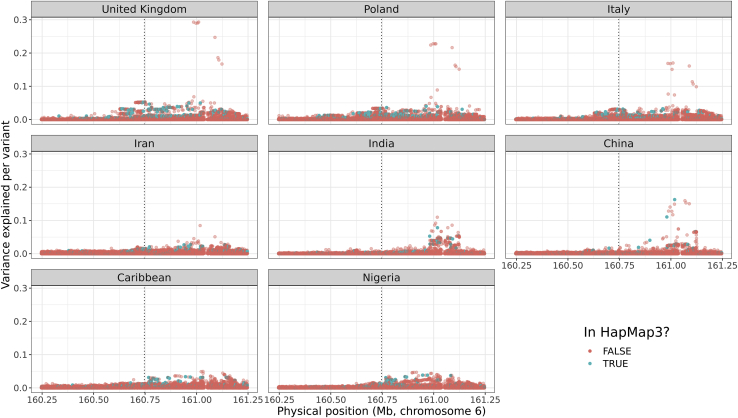
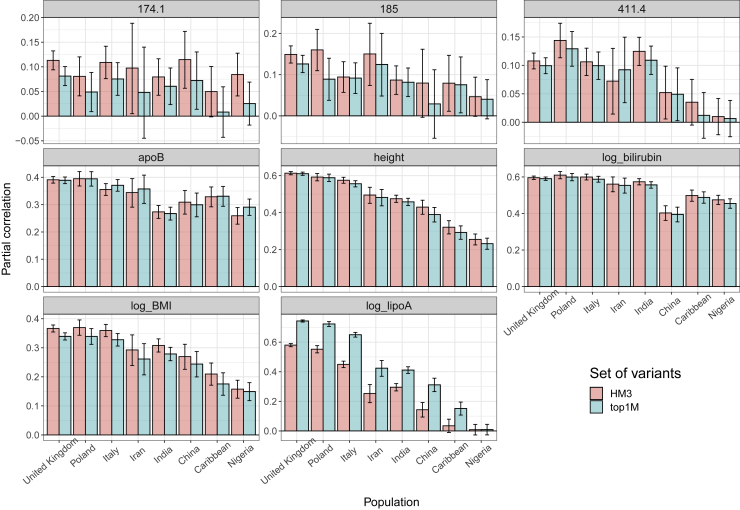
The low portability of polygenic scores (PGSs) across global populations is a major concern that must be addressed before PGSs can be used for everyone in the clinic. Indeed, prediction accuracy has been shown to decay as a function of the genetic distance between the training and test cohorts. However, such cohorts differ not only in their genetic distance but also in their geographical distance and their data collection and assaying, conflating multiple factors. In this study, we examine the extent to which PGSs are transferable between ancestries by deriving polygenic scores for 245 curated traits from the UK Biobank data and applying them in nine ancestry groups from the same cohort. By restricting both training and testing to the UK Biobank data, we reduce the risk of environmental and genotyping confounding from using different cohorts. We define the nine ancestry groups at a sub-continental level, based on a simple, robust, and effective method that we introduce here. We then apply two different predictive methods to derive polygenic scores for all 245 phenotypes and show a systematic and dramatic reduction in portability of PGSs trained using Northwestern European individuals and applied to nine ancestry groups. These analyses demonstrate that prediction already drops off within European ancestries and reduces globally in proportion to genetic distance. Altogether, our study provides unique and robust insights into the PGS portability problem.
Keywords: ancestry; polygenic scores; portability.
Copyright © 2021 American Society of Human Genetics. Published by Elsevier Inc. All rights reserved.
Conflict of interest statement
Declaration of interests S.C. is a paid consultant to MyHeritage. The other authors declare no competing interests.
Figures
References
-
- de los Campos G., Gianola D., Allison D.B. Predicting genetic predisposition in humans: the promise of whole-genome markers. Nat. Rev. Genet. 2010;11:880–886. - PubMed
Publication types
MeSH terms
Grants and funding
LinkOut - more resources
Full Text Sources
Other Literature Sources
