Randomized Controlled Trial
. 2022 Jan 8;22(1):19.
doi: 10.1186/s12866-021-02415-8.

Increased circulating butyrate and ursodeoxycholate during probiotic intervention in humans with type 2 diabetes

Affiliations
Randomized Controlled Trial

Increased circulating butyrate and ursodeoxycholate during probiotic intervention in humans with type 2 diabetes

Paul J McMurdie et al. BMC Microbiol. .

Abstract

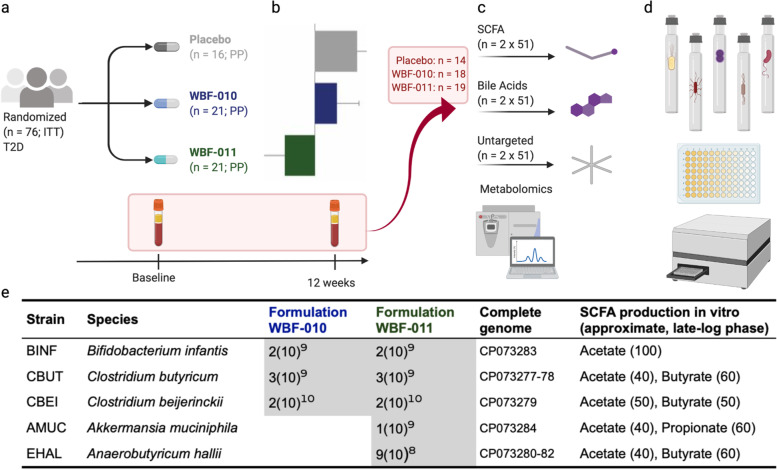
Background: An increasing body of evidence implicates the resident gut microbiota as playing a critical role in type 2 diabetes (T2D) pathogenesis. We previously reported significant improvement in postprandial glucose control in human participants with T2D following 12-week administration of a 5-strain novel probiotic formulation ('WBF-011') in a double-blind, randomized, placebo controlled setting (NCT03893422). While the clinical endpoints were encouraging, additional exploratory measurements were needed in order to link the motivating mechanistic hypothesis - increased short-chain fatty acids - with markers of disease.

Results: Here we report targeted and untargeted metabolomic measurements on fasting plasma (n = 104) collected at baseline and end of intervention. Butyrate and ursodeoxycholate increased among participants randomized to WBF-011, along with compelling trends between butyrate and glycated haemoglobin (HbA1c). In vitro monoculture experiments demonstrated that the formulation's C. butyricum strain efficiently synthesizes ursodeoxycholate from the primary bile acid chenodeoxycholate during butyrogenic growth. Untargeted metabolomics also revealed coordinated decreases in intermediates of fatty acid oxidation and bilirubin, potential secondary signatures for metabolic improvement. Finally, improvement in HbA1c was limited almost entirely to participants not using sulfonylurea drugs. We show that these drugs can inhibit growth of formulation strains in vitro.

Conclusion: To our knowledge, this is the first description of an increase in circulating butyrate or ursodeoxycholate following a probiotic intervention in humans with T2D, adding support for the possibility of a targeted microbiome-based approach to assist in the management of T2D. The efficient synthesis of UDCA by C. butyricum is also likely of interest to investigators of its use as a probiotic in other disease settings. The potential for inhibitory interaction between sulfonylurea drugs and gut microbiota should be considered carefully in the design of future studies.

Keywords: Akkermansia muciniphila; Anaerobutyricum hallii; Bile acids; Butyrate; Clostridium butyricum; Metabolomics; Short-chain fatty acids; Sulfonylurea; Type 2 diabetes; Ursodeoxycholate.


Conflict of interest statement

All authors are employees and stock/stock option shareholders of Pendulum Therapeutics, Inc. (formerly known as ‘Whole Biome Inc.’). O.K. also owns stock in GlySens, Inc., has stock options in ViaCyte, Inc. and NanoPrecision Medical.

Figures

Fig. 1
Fig. 1
Conceptual outline of study, analyses, and experiments. a Clinical study [21] overview including especially the ITT (n = 76) and PP (n = 58) participant totals, with T2D defined as fasting glucose ≥126 mg/dL or HbA1c ≥6.8%. b The fasting plasma specimens were collected during the same visit as the originally-described glucose control endpoints [21]. c Of these 58 participants, 51 had successfully collected blood plasma pairs suitable for the indicated targeted and untargeted metabolomics analyses. d Some of the observations derived from metabolomics were complemented with in vitro monoculture experiments using the formulation strains and additional metabolomics or growth dynamics measurements. e Summary of probiotic strains included in the intervention formulations WBF-010 or WBF-011. Identifiers for formulation and strains are the same as in [21]. Entries under each formulation identifier column indicate the approximate viable cell count per daily dose (CFU-equivalent), or absence if blank. Typical in vitro short-chain fatty acid production is indicated for each strain, with approximate ratios at late-log growth phase in VEG (AMUC) or PYG. Complete genome sequencing of each strain was performed, annotated, and deposited in GenBank with the indicated accession numbers
Fig. 2
Fig. 2
Summary of targeted measurements of short chain fatty acids in human plasma after fasting. a Change in fasting circulating (plasma) concentrations [μM] for the three major short chain fatty acids (SCFAs). Line ranges summarize the 95% within-group confidence interval (Wilcoxon Rank Sum test [37]), with nominal significance indicated above the respective group (star) or between-group comparison (bracket with star). Single and double stars indicate the one-sided significance of p < 0.05 and p = 0.007, respectively. b Scatter plot of human plasma butyrate [μM] versus fecal butyrate [mM] corresponding to specimens collected at the same clinical visit. Line indicates the robust linear regression [36], with a green shading and p-value shown for the only slope coefficient to reach nominal significance, p = 0.003. c Scatter plot of the change in participant HbA1c versus their change in plasma butyrate [μM]. Due to the confounding variable of SFU drug use (see below), participants using SFU drugs are highlighted in gray and omitted from the robust linear regressions. In both (b) and (c) the gray ribbon denotes the 95% confidence region for the linear regression. d Heatmap of Spearman’s correlation between the participant-wise changes in metabolic measures (top seven rows) and major SCFAs (bottom three rows). Correlations were separately estimated for each study arm. Correlation magnitude and direction is indicated by the provided color shading legend. ‘AUC_inc’ and ‘AUC_tot’ prefixes correspond to the incremental and total area under the curve of the oral meal tolerance test, respectively. For clarity, correlations with nominal p > 0.4 are set to zero (white color shading) irrespective of incidental correlation value
Fig. 3
Fig. 3
Plasma bile acids and evidence of direct conversion by formulation strains. a Changes in selected bile acids from untargeted metabolomics, as log2 ratio. Panel label indicates the group corresponding to the unconjugated form. Brackets highlight nominal statistical significance in between-group comparison (UDCA: p = 0.016, G-UDCA: p = 0.006), while (*) highlights within-group nominal significance (WBF-011, UDCA: p = 0.089, G-UDCA: p = 0.045). In panels (a)-(c), gray, blue, and green color represents the Placebo, WBF-010, and WBF-011 groups, respectively. b Changes in selected bile acids in targeted data, in micromoles per liter. Ordered as in (a) for comparison. Brackets highlight nominal statistical significance in the between-group comparison (UDCA: p = 0.075, G-UDCA: p = 0.066). c Plasma total bile acids. A light red color highlights the beginning of the reference range for (intermediate) hyperbiluremia (10 μM). A gray horizontal line indicates the study grand median at baseline, while a short solid horizontal bar indicates the groupwise median at each timepoint. d Summary of bile acids detected via untargeted metabolomics in a pilot in vitro monoculture survey. BINF, CBEI, CBUT and EHAL strains were grown in identical rich medium (PYG) amended with 50 μM each of human primary bile acids, cholic acid and CDCA. Maroon or blue color scale hew corresponds to negative or positive log10-ratio values, a decrease or increase in concentration of the specimen relative to the uninoculated medium, respectively. e Summary of UDCA synthesis during in vitro monoculture of formulation strains in media amended with 50 μM of the indicated primary bile acid. Only CBUT produced non-negligible UDCA. Red and blue color shading emphasizes detected primary and secondary human bile acids, respectively. Change in concentration is calculated as the average concentration measured in the uninoculated medium subtracted from the volume-weighted concentration of the endpoint cell pellet and supernatant
Fig. 4
Fig. 4
Summary of untargeted metabolomics from fasting plasma. a Distribution of the median participant-wise log2-ratios of each metabolite. Color palette by study arm is reused in the remaining panels. b QQ-plot [40] with 1-percentile steps for each probiotic intervention arm versus placebo. Color shading as in (a). c Principal Component Analysis (PCA [41]) on the participant-wise log2-ratios of each metabolite’s untargeted value. Each point represents a participant, with color shading by arm as in panel (A). Metabolites with low detection prevalence across the cohort were excluded (1156 of 1340 metabolites included). d Volcano-plot [42] summarizing the between-group multiple testing (Wilcoxon Rank Sum [37], two-sample, two-sided) of the participant-wise log2-ratio of each metabolite. Vertical axis indicates the nominal p-value of each metabolite, while the horizontal axis indicates the estimated effect, structured as the Placebo group subtracted from the Formulation group (either WBF-011 or WBF-010). The full volcano scatterplot is repeated as light gray points in separate panels that have an additional layer of green- or blue-shaded points, with each panel emphasizing a different metabolite group of prior interest and apparent coordinated change. e Summary of the within-group changes (participant-wise log2-ratios) for each study arm by metabolite and metabolite group highlighted in (d). Diamond and linerange indicates the group median and Wilcoxon 95% confidence interval, respectively
Fig. 5
Fig. 5
Sulfonylurea drugs: use stratifies glucose control endpoints, and some formulation strains are inhibited by SFUs in a drug-specific pattern. a Participant change in HbA1c versus study arm, with metabolomics-enhanced SFU drug usage status indicated by color shading. Gold and black color respectively indicate participants that are believed to have used, or not-used, SFU drug during the study as determined from the clinical record, direct observation of SFU in blood plasma, or both. Cross-bar indicates the value of each sub-group mean. b Summary of the re-estimation of glucose control endpoint statistics in the comparison of WBF-011 group (the five strain formulation) versus Placebo group (shown as WBF-011 - Placebo). ‘Per protocol’ refers to the cohort that successfully completed the study, as described previously [21]. ‘No SFU: Clinic’ refers to the results of between-group comparison among participants not known to use SFU according to the clinical record. This is equivalent to the confounding effect described in the original study. ‘No SFU: Clinic or Plasma’ is the same analysis, but with additional participants omitted where SFU was detected in metabolomics. c Representative growth curves (OD 600 nm versus time in hours) for formulation strains with or without the presence of the indicated SFU drug in mVEG (AMUC), mPYG (CBEI, CBUT), or PYG (BINF, EHAL). Panel rows from top to bottom represent a 2-fold increasing concentration of the indicated SFU, with the millimolar concentration labeled in the top-left corner. Each black curve is a separate replicate inoculated at the same time as other curves for that strain, including positive controls. Green and blue regions indicate the range occupied by no-SFU positive controls in the same medium, with or without the final volumetric fraction of DMSO (3% for CBUT, 2% for all others), respectively. OD 600 nm values have been spline-smoothed and baseline-subtracted. To improve interpretability, each curve has been filtered to display just the period of continuous monotonic increase (growth)

References

    1. CDC. National Diabetes Statistics Report, 2020: U.S. Department of Health and Human Services, Centers for Disease Control and Prevention (CDC); 2020:2–13. https://www.cdc.gov/diabetes/library/features/diabetes-stat-report.html. Accessed 26 Apr 2021
    1. Cani PD, Van Hul M, Lefort C, Depommier C, Rastelli M, Everard A. Microbial regulation of organismal energy homeostasis. Nat Metab. 2019;1:34–46. - PubMed
    1. Dabke K, Hendrick G, Devkota S. The gut microbiome and metabolic syndrome. J Clin Invest. 2019;129:4050–4057. - PMC - PubMed
    1. Kyriachenko Y, Falalyeyeva T, Korotkyi O, Molochek N, Kobyliak N. Crosstalk between gut microbiota and antidiabetic drug action. World J Diabetes. 2019;10:154–168. - PMC - PubMed
    1. Zhang Y, Gu Y, Ren H, Wang S, Zhong H, Zhao X, et al. Gut microbiome-related effects of berberine and probiotics on type 2 diabetes (the PREMOTE study) Nat Commun. 2020;11:5015. - PMC - PubMed

Publication types

MeSH terms

LinkOut - more resources