. 2022 Jan;97(1):57-67.
doi: 10.1016/j.mayocp.2021.09.006.

Associations of Neighborhood Socioeconomic Disadvantage With Chronic Conditions by Age, Sex, Race, and Ethnicity in a Population-Based Cohort

Affiliations

Associations of Neighborhood Socioeconomic Disadvantage With Chronic Conditions by Age, Sex, Race, and Ethnicity in a Population-Based Cohort

Alanna M Chamberlain et al. Mayo Clin Proc. 2022 Jan.

Abstract

Objective: To determine the association of socioeconomic status at the census block group level with chronic conditions and to determine whether the associations differ by age, sex, race, or ethnicity.

Methods: Adults aged 20 years and older on April 1, 2015, from 7 counties in southern Minnesota were identified using the Rochester Epidemiology Project records-linkage system. We estimated the prevalence of 19 chronic conditions (7 cardiometabolic, 7 other somatic, and 5 mental health conditions) at the individual level and a composite measure of neighborhood socioeconomic disadvantage (the area deprivation index [ADI]) at the census block group level (n=249).

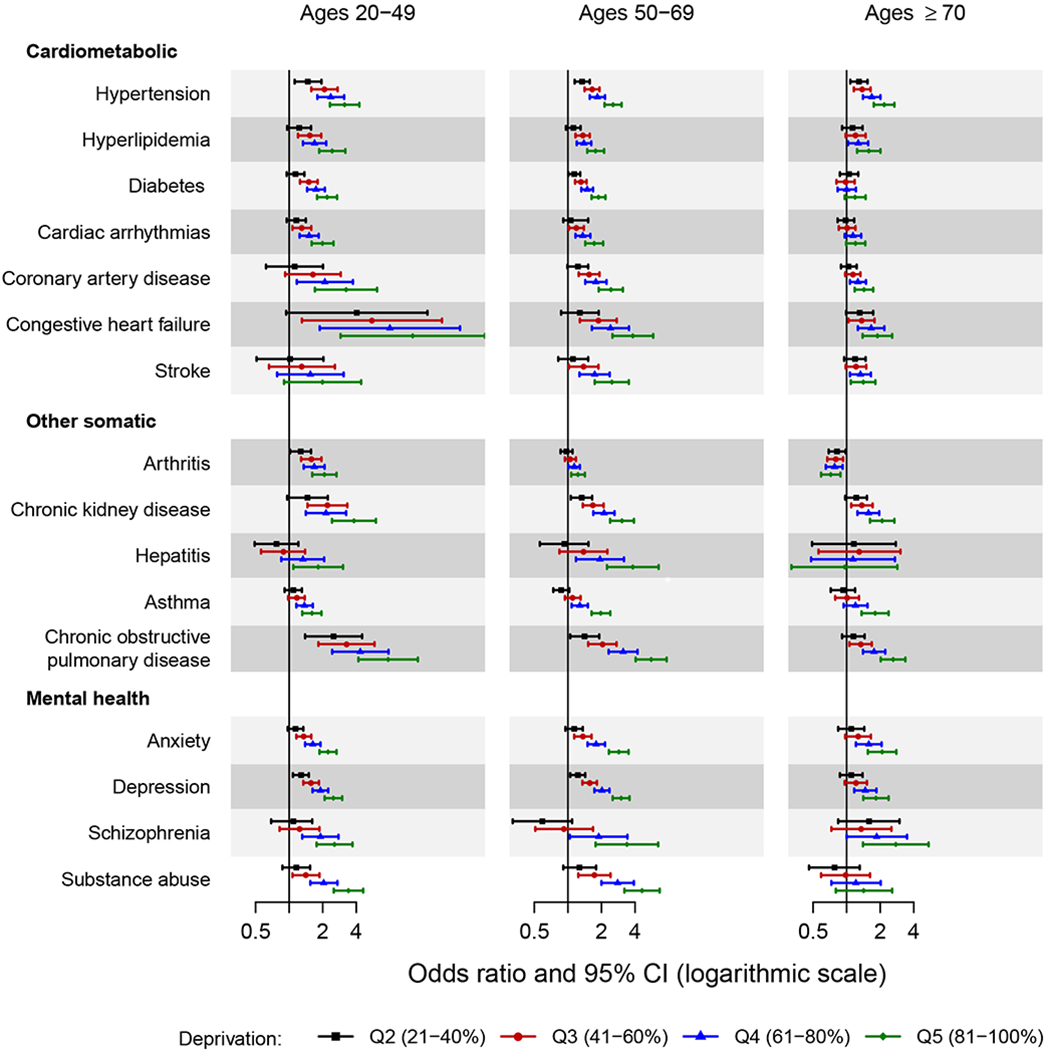
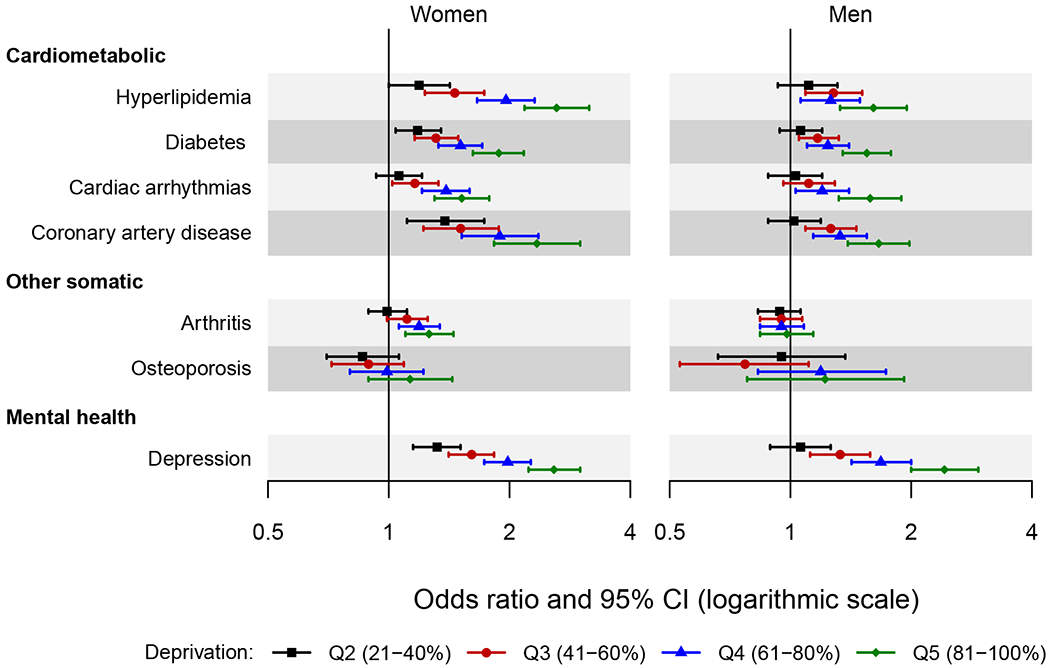
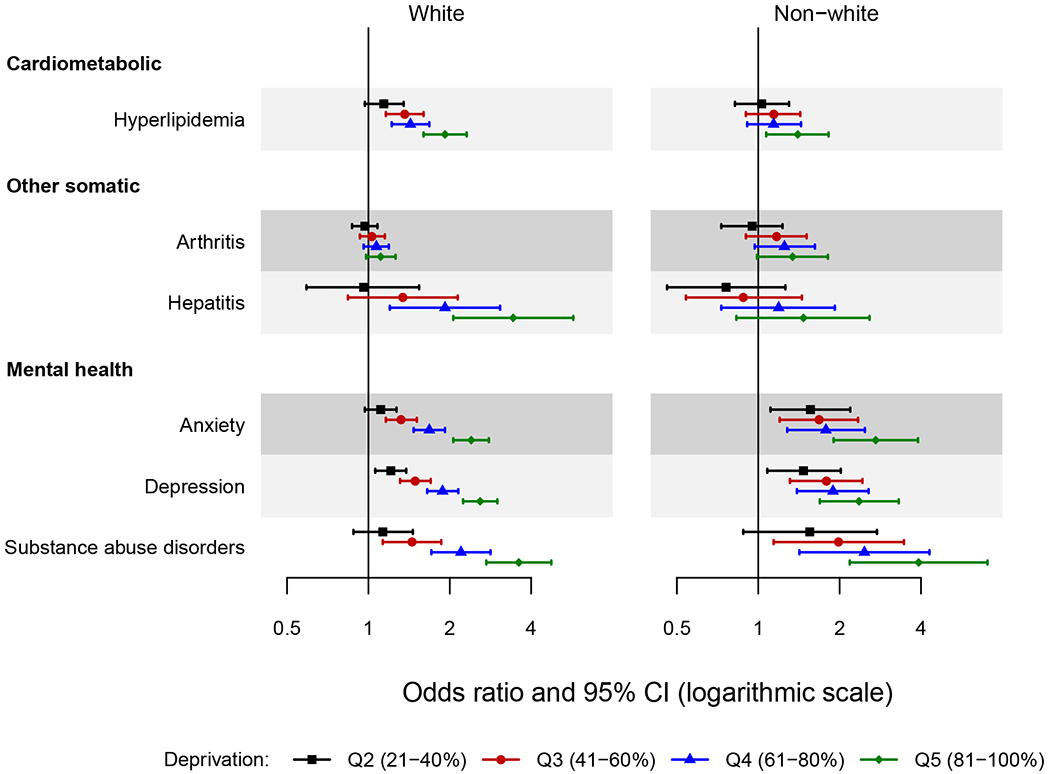
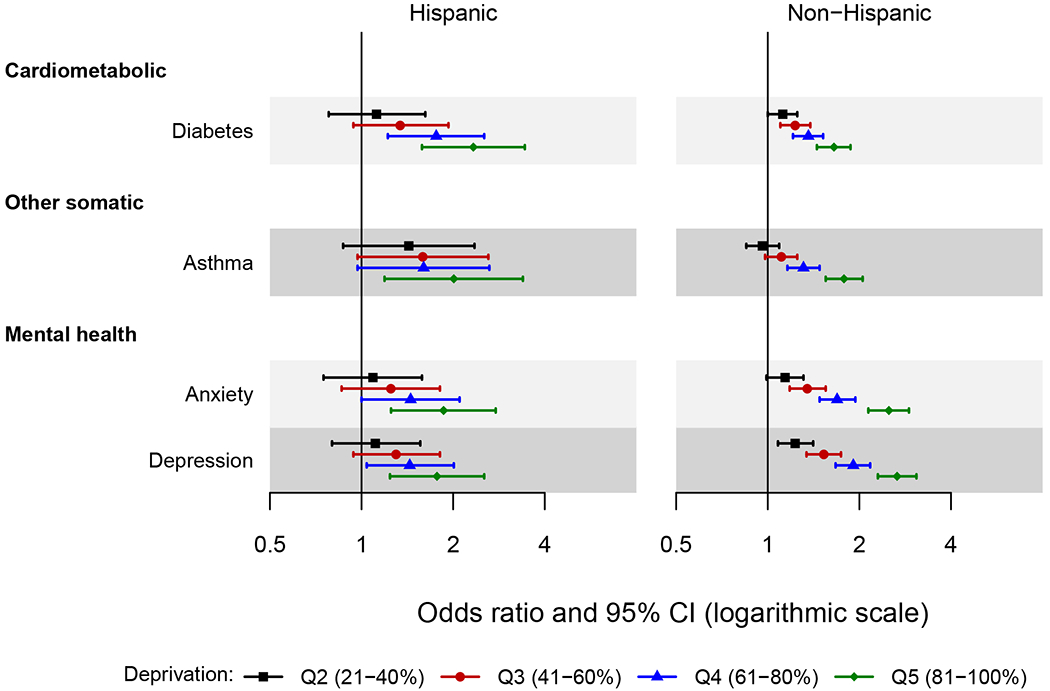
Results: Among the 197,578 persons in our study, 46.7% (92,373) were male, 49.5% (97,801) were aged 50 years and older, 12.3% (24,316) were of non-White race, and 5.3% (10,546) were Hispanic. The risk of most chronic conditions increased with increasing ADI. For each cardiometabolic condition and most other somatic and mental health conditions, the pattern of increasing risk across ADI quintiles was attenuated, or there was no association across quintiles of ADI in the oldest age group (aged ≥70 years). Stronger associations between ADI and several cardiometabolic, other somatic, and mental health conditions were observed in women.

Conclusion: Higher ADI was associated with increased risk of most chronic conditions, with more pronounced associations in younger persons. For some chronic conditions, the associations were stronger in women. Our findings underscore the importance of recognizing the overall and potentially differential impact of area-level deprivation on chronic disease outcomes for diverse populations.

Keywords: US Census; area deprivation index; chronic conditions; demographic variables; geocoding; socioeconomic status.


Conflict of interest statement

Conflict of Interest Disclosures: None reported.

Figures

Figure 1.
Figure 1.
Forest plot showing the odds ratio and 95% confidence interval of chronic conditions across quintiles of area deprivation index (ADI) by age groups. The area deprivation index was estimated at the census block group level. Quintiles were defined using national area deprivation index rankings from the Neighborhood Atlas (https://www.neighborhoodatlas.medicine.wisc.edu/). Quintile 1 (1-20%) served as the reference. Only the chronic conditions for which the two-way interactions of area deprivation index by age reached statistical significance are presented in the figure (16 chronic conditions). Odds ratios were adjusted for sex, race, ethnicity, and individual level of education. CI, confidence interval.
Figure 2.
Figure 2.
Forest plot showing the odds ratio and 95% confidence interval of chronic conditions across quintiles of area deprivation index (ADI) by sex. The area deprivation index was estimated at the census block group level. Quintiles were defined using national area deprivation index rankings from the Neighborhood Atlas (https://www.neighborhoodatlas.medicine.wisc.edu/). Quintile 1 (1-20%) served as the reference. Only the chronic conditions for which the two-way interactions of area deprivation index by sex reached statistical significance are presented in the figure (7 chronic conditions). Odds ratios were adjusted for age, race, ethnicity, and individual level of education. CI, confidence interval.
Figure 3.
Figure 3.
Forest plot showing the odds ratio and 95% confidence interval of chronic conditions across quintiles of area deprivation index (ADI) by race. The area deprivation index was estimated at the census block group level. Quintiles were defined using national area deprivation index rankings from the Neighborhood Atlas (https://www.neighborhoodatlas.medicine.wisc.edu/). Quintile 1 (1-20%) served as the reference. Only the chronic conditions for which the two-way interactions of area deprivation index by race reached statistical significance are presented in the figure (6 chronic conditions). Odds ratios were adjusted for age, sex, ethnicity, and individual level of education. CI, confidence interval.
Figure 4.
Figure 4.
Forest plot showing the odds ratio and 95% confidence interval of chronic conditions across quintiles of area deprivation index (ADI) by ethnicity. The area deprivation index was estimated at the census block group level. Quintiles were defined using national area deprivation index rankings from the Neighborhood Atlas (https://www.neighborhoodatlas.medicine.wisc.edu/). Quintile 1 (1-20%) served as the reference. Only the chronic conditions for which the two-way interactions of area deprivation index by ethnicity reached statistical significance are presented in the figure (4 chronic conditions). Odds ratios were adjusted for age, sex, race, and individual level of education. CI, confidence interval.

Comment in

References

    1. Zimmerman FJ, Anderson NW. Trends in health equity in the United States by race/ethnicity, sex, and income, 1993-2017. JAMA Netw Open. 2019;2(6):e196386. - PMC - PubMed
    1. Pathirana TI, Jackson CA. Socioeconomic status and multimorbidity: a systematic review and meta-analysis. Aust N Z J Public Health. 2018;42(2):186–194. - PubMed
    1. Xu X, Mishra GD, Jones M. Evidence on multimorbidity from definition to intervention: an overview of systematic reviews. Ageing Res Rev. 2017;37:53–68. - PubMed
    1. Violan C, Foguet-Boreu Q, Flores-Mateo G, et al.. Prevalence, determinants and patterns of multimorbidity in primary care: a systematic review of observational studies. PLoS One. 2014;9(7):e102149. - PMC - PubMed
    1. Chetty R, Stepner M, Abraham S, et al.. The association between income and life expectancy in the United States, 2001-2014. JAMA. 2016;315(16):1750–1766. - PMC - PubMed

Publication types