Bcl-2 Is Necessary to Counteract Bim and Promote Survival of TCRαβ+CD8αα+ Intraepithelial Lymphocyte Precursors in the Thymus
- PMID: 34996838
- PMCID: PMC8982985
- DOI: 10.4049/jimmunol.2100975
Bcl-2 Is Necessary to Counteract Bim and Promote Survival of TCRαβ+CD8αα+ Intraepithelial Lymphocyte Precursors in the Thymus
Abstract
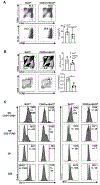
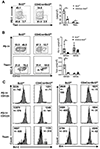
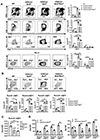
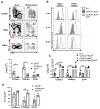
The precursors of TCRαβ+CD8αα+ intraepithelial lymphocytes (IEL) arise in the thymus through a complex process of agonist selection. We and others have shown that the proapoptotic protein, Bim, is critical to limit the number of thymic IEL precursors (IELp), as loss of Bim at the CD4+CD8+ double-positive stage of development drastically increases IELp. The factors determining this cell death versus survival decision remain largely unknown. In this study, we used CD4CreBcl2f/f mice to define the role of the antiapoptotic protein Bcl-2 and CD4CreBcl2f/fBimf/f mice to determine the role of Bcl-2 in opposing Bim to promote survival of IELp. First, in wild-type mice, we defined distinct subpopulations within PD-1+CD122+ IELp, based on their expression of Runx3 and α4β7. Coexpression of α4β7 and Runx3 marked IELp that were most dependent upon Bcl-2 for survival. Importantly, the additional loss of Bim restored Runx3+α4β7+ IELp, showing that Bcl-2 antagonizes Bim to enable IELp survival. Further, the loss of thymic IELp in CD4CreBcl2f/f mice also led to a dramatic loss of IEL in the gut, and the additional loss of Bim restored gut IEL. The loss of gut IEL was due to both reduced seeding by IELp from the thymus as well as a requirement for Bcl-2 for peripheral IEL survival. Together, these findings highlight subset-specific and temporal roles for Bcl-2 in driving the survival of TCRαβ+CD8αα+ IEL and thymic IELp.
Copyright © 2022 by The American Association of Immunologists, Inc.
Figures


Similar articles
-
Destined for the intestine: thymic selection of TCRαβ CD8αα intestinal intraepithelial lymphocytes.Clin Exp Immunol. 2023 Jul 5;213(1):67-75. doi: 10.1093/cei/uxad049. Clin Exp Immunol. 2023. PMID: 37137518 Free PMC article. Review.
-
c-Myc controls the development of CD8alphaalpha TCRalphabeta intestinal intraepithelial lymphocytes from thymic precursors by regulating IL-15-dependent survival.Blood. 2010 Jun 3;115(22):4431-8. doi: 10.1182/blood-2009-11-254698. Epub 2010 Mar 22. Blood. 2010. PMID: 20308599
-
BCL6 is required for the thymic development of TCRαβ+CD8αα+ intraepithelial lymphocyte lineage.Sci Immunol. 2024 Sep 2;9(92):eadk4348. doi: 10.1126/sciimmunol.adk4348. Epub 2024 Feb 9. Sci Immunol. 2024. PMID: 38335269
-
Thymic progenitors of TCRαβ+ CD8αα intestinal intraepithelial lymphocytes require RasGRP1 for development.J Exp Med. 2017 Aug 7;214(8):2421-2435. doi: 10.1084/jem.20170844. Epub 2017 Jun 26. J Exp Med. 2017. PMID: 28652304 Free PMC article.
-
Development, ontogeny, and maintenance of TCRαβ+ CD8αα IEL.Curr Opin Immunol. 2019 Jun;58:83-88. doi: 10.1016/j.coi.2019.04.010. Epub 2019 May 28. Curr Opin Immunol. 2019. PMID: 31146182 Free PMC article. Review.
Cited by
-
The ER-Mitochondria Interface as a Dynamic Hub for T Cell Efficacy in Solid Tumors.Front Cell Dev Biol. 2022 Apr 27;10:867341. doi: 10.3389/fcell.2022.867341. eCollection 2022. Front Cell Dev Biol. 2022. PMID: 35573704 Free PMC article. Review.
-
Notch Inhibitors and BH3 Mimetics in T-Cell Acute Lymphoblastic Leukemia.Int J Mol Sci. 2024 Nov 29;25(23):12839. doi: 10.3390/ijms252312839. Int J Mol Sci. 2024. PMID: 39684550 Free PMC article. Review.
-
Destined for the intestine: thymic selection of TCRαβ CD8αα intestinal intraepithelial lymphocytes.Clin Exp Immunol. 2023 Jul 5;213(1):67-75. doi: 10.1093/cei/uxad049. Clin Exp Immunol. 2023. PMID: 37137518 Free PMC article. Review.
-
Development and function of natural TCR+ CD8αα+ intraepithelial lymphocytes.Front Immunol. 2022 Dec 7;13:1059042. doi: 10.3389/fimmu.2022.1059042. eCollection 2022. Front Immunol. 2022. PMID: 36569835 Free PMC article. Review.
References
-
- He S, Kahles F, Rattik S, Nairz M, McAlpine CS, Anzai A, Selgrade D, Fenn AM, Chan CT, Mindur JE, Valet C, Poller WC, Halle L, Rotllan N, Iwamoto Y, Wojtkiewicz GR, Weissleder R, Libby P, Fernandez-Hernando C, Drucker DJ, Nahrendorf M, and Swirski FK. 2019. Gut intraepithelial T cells calibrate metabolism and accelerate cardiovascular disease. Nature 566: 115–119. - PMC - PubMed
Publication types
MeSH terms
Substances
Grants and funding
LinkOut - more resources
Full Text Sources
Molecular Biology Databases
Research Materials

