. 2022 Jan 7;5(4):e202101234.
doi: 10.26508/lsa.202101234. Print 2022 Apr.

Cap analysis of gene expression reveals alternative promoter usage in a rat model of hypertension

Affiliations

Cap analysis of gene expression reveals alternative promoter usage in a rat model of hypertension

Sonal Dahale et al. Life Sci Alliance. .

Abstract

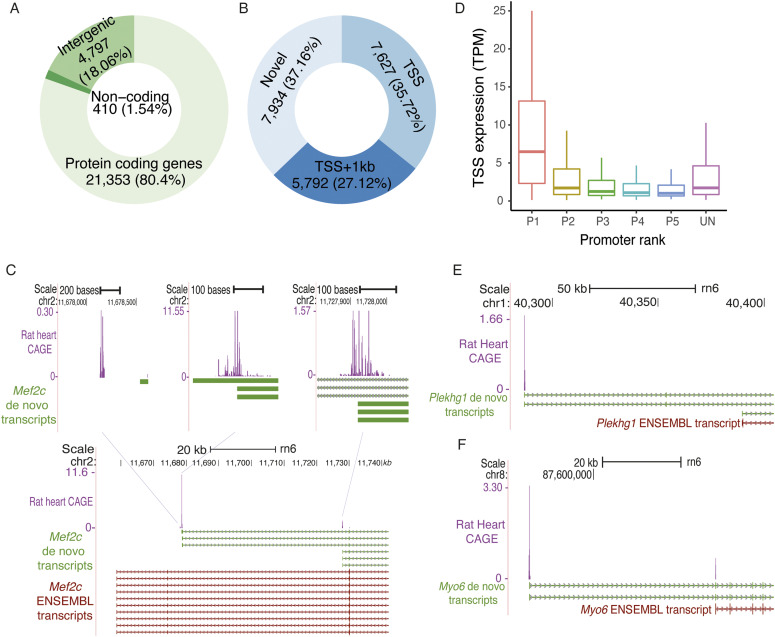
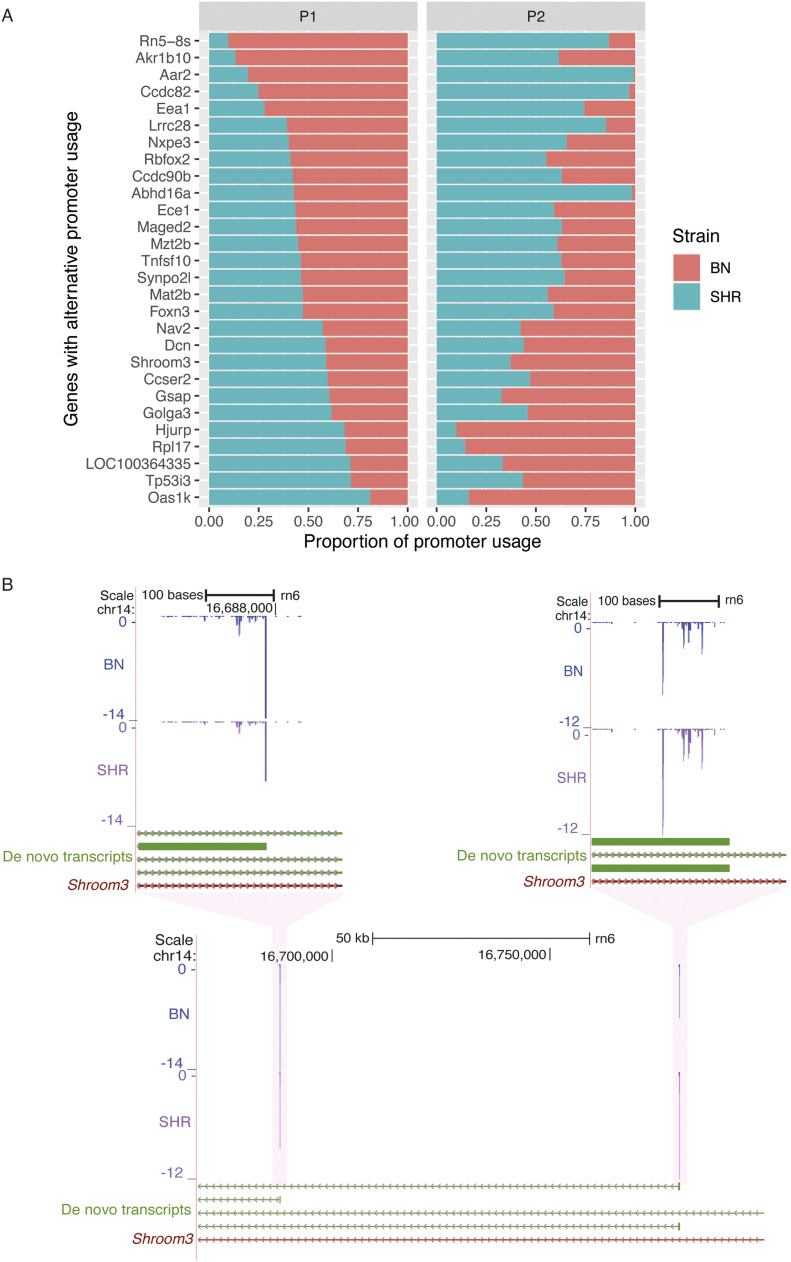
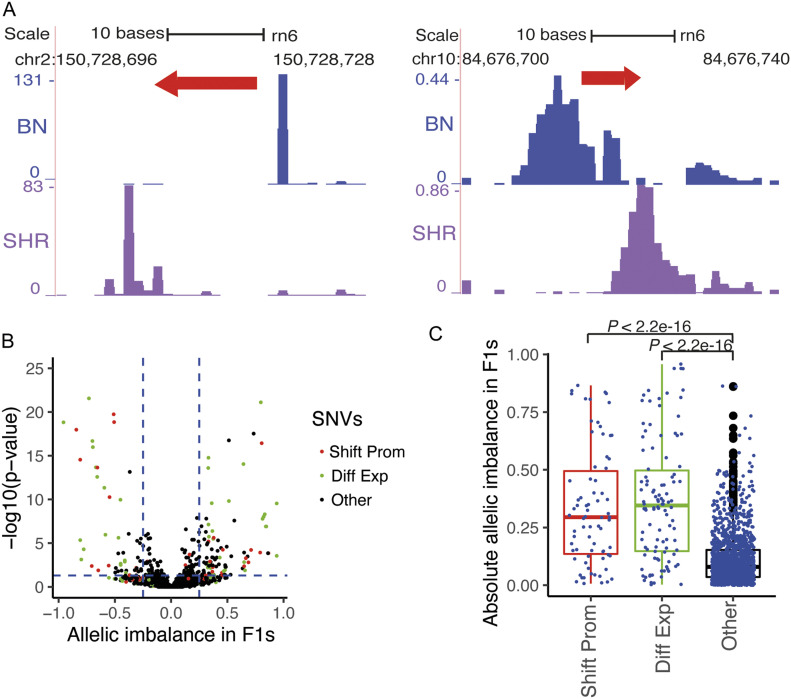
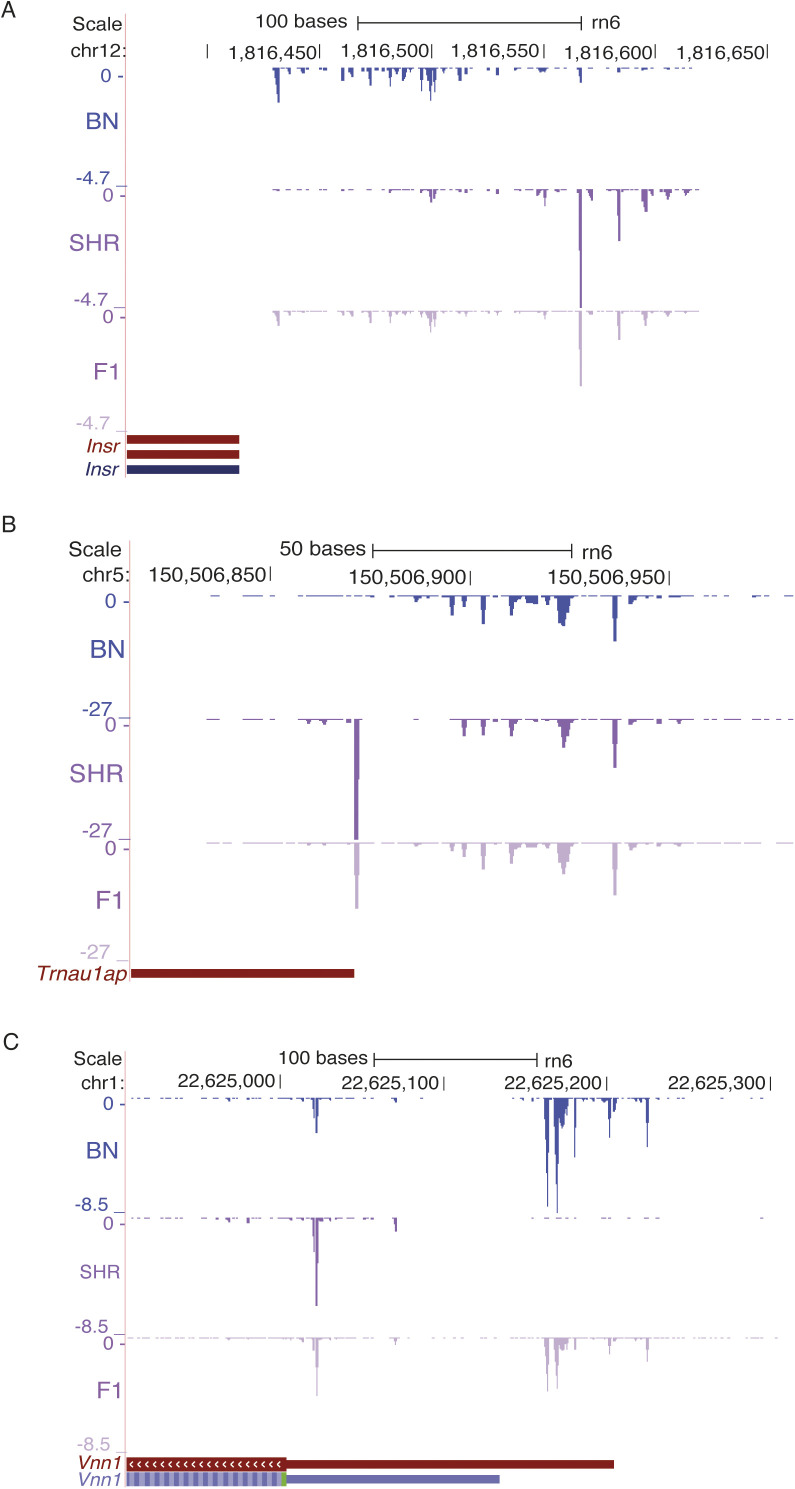
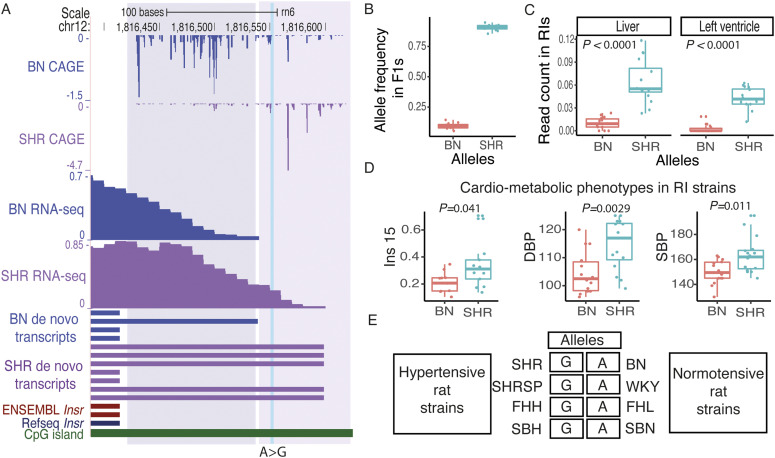
The role of alternative promoter usage in tissue-specific gene expression has been well established; however, its role in complex diseases is poorly understood. We performed cap analysis of gene expression (CAGE) sequencing from the left ventricle of a rat model of hypertension, the spontaneously hypertensive rat (SHR), and a normotensive strain, Brown Norway to understand the role of alternative promoter usage in complex disease. We identified 26,560 CAGE-defined transcription start sites in the rat left ventricle, including 1,970 novel cardiac transcription start sites. We identified 28 genes with alternative promoter usage between SHR and Brown Norway, which could lead to protein isoforms differing at the amino terminus between two strains and 475 promoter switching events altering the length of the 5' UTR. We found that the shift in Insr promoter usage was significantly associated with insulin levels and blood pressure within a panel of HXB/BXH recombinant inbred rat strains, suggesting that hyperinsulinemia due to insulin resistance might lead to hypertension in SHR. Our study provides a preliminary evidence of alternative promoter usage in complex diseases.


Conflict of interest statement

The authors declare that they have no conflict of interest.

Figures

Figure S1.
Figure S1.. Reproducibility of the data.
(A, B, C, D) All possible pairwise correlation between biological replicates for sample (A) Brown Norway (BN) female, (B) BN male, (C) spontaneously hypertensive rat (SHR) female, and (D) SHR male. BN, Brown Norway; SHR, spontaneously hypertensive rat.
Figure 1.
Figure 1.. CAGE tag sequencing identifies promoters from rat left ventricle.
(A) Annotations of the CAGE-defined promoters to genomic features. (B) Classification of CAGE-defined transcription start site located in the gene regions, defined as the region between transcription start and end of the longest transcript of the gene plus 1 kb upstream region, on the same strand as that of the gene. (C) Example of novel heart-specific transcripts for identified using CAGE tag sequencing for gene Mef2c. (D) Distribution of expression levels at promoters by promoter rank including the promoters that are unassigned to any protein-coding gene. (E, F) Examples of novel transcription start site annotations for gene Plekhg1 and Myo6, respectively. Source data are available for this figure.
Figure S2.
Figure S2.. Number of promoters per gene.
Figure S3.
Figure S3.. Characterisation of CAGE-defined tag clusters.
The CAGE-defined tag clusters (TCs) were categorised into three categories: CpG rich, TATA box rich and TCs containing both TTA box and CpG. (A) Length distribution of CpG-rich TCs, TATA box–rich TCs, and the TCs containing both TATA box and CpG. (B) Box plot showing difference in sizes of CpG-rich TCs, TATA box–rich TCs, and the TCs containing both TATA box and CpG.
Figure 2.
Figure 2.. Alternative promoter usage between spontaneously hypertensive rat (SHR) and Brown Norway (BN).
(A) List of genes with alternative promoter usage between SHR and BN. The P1 panel represents the first promoter, whereas the P2 panel represents the second promoter. The x-axis represents the proportion of the promoter used in SHR (green) and the BN (orange). (B) Example of alternative promoter usage between SHR and BN in Shroom3 gene. In SHR Shroom3 is predominantly transcribed from the first promoter, whereas in BN it is predominantly transcribed from the second promoter. The gene Shroom3 is located on a negative-strand hence promoter expression levels have negative values. Source data are available for this figure.
Figure 3.
Figure 3.. Shifting promoters between spontaneously hypertensive rat (SHR) and Brown Norway (BN).
(A) Shift in transcription start site usage within the same promoter happens in both directions with respect to reference BN strain. (B) Allelic imbalance in F1 crosses obtained by crossing SHR and BN. The x-axis represents allelic imbalance. The center (zero) indicates no allelic imbalance between SHR and BN allele in F1. Positive values indicate allelic imbalance towards in reference (BN) allele, whereas negative values indicate allelic imbalance towards SHR allele. The horizontal blue dotted line corresponds to a P-value equal to 0.05, whereas the vertical blue dotted line corresponds to the allelic imbalance of 0.25 and −0.25. The red dots represent variants located in shifting promoters, whereas green dots represent variants in promoters that show differential expression between parental strains (SHR and BN). Black dots represent genomic variants in CAGE-defined promoters that are neither shifting promoters nor differentially expressed between parental strains. (C) Box plot showing the distribution of allelic imbalance in F1 crosses in shifting promoters, differentially expressed promoters, and remaining CAGE-defined promoter regions. Shifting promoters (red box) show significantly (Mann–Whitney test) higher proportion variants with allelic imbalance as compared to non-shifting and non-differentially expressed promoters (black box). Shift Prom: shifting promoters, Diff Exp: differentially expressed promoters in parental strains (SHR and BN), Other: CAGE-defined promoters that are neither shifting promoters nor differentially expressed in parental strains. Source data are available for this figure.
Figure S4.
Figure S4.. Intermediate expression in F1s.
The genes that show shift in transcription start site show intermediate expression at both spontaneously hypertensive rat and Brown Norway promoter. (A, B, C) Illustration of expression in F1 for three genes (A) Insr, (B) Trnau1ap, and (C) Vnn1 that showed promoter shift between spontaneously hypertensive rat and Brown Norway.
Figure 4.
Figure 4.. Shifting promoter in insulin receptor (Insr) gene.
(A) Shifting promoter in Insr. The GAGE tag sequencing identified promoter shift between spontaneously hypertensive rat (SHR) and Brown Norway (BN) strain for Insr gene which leads to longer Insr transcript in SHR as compared with BN. Finding from CAGE was confirmed by RNA-seq data from rat left ventricle (LV) as well as de novo transcript assembly generated using rat LV RNA-seq data. (B) The variant g.1816552:A>G located in SHR specific Insr transcript region shows significant allelic imbalance in F1 crosses with most reads showing the SHR allele in F1s. (C) Based on the genotype at g.1816552:A>G recombinant inbred (RI) strains were grouped into two groups, where AA represents RI strains inheriting BN allele, whereas GG represents RI strains inheriting SHR allele. RNA-seq read count in SHR specific Insr transcript region was normalised to the read count from the first exon of Insr gene using publicly available RNA-seq data from left ventricle and liver in RI strains. Both in the LV and liver, RI strains that inherited SHR allele showed higher normalised reads count suggesting that they harbor longer transcript for Insr gene, whereas RI strains that inherited BN allele use the shorter transcript. (D) RI strains that harbor SHR allele showed significantly higher levels of insulin, systolic, and diastolic blood pressure. (E) Genotype in rat models of hypertension and their control strains at variant (g.1816552:A>G) located in SHR specific Insr transcript region. All hypertensive rat strain contains GG allele, same as SHR, whereas all the normotensive rat strains contain AA allele, same as BN. SHR, spontaneously hypertensive rat; BN, Brown Norway; ins15, insulin concentrations in 10-wk-old male rats fed a diet with 60% fructose from 8 wk to 10 wk (15 d), SBP, systolic blood pressure; DBP, diastolic blood pressure. Source data are available for this figure.

Similar articles

References

    1. Aitman TJ, Critser JK, Cuppen E, Dominiczak A, Fernandez-Suarez XM, Flint J, Gauguier D, Geurts AM, Gould M, Harris PC, et al. (2008) Progress and prospects in rat genetics: A community view. Nat Genet 40: 516–522. 10.1038/ng.147 - DOI - PubMed
    1. Araki E, Shimada F, Fukushima H, Mori M, Shichiri M, Ebina Y (1989) Characterization of the promoter region of the human insulin receptor gene. Diabetes Res Clin Pract 7: S31–S33. 10.1016/0168-8227(89)90085-5 - DOI - PubMed
    1. Atanur SS, Birol I, Guryev V, Hirst M, Hummel O, Morrissey C, Behmoaras J, Fernandez-Suarez XM, Johnson MD, McLaren WM, et al. (2010) The genome sequence of the spontaneously hypertensive rat: Analysis and functional significance. Genome Res 20: 791–803. 10.1101/gr.103499.109 - DOI - PMC - PubMed
    1. Atanur SS, Diaz AG, Maratou K, Sarkis A, Rotival M, Game L, Tschannen MR, Kaisaki PJ, Otto GW, Ma MC, et al. (2013) Genome sequencing reveals loci under artificial selection that underlie disease phenotypes in the laboratory rat. Cell 154: 691–703. 10.1016/j.cell.2013.06.040 - DOI - PMC - PubMed
    1. Ayoubi TA, Van De Ven WJ (1996) Regulation of gene expression by alternative promoters. FASEB J 10: 453–460. 10.1096/fasebj.10.4.8647344 - DOI - PubMed