. 2022 Jan 11;119(2):e2112040119.
doi: 10.1073/pnas.2112040119.

FASN-dependent de novo lipogenesis is required for brain development

Affiliations

FASN-dependent de novo lipogenesis is required for brain development

Daniel Gonzalez-Bohorquez et al. Proc Natl Acad Sci U S A. .

Abstract

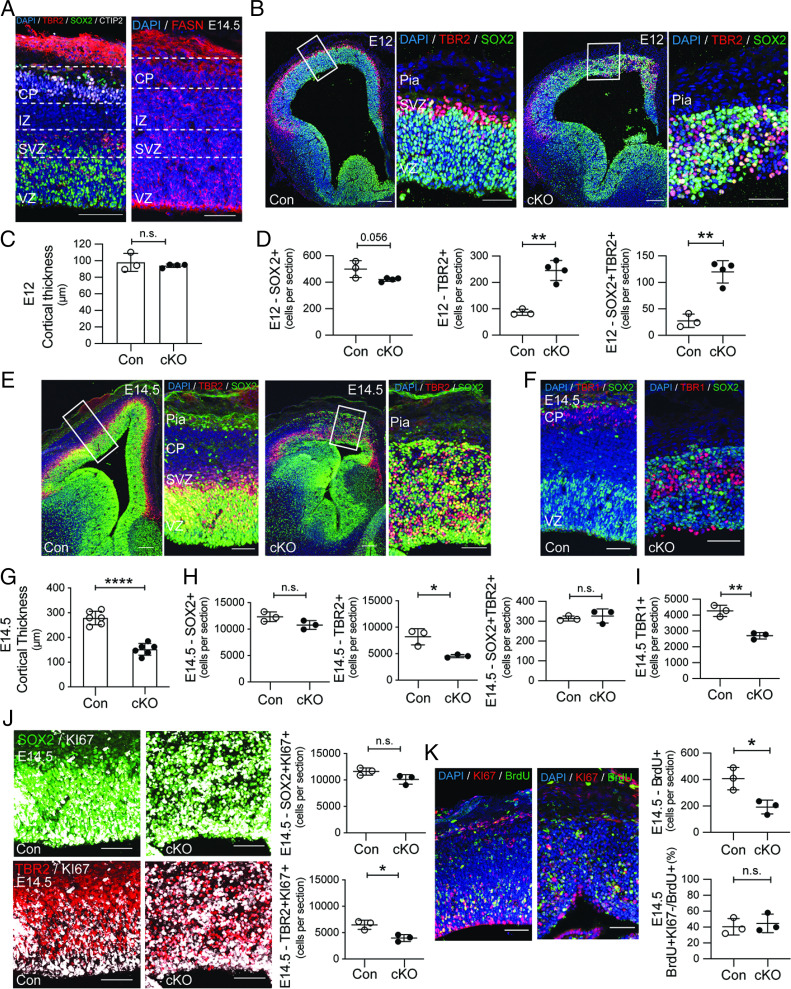
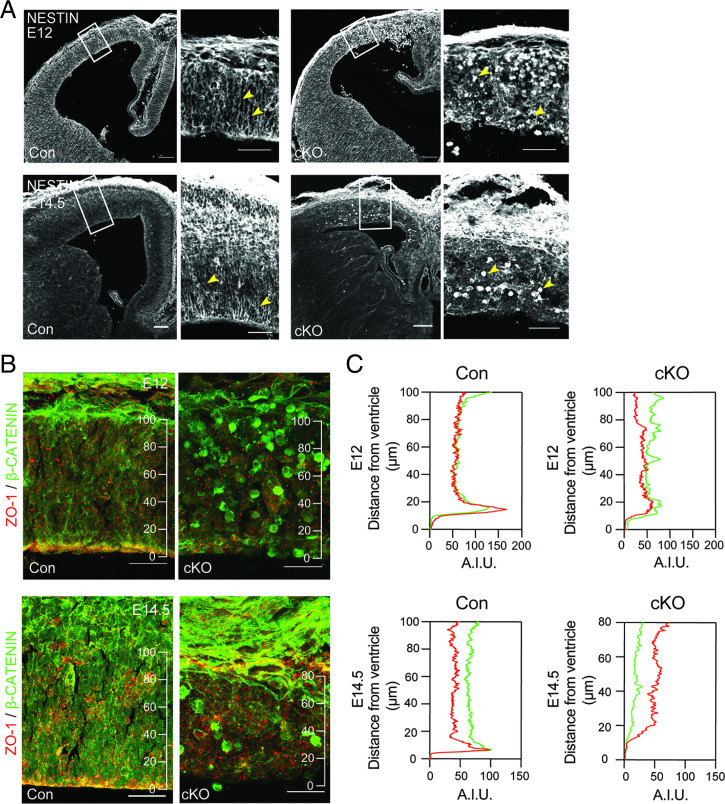
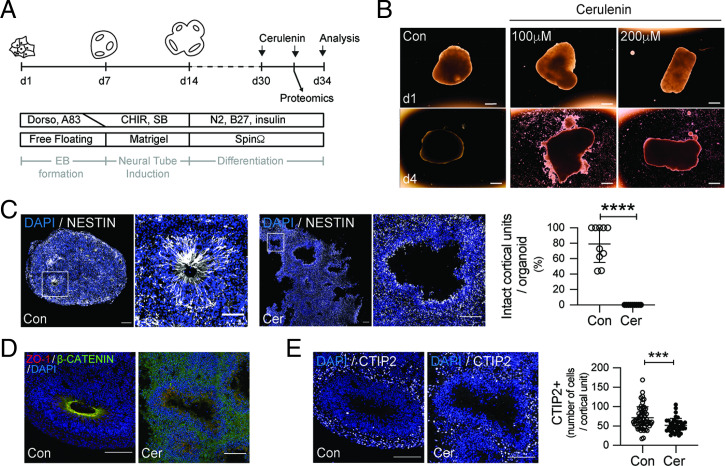
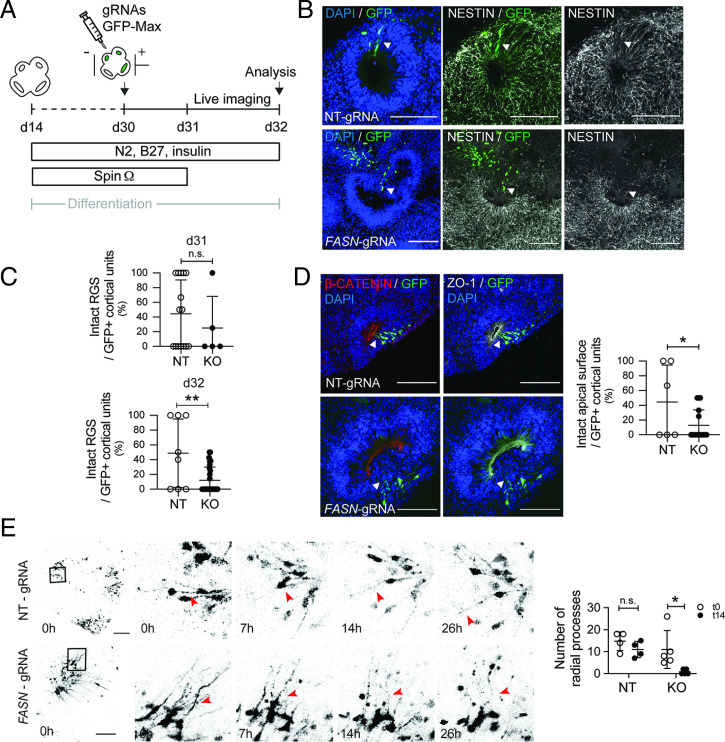
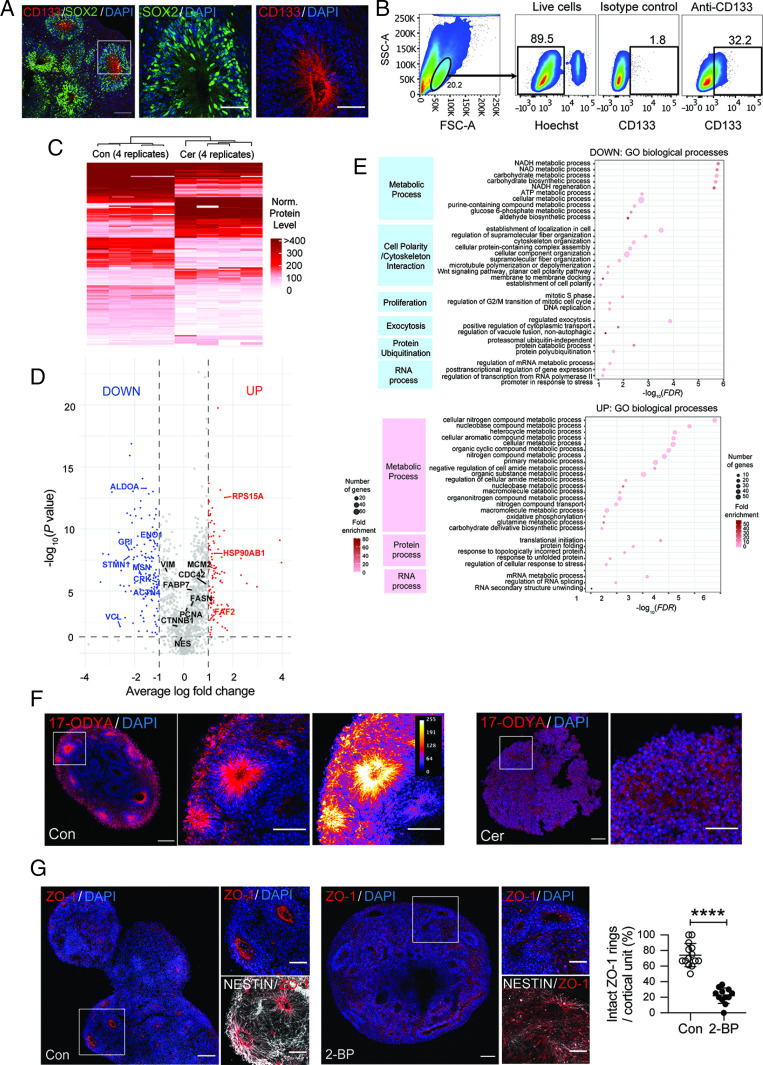
Fate and behavior of neural progenitor cells are tightly regulated during mammalian brain development. Metabolic pathways, such as glycolysis and oxidative phosphorylation, that are required for supplying energy and providing molecular building blocks to generate cells govern progenitor function. However, the role of de novo lipogenesis, which is the conversion of glucose into fatty acids through the multienzyme protein fatty acid synthase (FASN), for brain development remains unknown. Using Emx1Cre-mediated, tissue-specific deletion of Fasn in the mouse embryonic telencephalon, we show that loss of FASN causes severe microcephaly, largely due to altered polarity of apical, radial glia progenitors and reduced progenitor proliferation. Furthermore, genetic deletion and pharmacological inhibition of FASN in human embryonic stem cell-derived forebrain organoids identifies a conserved role of FASN-dependent lipogenesis for radial glia cell polarity in human brain organoids. Thus, our data establish a role of de novo lipogenesis for mouse and human brain development and identify a link between progenitor-cell polarity and lipid metabolism.

Keywords: lipogenesis; neural stem cell; neurogenesis; polarity.


Conflict of interest statement

The authors declare no competing interest.

Figures

Fig. 1.
Fig. 1.
FASN is required for mouse cortex development. (A) Structure of the E14.5 developing mouse cortex with APs (SOX2, green), BPs (TBR2, red), and neurons (CTIP2, white). The right panel shows FASN expression (red) at E14.5. Dashed lines demarcate different layers of the developing cortex. (B) Compared to control (Con) mice (Left), FASN-cKO causes severe disorganization of the cortical wall at E12 and premature differentiation of SOX2-labeled progenitors (green) into TBR2-labeled (red) progenitors. Boxed areas are zoomed in. (C) The bar graph shows quantification of cortical thickness at E12. (D) Quantifications of the number of SOX2- and TBR2-labeled cells at E12. (E) At E14.5, FASN-cKO mice show microcephaly and disorganization within the cortical wall of SOX2-labeled (green) progenitors and TBR2-labeled (red) progenitors. Additionally, FASN-cKO mice show a reduction in number of TBR2-positive cells. Boxed areas are zoomed in. (F) TBR1-labeled neurons (red) are reduced and abnormally localized within the cortical wall compared to control (Left) at E14.5. APs are labeled with SOX2 (green). (G) The bar graph shows quantification of cortical thickness at E14.5. (H) Quantifications of the number of SOX2- and TBR2-labeled cells at E14.5. (I) Quantifications of TBR1-labeled neurons at E14.5. (J) FASN deletion causes reduced proliferation (KI67, white) of TBR2-labeled BPs (red) with SOX2-expressing (green) progenitor proliferation being not significantly affected. The bar graphs show quantifications of KI67-labeled cell-expression SOX2 (Top) and TBR2 (Bottom) at E14.5. (K) Retention of BrdU (green) is reduced in FASN-cKO mice 24 h after injection. However, cell-cycle exit and reentry, measured by BrdU and KI67 (red) colabeled cells, is not different between FASN-cKO and controls. The bar graphs show quantifications of BrdU (Top) and the percentage of BrdUKI67-labeled cells over total BrdU cells (Bottom) at E14.5. IZ, intermediate zone. Values are reported as mean ± SD; n.s., nonsignificant; *P < 0.05; **P < 0.005; and ****P < 0.0005 by unpaired t test; each data point depicts one embryo. (Scale bars, 100 µm in main panels and 50 μm in zoomed panels.)
Fig. 2.
Fig. 2.
FASN deletion disrupts progenitor-cell polarity. (A) Analysis of the intermediate filament Nestin (white), labeling the radial glia scaffold, shows disorganization of the embryonic cortex at E12 (top row of panels) and E14.5 (bottom row of panels). Boxed areas are zoomed in. Arrowheads point toward radial processes extending from APs in control and collapsed process in Fasn-cKO animals. (Scale bars, 100 μm in main panels and 50 μm in zoomed panels.) (B) Expression of proteins associated with adherens junctions and cell polarity (ZO-1, red; β-catenin, green) shows disrupted polarity at E12 (Top) and E14.5 (Bottom) in the developing cortex. (C) Shown are intensity profiles (measured in A.I.U.; arbitrary intensity units) of ZO-1 and β-catenin throughout the cortical wall with distance from the ventricle. Note the enriched signal of ZO-1 and β-catenin in close proximity to the ventricle that is lost upon FASN deletion. (Scale bars, 25 µm.)
Fig. 3.
Fig. 3.
FASN regulates development of human forebrain organoids. (A) A schematic showing the strategy to generate hESC-derived forebrain organoids and experimental outline of FASN pharmacological inhibition using the FASN inhibitor Cer. (B) Bright-field images of d30 forebrain organoids after 4 d of treatment with vehicle (Con) or Cer. Note the disruption of tissue integrity upon FASN inhibition. (Scale bars, 1 mm.) (C) Radial glia scaffold (Nestin, white) assessment in cortical units from control and Cer-treated organoids. Boxed areas are zoomed in (Right). Quantification of the percentage of intact cortical units in analyzed organoids. (D) Cell-polarity (ZO-1, red; β-catenin, green; in lower panels) assessment in cortical units from control and Cer-treated organoids. (E) FASN inhibition causes reduced neurogenesis, as measured by quantifying the number of CTIP2-labeled neurons (white) per cortical unit. All analyses were done comparing control and Cer 200 µM. CHIR, CHIR-99021; EB, embryoid body; Dorso, dorsomorphin; SB, SB-431542. Values are reported as mean ± SD; ***P < 0.001 and ****P < 0.0005 by unpaired t test; each data point depicts an organoid in C and a cortical unit in D. (Scale bars, 100 µm in main panels and 50 µm in zoomed panels.)
Fig. 4.
Fig. 4.
Genetic ablation of FASN in forebrain organoids affects polarity of human progenitors. (A) A schematic showing the design of in organoid electroporation and live-imaging experiments. (B) Radial glia scaffold (RGS; Nestin, white) integrity assessment in cortical units targeted with control or FASN-KO gRNAs (visualized using GFP, green). Note disruption of the radial scaffold in FASN-targeted areas. Arrowheads point toward examples of electroporated cells. (Scale bars, 50 µm.) (C) Quantification of the percentage of intact electroporated cortical units 24 h (d31) and 50 h (d32) after electroporation. (D) Cell-polarity (β-catenin, red; ZO-1, white) integrity assessment in cortical units targeted with control or FASN-KO gRNAs, revealing impaired integrity of cortical units upon FASN deletion. Arrowheads point toward examples of electroporated cells. (Scale bars, 50 µm.) (E) Time course of cortical units with GFP-labeled APs with visible radial processes and quantification of remaining processes after 26 h of imaging. Note the collapse of radial processes upon FASN deletion (red arrowheads) compared to electroporated control cells. Boxed areas are zoomed in (Right). The bar graph shows quantification of intact organoids at the beginning of imaging (t0 = 24 h after electroporation) and at the end of imaging (50 h after electroporation, 26 h after beginning of imaging). Arrowheads point toward radial processes from GFP+ cells. (Scale bars, 25 µm.) NT, nontargeting guide RNA; KO, FASN knock out guide RNAs. Values are reported as mean ± SD; n.s., not-significant; *P < 0.05; **P < 0.005; unpaired t test; each data point depicts an organoid in C and D and an imaged cortical unit in E.
Fig. 5.
Fig. 5.
Inhibition of FASN alters the proteome of neural progenitors. (A) Immunofluorescent analyses showing the expression of CD133 (red) in human neural stem/progenitor cells (NSPCs) (labeled with SOX2 in green). (Scale bars, 50 µm.) (B) FACS plots showing CD133+ population within whole wild-type organoids. (C) Heatmap comparing differentially expressed proteins between control and Cer-treated CD133-sorted NSPCs from MS analysis. (D) Volcano plot showing differentially expressed proteins. (E) GO term selection (biological process) for down- and up-regulated proteins. Dot size represents the number of proteins included in the term; shading represents the fold enrichment compared to the whole proteome. Only GO terms with FDR (false discovery rate) <0.01 were selected and redundancy trimmed. (F) Enrichment of palmitoylated proteins in the apical domain of cortical units in control samples compared to Cer-treated organoids, as shown by 17-ODYA labeling (red). The right panel shows false-colored, scaled-intensity measurements. (Scale bars, 100 µm in main panels and 50 µm in zoomed panels.) (G) Inhibition of palmitoylation by 2-BP treatment causes loss of cell polarity, as measured by ZO-1 localization. (Scale bars, 100 µm in main panels and 50 µm in zoomed panels.) Values are reported as mean ± SD; ****P < 0.0005; unpaired t test; each data point depicts an organoid.

Similar articles

Cited by

References

    1. Blockus H., Polleux F., Developmental mechanisms underlying circuit wiring: Novel insights and challenges ahead. Curr. Opin. Neurobiol. 66, 205–211 (2021). - PMC - PubMed
    1. Bonnefont J., Vanderhaeghen P., Neuronal fate acquisition and specification: Time for a change. Curr. Opin. Neurobiol. 66, 195–204 (2021). - PMC - PubMed
    1. Taverna E., Götz M., Huttner W. B., The cell biology of neurogenesis: Toward an understanding of the development and evolution of the neocortex. Annu. Rev. Cell Dev. Biol. 30, 465–502 (2014). - PubMed
    1. Oberst P., Agirman G., Jabaudon D., Principles of progenitor temporal patterning in the developing invertebrate and vertebrate nervous system. Curr. Opin. Neurobiol. 56, 185–193 (2019). - PubMed
    1. Miller D. J., Bhaduri A., Sestan N., Kriegstein A., Shared and derived features of cellular diversity in the human cerebral cortex. Curr. Opin. Neurobiol. 56, 117–124 (2019). - PMC - PubMed

Publication types

LinkOut - more resources