. 2022 Jan 11;119(2):e2114994119.
doi: 10.1073/pnas.2114994119.

Structural transitions in the GTP cap visualized by cryo-electron microscopy of catalytically inactive microtubules

Affiliations

Structural transitions in the GTP cap visualized by cryo-electron microscopy of catalytically inactive microtubules

Benjamin J LaFrance et al. Proc Natl Acad Sci U S A. .

Abstract

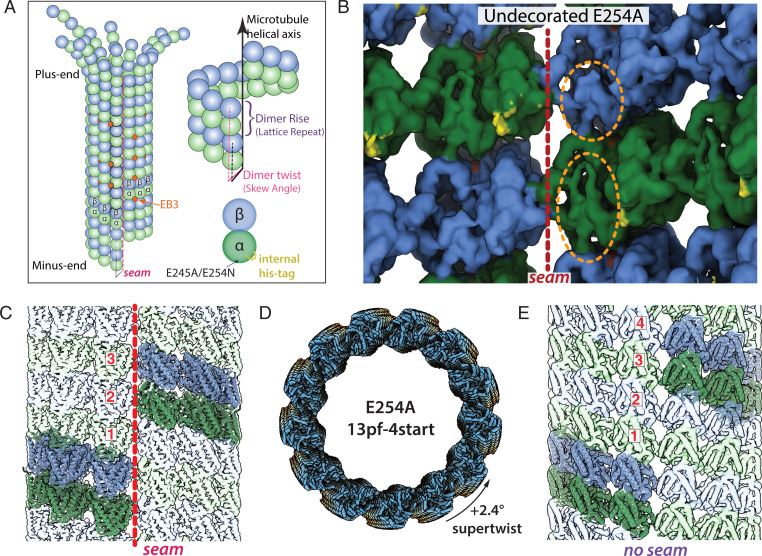
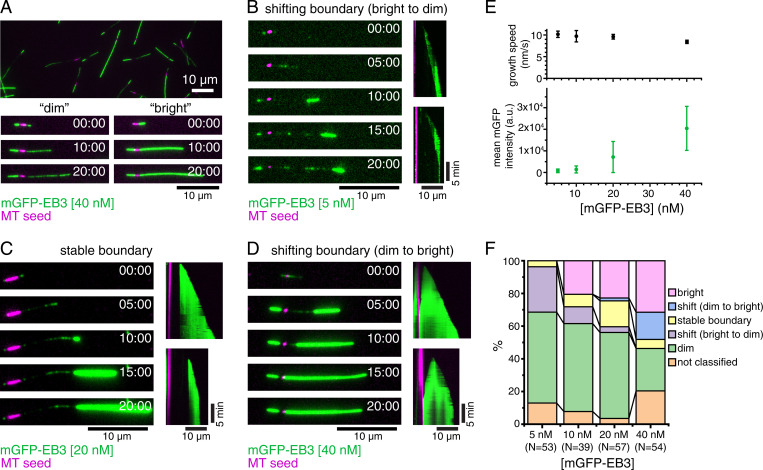
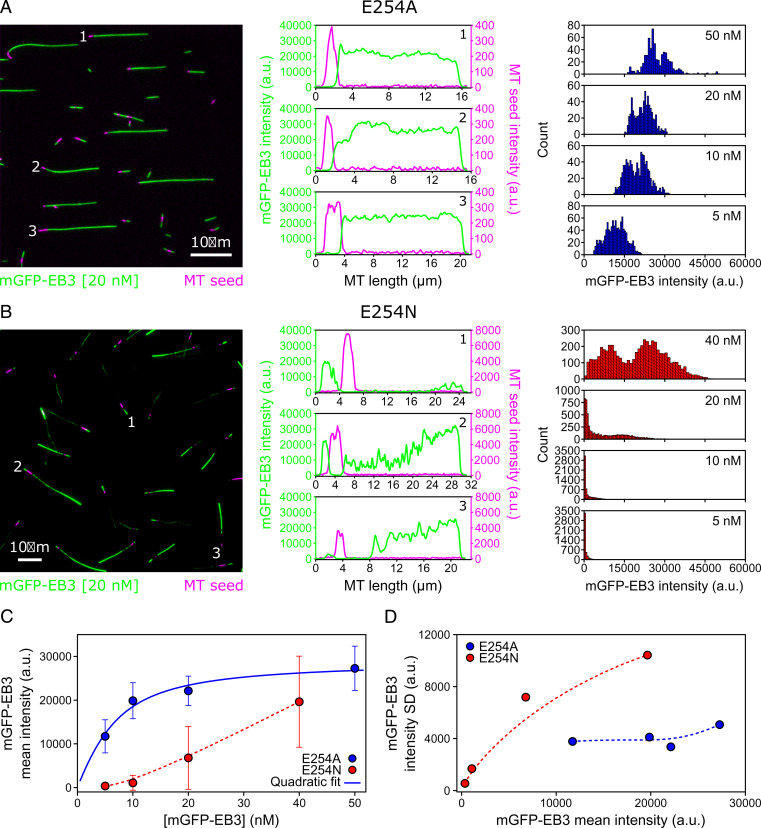
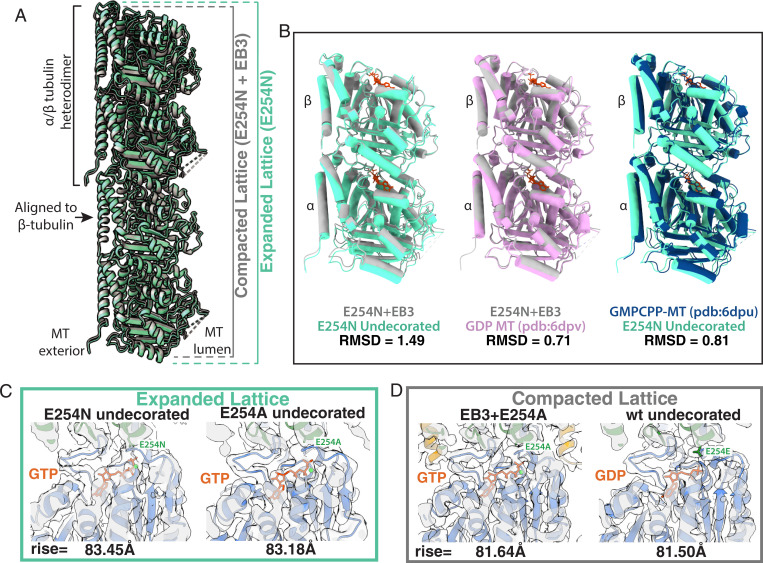
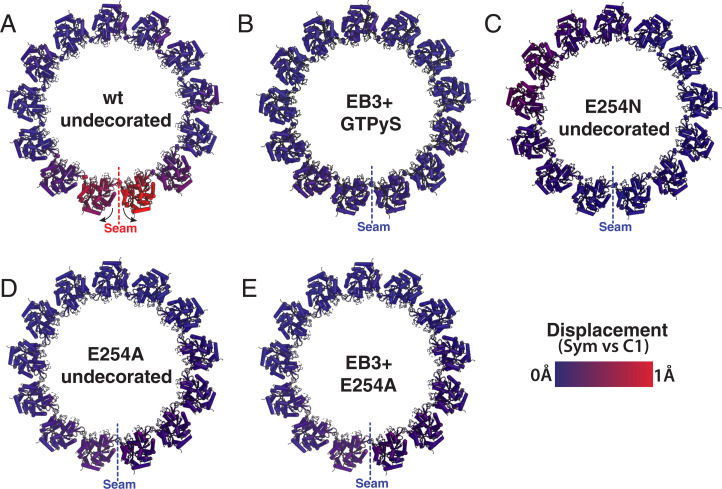
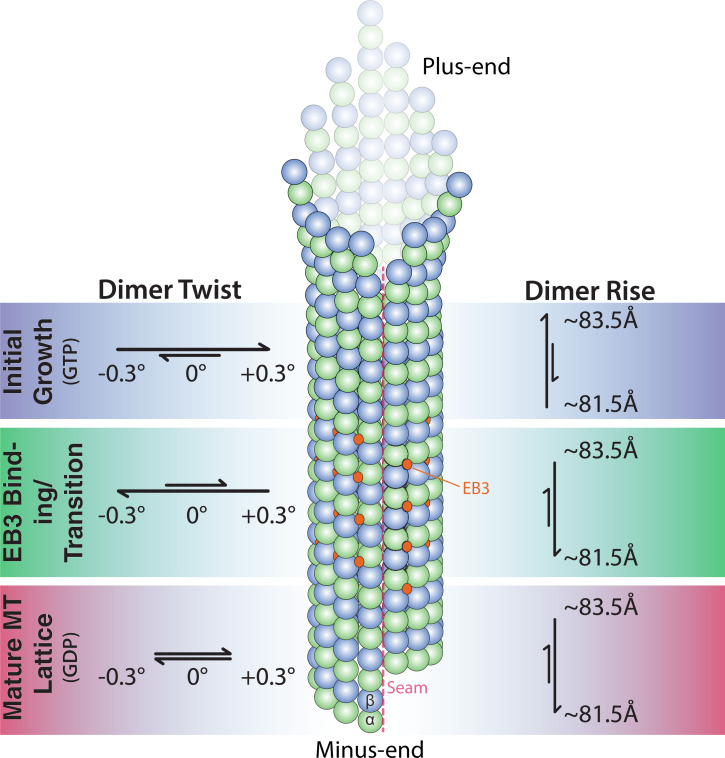
Microtubules (MTs) are polymers of αβ-tubulin heterodimers that stochastically switch between growth and shrinkage phases. This dynamic instability is critically important for MT function. It is believed that GTP hydrolysis within the MT lattice is accompanied by destabilizing conformational changes and that MT stability depends on a transiently existing GTP cap at the growing MT end. Here, we use cryo-electron microscopy and total internal reflection fluorescence microscopy of GTP hydrolysis-deficient MTs assembled from mutant recombinant human tubulin to investigate the structure of a GTP-bound MT lattice. We find that the GTP-MT lattice of two mutants in which the catalytically active glutamate in α-tubulin was substituted by inactive amino acids (E254A and E254N) is remarkably plastic. Undecorated E254A and E254N MTs with 13 protofilaments both have an expanded lattice but display opposite protofilament twists, making these lattices distinct from the compacted lattice of wild-type GDP-MTs. End-binding proteins of the EB family have the ability to compact both mutant GTP lattices and to stabilize a negative twist, suggesting that they promote this transition also in the GTP cap of wild-type MTs, thereby contributing to the maturation of the MT structure. We also find that the MT seam appears to be stabilized in mutant GTP-MTs and destabilized in GDP-MTs, supporting the proposal that the seam plays an important role in MT stability. Together, these structures of catalytically inactive MTs add mechanistic insight into the GTP state of MTs, the stability of the GTP- and GDP-bound lattice, and our overall understanding of MT dynamic instability.

Keywords: GTP; TIRF microscopy; cryo-EM; dynamic instability; microtubules.


Conflict of interest statement

The authors declare no competing interest.

Figures

Fig. 1.
Fig. 1.
Structural characterization of E254A MTs. (A) Cartoon diagram of a 13-pf 3-start MT undergoing depolymerization, with α-tubulin in green, β-tubulin in blue, and EB3 in orange (colors maintained throughout). Also shown are the dimer rise and dimer twist (or skew angle) of the MT lattice, in which rise denotes the distance (in angstroms) from one tubulin dimer to the one directly above it, and twist is the angle around the MT helical axis that must occur going from one dimer to the one above. (B) View of tubulin dimers from the lumen, in which orange ovals highlight distinctive features of the α- and β-tubulin subunits, and the red dashed line denotes the seam for E254A MTs. The small region highlighted in yellow corresponds to additional density in the recombinant sample that can be assigned to the internal His6-tag. (C) A representative 13-pf 3-start MT (in this case, E254A at 3.4-Å resolution). The same generic architecture was observed for wt and E254N MTs (though with subtle differences in lattice parameters). (D) Subclassification of the 13-pf E254A dataset revealed a subset of 13-pf 4-start MTs, here shown colored blue-yellow-orange along the MT axis. (E) Lateral view of 13-pf 4-start MTs showing the absence of a seam in the MT lattice (map at 3.7 Å resolution). In C and E, one helical layer of tubulin dimers is highlighted and the corresponding ribbon diagrams docked into those dimers to emphasize the difference between the two lattices.
Fig. 2.
Fig. 2.
Dynamic E254N MTs observed by TIRF microscopy. (A) TIRF microscopy image of nonfluorescent E254N MTs after 20 min of growth from CF640R-labeled, GMPCPP-stabilized MT “seeds” (magenta) in the presence of 40 nM mGFP-EB3 (green) and GTP showing a variety of “dimly” and “brightly” mGFP-EB3-decorated MTs. (Bottom) Time series of growth of a “dim” and “bright” MT. (BD) Time series and kymographs exemplifying MT growth behavior: (B) MT showing a switch from “dim” to “bright” lattice at the growing plus end, followed by progressive conversion of the lattice at the boundary to the “dim” state, causing the boundary to move toward the growing plus end (5 nM mGFP-EB3). (C) Once this MT switches into a “bright” binding state at the growing plus end, the boundary between the “dim” and the “bright” lattice does not change (20 nM mGFP-EB3). (D) Once this MT switches to the “bright” state, the “dim” lattice progressively switches at the boundary toward the seed, until the MT is entirely “bright” (40 nM mGFP-EB3). (E, Top) Mean E254N MT plus-end growth speed for the different mGFP-EB3 concentrations studied. Error bars represent SEs. The numbers of MTs and segments of constant speed used in the calculation for each mGFP-EB3 concentration are the folowing: 5 nM mGFP-EB3, 42 MTs, and 109 segments; 10 nM mGFP-EB3, 30 MTs, and 74 segments; 20 nM mGFP-EB3, 50 MTs, and 169 segments; and 40 nM mGFP-EB3, 42 MTs, and 124 segments). (Bottom) Mean fluorescence intensity of mGFP-EB3 binding to MTs for each mGFP-EB3 concentration. Error bars represent SDs. Intensity data are replotted in Fig. 3C. (F) Stacked bar chart of MT growth behavior at different mGFP-EB3 concentrations. mGFP-EB3 binding patterns were assessed manually by comparing to the other MTs in the same field of view. “Dim” and “bright” MTs showed relatively uniform binding throughout growth. Some MTs could not be clearly classified into any category. Only the parts of the MTs growing from the plus end of stabilized MT seeds were included in the analysis reported. N indicates the number of MTs considered for analysis from two different experimental replica (three for 20 nM mGFP-EB3). All experiments were performed with 12.5 µM E254N tubulin. (Scale bars, 10 µm for length and 5 min for time.)
Fig. 3.
Fig. 3.
Quantitative comparison of mGFP-EB3 binding to E254A and E254N MTs as observed by TIRF microscopy. (A and B, Left) TIRF microscopy images of nonfluorescent E254A MTs (A) and E254N MTs (B) grown from CF640R-labeled, GMPCPP-stabilized “seeds” (magenta) in the presence of 20 nM mGFP-EB3 (green) and GTP. (Scale bars, 10 µm.) (Middle) Line profiles of mGFP-EB3 (green) and MT seed (magenta) intensities along the three MTs indicated in the images on the Left. (Right) Global mGFP-EB3 intensity distribution along several MTs at different mGFP-EB3 concentrations (E254A MTs: 5 nM mGFP-EB3, n = 18 MTs; 10 nM mGFP-EB3, n = 13 MTs; 20 nM mGFP-EB3, n = 10 MTs; and 50 nM mGFP-EB3, n = 11 MTs; E254N MTs: 5 nM mGFP-EB3, n = 35 MTs; 10 nM mGFP-EB3, n = 37 MTs; 20 nM mGFP-EB3, n = 43 MTs; and 40 nM mGFP-EB3, n = 38 MTs). (C) Mean intensity of mGFP-EB3 along E254A MTs (blue circles) and E254N MTs (red circles; same data as in Fig. 2 E, Bottom) as a function of mGFP-EB3 concentration. Error bars represent SDs. The solid blue line shows a quadratic fit through the E254A MT data, and the red dashed line is a Bezier interpolation used as guide-to-the-eye. (D) SD of mGFP-EB3 intensity along the MTs as a function of mGFP-EB3 mean intensity for E254A MTs (blue circles) and E254N MTs (red circles). Dashed lines are Bezier interpolations used as guide-to-the-eye.
Fig. 4.
Fig. 4.
GTP state and compaction for wt, E254N, and E254A MTs. (A) Visualization of how the MT axial repeat changes, either through hydrolysis of GTP or through EB3 binding to catalytically inactive MTs. Specifically, the panel shows atomic models for the structures determined herein, with the undecorated E254N MT shown in green and E254N+EB3 MT in gray. (B) Comparison of tubulin heterodimers to show the structural changes that occur upon compaction. Dimers are aligned onto β-tubulin, which has been shown to undergo the least amount of conformational changes in previous studies and herein. RMSD values are reported below each comparison. (C) Expanded lattices, with a rise >83 Å and with clear GTP density. Shown here as examples of expanded lattices for undecorated E254N (3.8 Å) and undecorated E254A (3.4 Å) maps. (D) Compacted lattices with a rise <82 Å can be formed by EB3 binding (while maintaining GTP) or by hydrolysis into the GDP state. Examples for the compacted lattices observed are EB3+E254A (3.5 Å) and the undecorated wt lattice (3.8 Å).
Fig. 5.
Fig. 5.
Seam opening correlates with GTP hydrolysis and MT instability. The panels correspond to MT cross-sections for both GTP-like and GDP-MTs showing comparison between the symmetrized and C1 maps to illustrate the break of symmetry with the opening between pfs at the seam for some of the MTs studied. (A) Wt MTs in a posthydrolysis state show the seam-opening phenomenon localized to the pfs at the seam. Movie S4 allows for a dynamic visualization of this motion. (B) GTPγS copolymerized with EB3 originally from data collected for the map deposited as EMD-6347 (8). (C) Undecorated E254N MTs. (D) Undecorated E254A MTs. (E) The E254A MT copolymerized with EB3. No seam opening is seen for B, C, D, or E.
Fig. 6.
Fig. 6.
Model of MT growth informed by cryo-EM and TIRF microscopy observations.

Similar articles

Cited by

References

    1. Brouhard G. J., Rice L. M., Microtubule dynamics: An interplay of biochemistry and mechanics. Nat. Rev. Mol. Cell Biol. 19, 451–463 (2018). - PMC - PubMed
    1. Drechsel D. N., Kirschner M. W., The minimum GTP cap required to stabilize microtubules. Curr. Biol. 4, 1053–1061 (1994). - PubMed
    1. Howard J., Hyman A. A., Growth, fluctuation and switching at microtubule plus ends. Nat. Rev. Mol. Cell Biol. 10, 569–574 (2009). - PubMed
    1. Mitchison T., Kirschner M., Dynamic instability of microtubule growth. Nature 312, 237–242 (1984). - PubMed
    1. Alushin G. M., et al. , High-resolution microtubule structures reveal the structural transitions in αβ-tubulin upon GTP hydrolysis. Cell 157, 1117–1129 (2014). - PMC - PubMed

Publication types