. 2022 Jan 7;12(1):77.
doi: 10.1038/s41598-021-03471-w.

High BRCA1 gene expression increases the risk of early distant metastasis in ER+ breast cancers

Affiliations

High BRCA1 gene expression increases the risk of early distant metastasis in ER+ breast cancers

Hui-Ju Chang et al. Sci Rep. .

Abstract

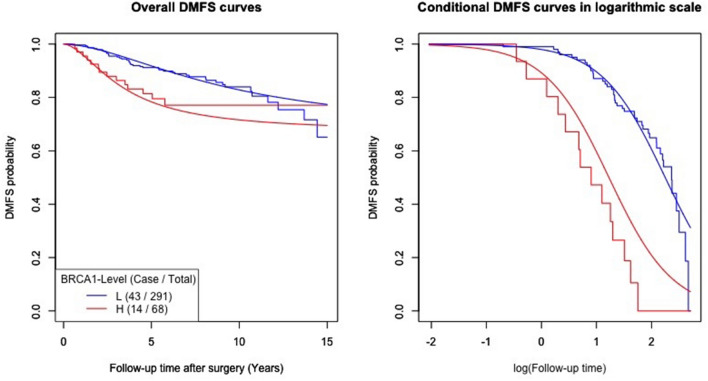
Although the function of the BRCA1 gene has been extensively studied, the relationship between BRCA1 gene expression and tumor aggressiveness remains controversial in sporadic breast cancers. Because the BRCA1 protein is known to regulate estrogen signaling, we selected microarray data of ER+ breast cancers from the GEO public repository to resolve previous conflicting findings. The BRCA1 gene expression level in highly proliferative luminal B tumors was shown to be higher than that in luminal A tumors. Survival analysis using a cure model indicated that patients of early ER+ breast cancers with high BRCA1 expression developed rapid distant metastasis. In addition, the proliferation marker genes MKI67 and PCNA, which are characteristic of aggressive tumors, were also highly expressed in patients with high BRCA1 expression. The associations among high BRCA1 expression, high proliferation marker expression, and high risk of distant metastasis emerged in independent datasets, regardless of tamoxifen treatment. Tamoxifen therapy could improve the metastasis-free fraction of high BRCA1 expression patients. Our findings link BRCA1 expression with proliferation and possibly distant metastasis via the ER signaling pathway. We propose a testable hypothesis based on these consistent results and offer an interpretation for our reported associations.


Conflict of interest statement

The authors declare no competing interests.

Figures

Figure 1
Figure 1
Luminal tumors in dataset GSE45827. (A) Boxplot of BRCA1 expression in luminal A and B tumors (p value < 0.001, the Wilcoxon rank sum test), (B) Scatterplot of MKI67 and PCNA expression levels in luminal A and B tumors, (C) Bar graph of luminal A and B tumor numbers in low- or high-BRCA1 groups (left panel: cutoff = median of BRCA1 expression levels, Fisher’s exact p value = 0.019, right panel: cutoff = 8th decile of BRCA1 expression levels, Fisher’s exact p value = 0.021).
Figure 2
Figure 2
Survival curves fitted by the “Logistic-AFT mixture regression model” at the 5th–7th and 9th deciles. Kaplan–Meier (step function) and mixture regression (smooth curve) estimators of overall and conditional DMFS curves for the DM onset time after surgery stratified by BRCA1 level defined at the cutoff points (A) 5th, (B) 6th, (C) 7th, and (D) 9th deciles, and the corresponding p values of the likelihood ratio test (PLRT) were 0.024, 0.023, 0.020 and 0.005, respectively. The BRCA1 high- and low-expression groups are shown in red and in blue, respectively, for each cutoff point.
Figure 3
Figure 3
Survival curves fitted by the “Logistic-AFT mixture regression model” at the 8th decile. Kaplan–Meier (step function) and mixture regression (smooth curve) estimators of overall and conditional DMFS curves for the DM onset time after surgery stratified by BRCA1 level defined at the cutoff point 8th decile. The BRCA1 high- and low-expression groups are shown in red and in blue, respectively. P value of likelihood ratio test (PLRT) was 0.004.
Figure 4
Figure 4
Logistic AFT mixture regression models for tamoxifen-treated and untreated patients. The chosen model was based on BRCA1 cutoff 8th decile. Survival curves for the tamoxifen-treated cohort, untreated GSE7390 cohort and untreated GSE2034 cohort are shown in black, red and blue, respectively. High- and low-BRCA1 expression subgroups are shown with solid and dashed lines, respectively. (A) Treated group and untreated GSE7390. In the overall DMFS plot, the two low-BRCA1 groups (red and black dashed lines) were fitted as the same group by the model. In the conditional DMFS plot, the two low-BRCA1 groups were fitted as the same group by the model, as were the two high-BRCA1 groups. (B) Treated group and untreated GSE2034. In the conditional DMFS plot in the right panel, both BRCA1 expression groups of GSE2034 were fitted to be the same as those of the high BRCA1-treated patients.
Figure 5
Figure 5
MKI67 and PCNA expression in 359 tamoxifen-treated patients. (A) Scatterplot of MKI67 and PCNA expression levels for 4 groups of patients. (B) Boxplot of MKI67 expression in 4 groups of patients. (C) Boxplot of PCNA expression in 4 groups of patients. 1 = High BRCA1 patients with DM, 2 = High BRCA1 “cured” patients (i.e., without DM and follow-up longer than 5.77 years), 3 = Low BRCA1 patients with DM, 4 = Low BRCA1 “cured” patients (i.e., without DM and follow-up longer than 5.77 years).
Figure 6
Figure 6
A comprehensive interpretation to link our observations and literature reports. This figure was drawn by Microsoft PowerPoint version 14.6.2 (https://www.microsoft.com/en-us/microsoft-365). (A) The pathway for the primary tumor to develop DM under the condition of sufficient BRCA1 protein (leading to low BRCA1 expression via autoregulation). (B) The pathway for the primary tumor to develop DM under the condition of low effective BRCA1 protein concentration (leading to high BRCA1 expression via autoregulation).

References

    1. Bray F, et al. Global cancer statistics 2018: GLOBOCAN estimates of incidence and mortality worldwide for 36 cancers in 185 countries. CA. Cancer J. Clin. 2018 doi: 10.3322/caac.21492. - DOI - PubMed
    1. Gorodetska I, Kozeretska I, Dubrovska A. BRCA genes: The role in genome stability, cancer stemness and therapy resistance. J. Cancer. 2019 doi: 10.7150/jca.30410. - DOI - PMC - PubMed
    1. Wu J, Lu LY, Yu X. The role of BRCA1 in DNA damage response. Protein Cell. 2010;1:117–123. doi: 10.1007/s13238-010-0010-5. - DOI - PMC - PubMed
    1. Savage KI, Harkin DP. BRCA1, a “complex” protein involved in the maintenance of genomic stability. FEBS J. 2015 doi: 10.1111/febs.13150. - DOI - PubMed
    1. Mangia A, et al. BRCA1 expression and molecular alterations in familial breast cancer. Histol. Histopathol. 2009;24:69–76. - PubMed

Publication types