Comparative Study
. 2022 Jan 7;12(1):174.
doi: 10.1038/s41598-021-03642-9.

The embryonic transcriptome of Parhyale hawaiensis reveals different dynamics of microRNAs and mRNAs during the maternal-zygotic transition

Affiliations
Comparative Study

The embryonic transcriptome of Parhyale hawaiensis reveals different dynamics of microRNAs and mRNAs during the maternal-zygotic transition

Llilians Calvo et al. Sci Rep. .

Abstract

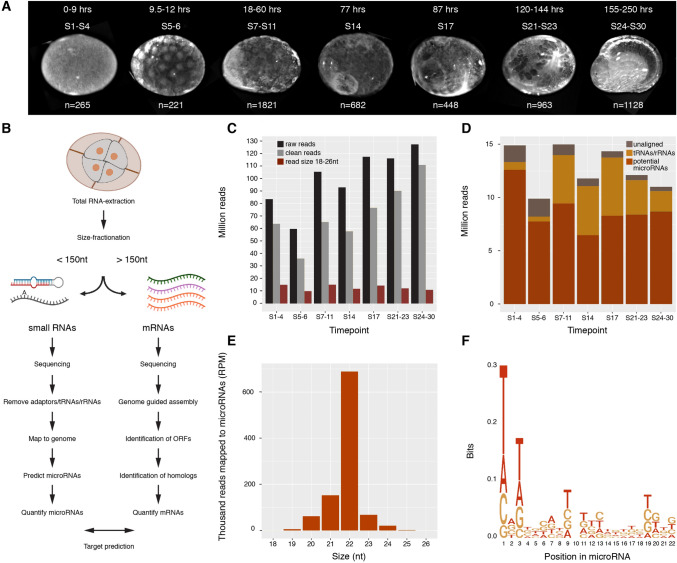
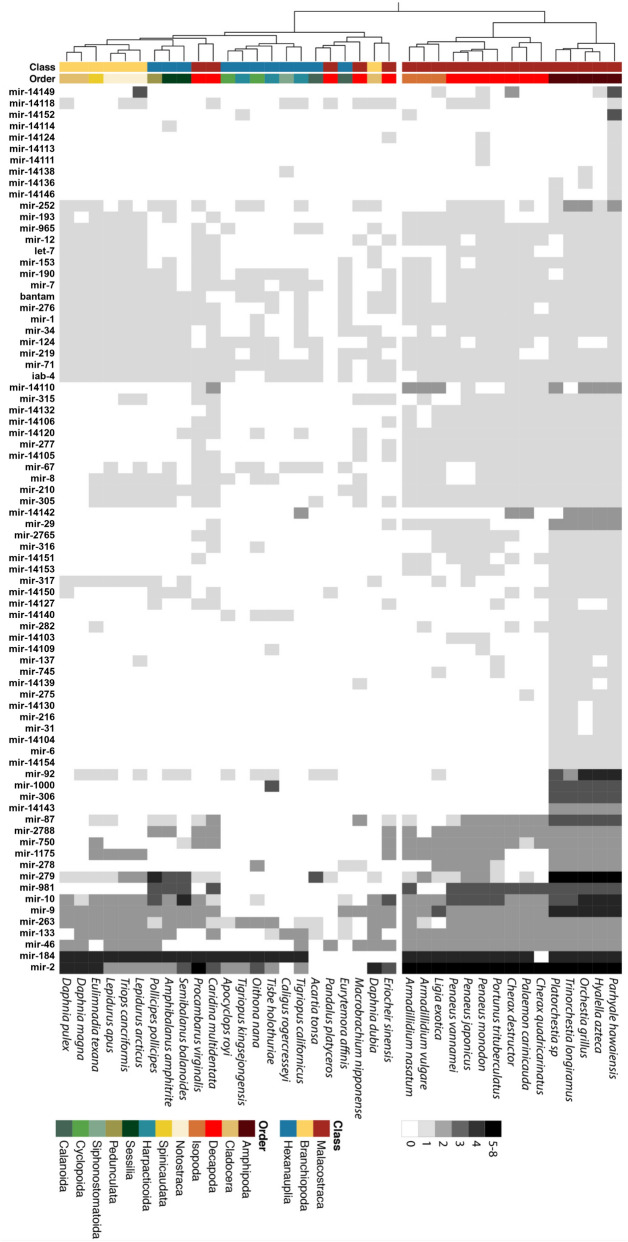
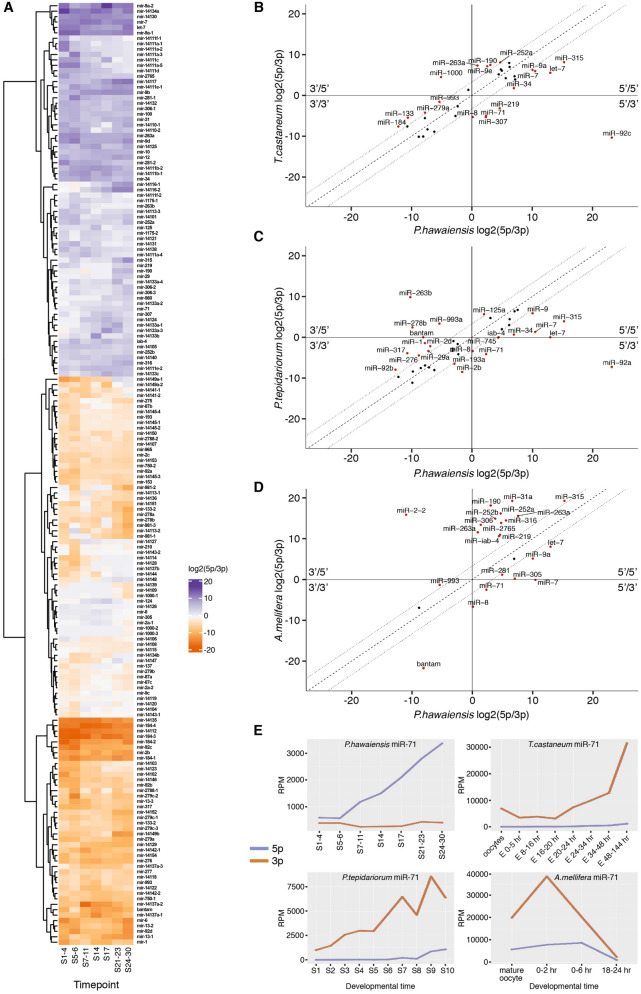
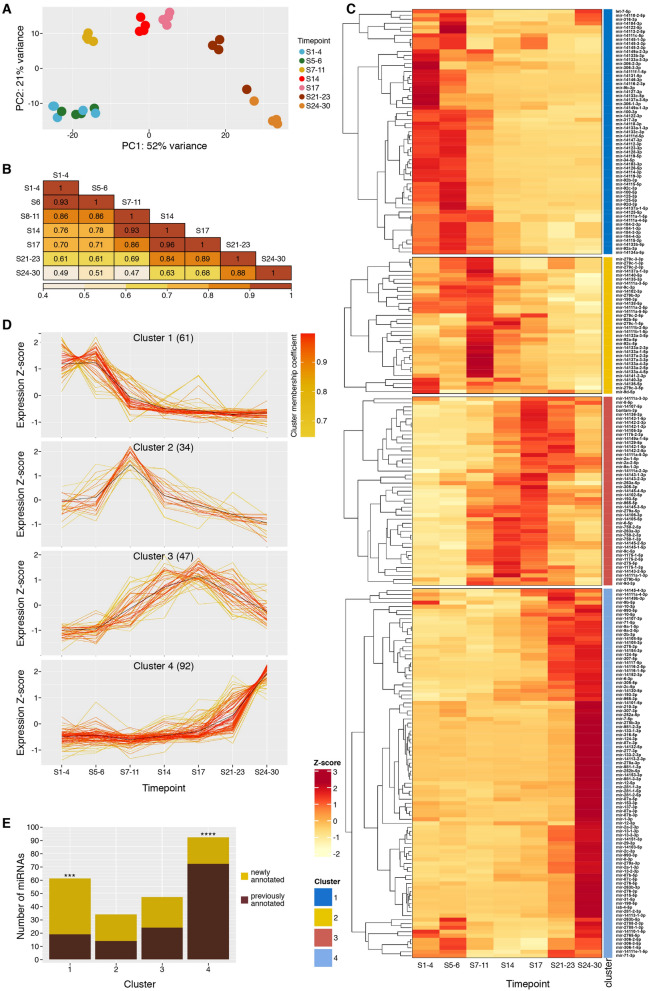
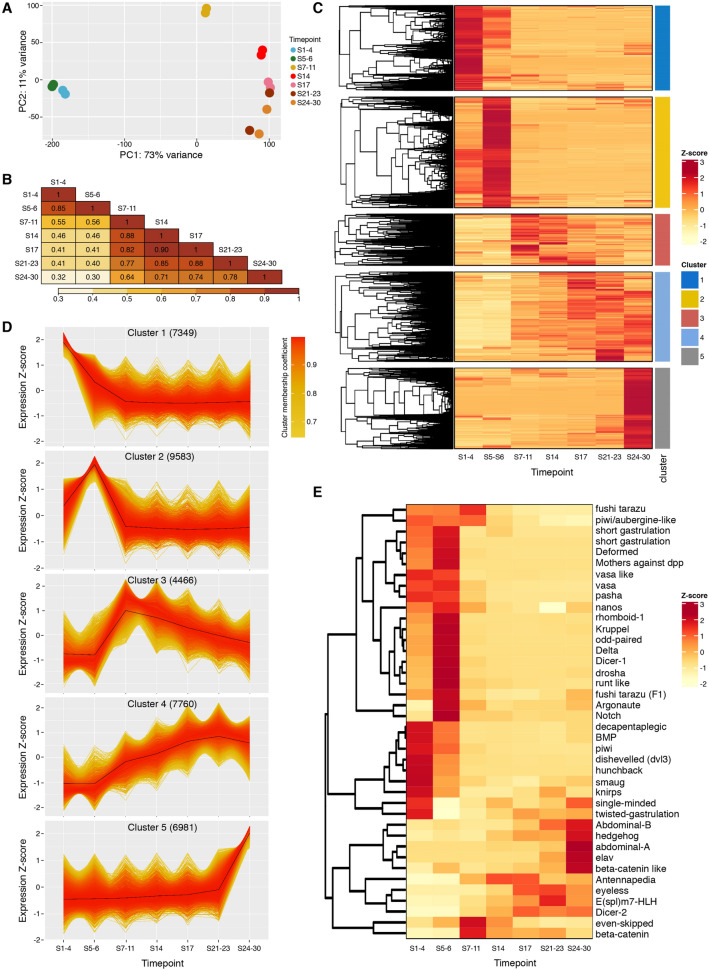
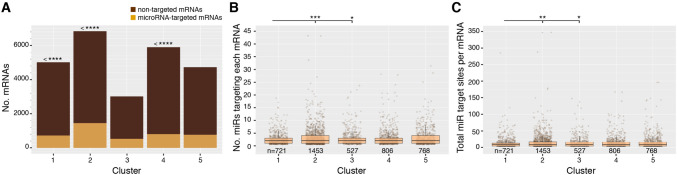
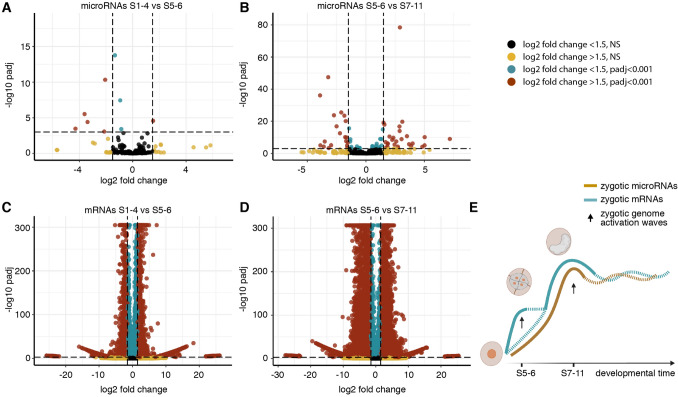
Parhyale hawaiensis has emerged as the crustacean model of choice due to its tractability, ease of imaging, sequenced genome, and development of CRISPR/Cas9 genome editing tools. However, transcriptomic datasets spanning embryonic development are lacking, and there is almost no annotation of non-protein-coding RNAs, including microRNAs. We have sequenced microRNAs, together with mRNAs and long non-coding RNAs, in Parhyale using paired size-selected RNA-seq libraries at seven time-points covering important transitions in embryonic development. Focussing on microRNAs, we annotate 175 loci in Parhyale, 88 of which have no known homologs. We use these data to annotate the microRNAome of 37 crustacean genomes, and suggest a core crustacean microRNA set of around 61 sequence families. We examine the dynamic expression of microRNAs and mRNAs during the maternal-zygotic transition. Our data suggest that zygotic genome activation occurs in two waves in Parhyale with microRNAs transcribed almost exclusively in the second wave. Contrary to findings in other arthropods, we do not predict a general role for microRNAs in clearing maternal transcripts. These data significantly expand the available transcriptomics resources for Parhyale, and facilitate its use as a model organism for the study of small RNAs in processes ranging from embryonic development to regeneration.


Conflict of interest statement

The authors declare no competing interests.

Figures

Figure 1
Figure 1
Library preparation and microRNA annotation in Parhyale development. (A) Brightfield images of embryo stages selected for building libraries. All pictures are lateral views. Developmental stages, the corresponding number of hours post-fertilization, and the number of embryos used for each time-point are indicated. (B) Diagram of workflow for size-separated library preparation and analysis. (C) Absolute abundance of sequence reads per time-point, total sequences reads (black), clean reads remaining after adaptor removal (grey), reads remaining after size selection (brown). (D) Distribution of size selected reads following mapping to the genome and to tRNAs/rRNAs database. (E) Size distribution of reads mapping to predicted microRNAs. (F) Sequence logo of the first 22 nt of non-redundant reads mapping to microRNAs.
Figure 2
Figure 2
Homologs of Parhyale microRNAs in crustacean genomes from NCBI. Heatmap representing Parhyale microRNA families in the genomes of 37 crustaceans; greyscale indicates the number of members per microRNA family found in each species. Clustering analysis based on microRNA presence/absence was used to generate a species tree (left). The class and order of each species is indicated by the colour-coded ribbon.
Figure 3
Figure 3
MicroRNA arm switching through development and evolution. (A) Heatmap showing relative arm usage changes across seven time-points of Parhyale embryonic development. Purple indicates 5' dominance, orange 3' dominance. Comparison of the relative arm usage of microRNA homologs between Parhyale and Tribolium (B), spider (C) and honeybee (D). All three show microRNAs that have undergone arm switching (5'/3' or 3'/5' quadrants). Dotted lines show the tenfold difference boundary, name labels are shown for each microRNA exceeding this tenfold change in arm usage. (E) miR-71-5p and -3p arm expression data through development for the four species analysed.
Figure 4
Figure 4
Differential expression analysis of microRNAs during development. (A) Principal component analysis (PCA) of microRNA expression in each replicate and time-point. Four replicates are shown for each time-point. (B) Heatmap of all-versus-all pairwise Spearman correlation coefficients between time-points. Numbers in tiles are r values, and heatmap colour coding is based on r value. (C) Heatmap showing z-score calculated for expression of each microRNA through embryonic development. Each microRNA is classified into an expression cluster, indicated by the colour coded ribbon. (D) Expression profiles for microRNAs with membership scores ≥ 0.6 for each cluster; the number indicated in parentheses is the total number of microRNAs belonging to each cluster. (E) Composition of the 4 expression clusters in newly annotated and previously annotated microRNAs. Chi-squared tests were performed for each cluster. Cluster 1 shows a significantly higher proportion of newly annotated microRNAs than expected, X2 (1, N = 61) = 14.95, p = 1.10 × 10–4, whereas cluster 4 contains an unexpectedly high proportion of conserved microRNAs, X2 (1, N = 92) = 19.40, p = 1.05 × 10–5, p-value significance levels are indicated by asterisks.
Figure 5
Figure 5
Differential expression analysis of mRNAs during development. (A) Principal component analysis (PCA) of mRNA expression levels in each replicate and time-point. Two replicates are shown for each time-point. (B) Heatmap of all-versus-all pairwise Spearman correlation coefficients calculated between time-points. Numbers in tiles are r values, and heatmap colour coding is based on r value. (C) Heatmap showing z-score calculated for expression of each mRNA through embryonic development. Each mRNA is classified into an expression cluster, indicated by the colour coded ribbon. (D) Expression profiles for mRNAs with membership scores ≥ 0.6 for each cluster; the number indicated in parentheses is the total number of mRNAs belonging to each cluster. (E) Heatmap showing z-score of a subset of known developmental genes extracted from (D).
Figure 6
Figure 6
Differential targeting of mRNAs by microRNAs through development. (A) The number of mRNAs in each expression cluster that are predicted to be targeted by microRNAs versus those that are non-targeted. Hypergeometric tests were performed to compare the observed numbers with expected values, calculated based on the overall proportion of targeted mRNAs within the entire mRNA population. Significance values are indicated by asterisks. Cluster 1 is under-enriched for targeted mRNAs, padj = 1.62 × 10–9; cluster 2 is over-enriched for targeted mRNAs, padj = 6 × 10–45; and cluster 4 is under-enriched for targeted mRNAs, padj = 8.25 × 10–19. (B) The number of different microRNAs targeting each mRNA in each expression cluster. Pairwise Mann–Whitney-Wilcoxon tests were performed between all clusters; significant comparisons are highlighted (padj < 0.05): Cluster 1 vs 2, padj = 5.76 × 10–4; cluster 1 vs 3, padj = 2.45 × 10–2. (C) The number of microRNA targeting sites per mRNA 3'UTR in each expression cluster. Pairwise Mann–Whitney-Wilcoxon tests were performed between all clusters; significant comparisons are shown (padj < 0.05): Cluster 1 vs 2, padj = 4.48 × 10–3; cluster 1 vs 3, padj = 3.31 × 10–2.
Figure 7
Figure 7
Differential expression analysis during zygotic genome activation. (A,B) Volcano plots showing log2 fold change in expression (x-axis) versus the p-value (y-axis), for each microRNA expressed between the first two time-points S1–4 to S5–6 (A) and S5–6 to S7–11 (B). (C,D) Volcano plot showing log2 fold change in expression (x-axis) versus the p-value (y-axis) for each mRNA expressed between the first two time-points S1–4 to S5–6 (C) and S5–6 to S7–11 (D). Only red dots (log2 fold change ≤ -1.5 or ≥ 1.5 with padj ≤ 0.001 are considered significant. (E) Model of zygotic genome activation occurring in two different waves of expression for the mRNAs; onset of microRNA expression occurs only in the second wave.

Similar articles

Cited by

References

    1. Kao D, et al. The genome of the crustacean Parhyale hawaiensis, a model for animal development, regeneration, immunity and lignocellulose digestion. Elife. 2016;5:20062. - PMC - PubMed
    1. Zeng V, et al. De novo assembly and characterization of a maternal and developmental transcriptome for the emerging model crustacean Parhyale hawaiensis. BMC Genom. 2011;12:581. - PMC - PubMed
    1. Blythe MJ, et al. High through-put sequencing of the Parhyale hawaiensis mRNAs and microRNAs to aid comparative developmental studies. PLoS ONE. 2012;7:e33784. - PMC - PubMed
    1. Martin A, et al. CRISPR/Cas9 mutagenesis reveals versatile roles of Hox genes in crustacean limb specification and evolution. Curr. Biol. 2016;26:14–26. - PubMed
    1. Browne WE, Price AL, Gerberding M, Patel NH. Stages of embryonic development in the amphipod crustacean, Parhyale hawaiensis. Genesis. 2005;42:124–149. - PubMed

Publication types