. 2022 Jan 7;12(1):30.
doi: 10.1038/s41598-021-03748-0.

Ablation of VLA4 in multiple myeloma cells redirects tumor spread and prolongs survival

Affiliations

Ablation of VLA4 in multiple myeloma cells redirects tumor spread and prolongs survival

Deep Hathi et al. Sci Rep. .

Abstract

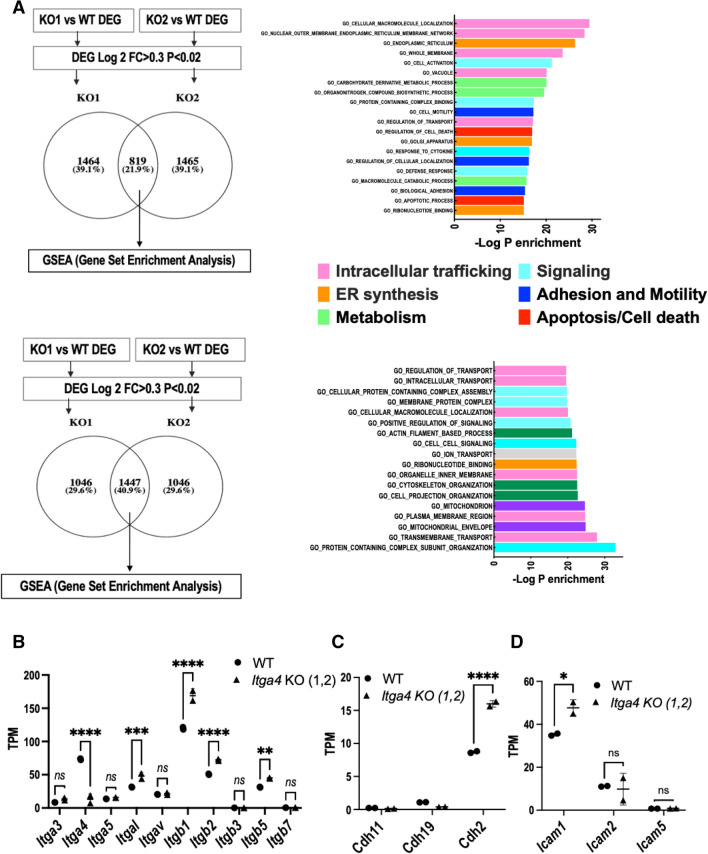
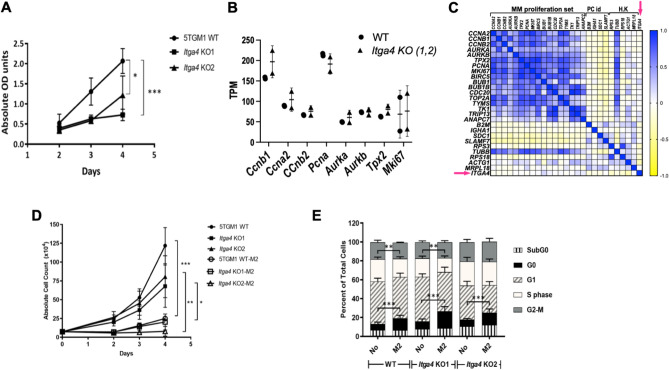
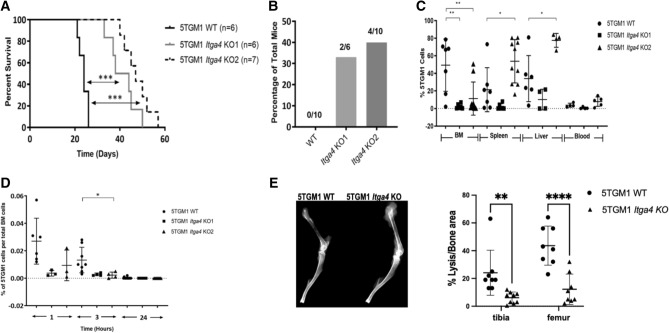
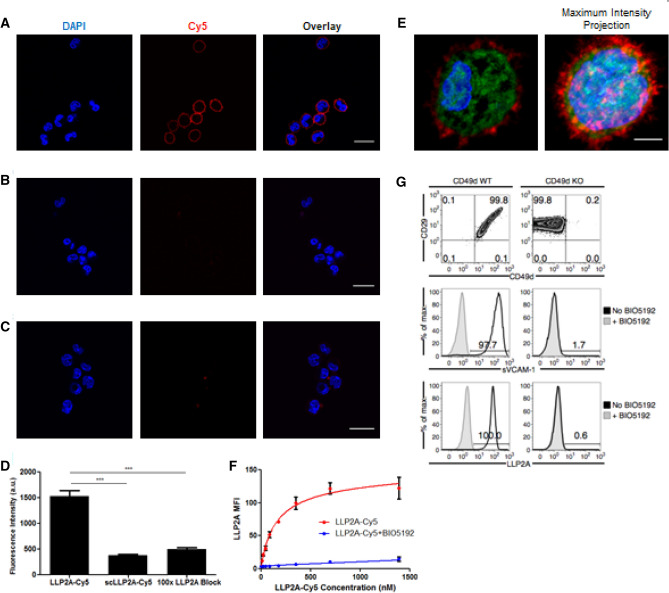
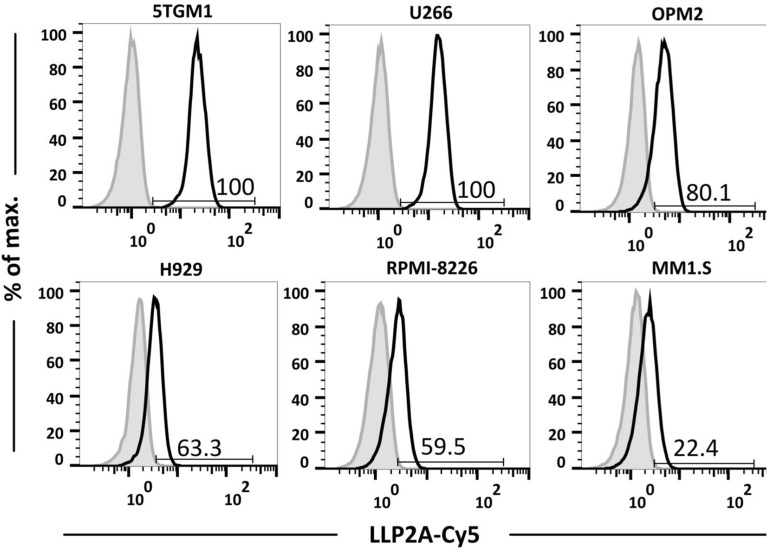
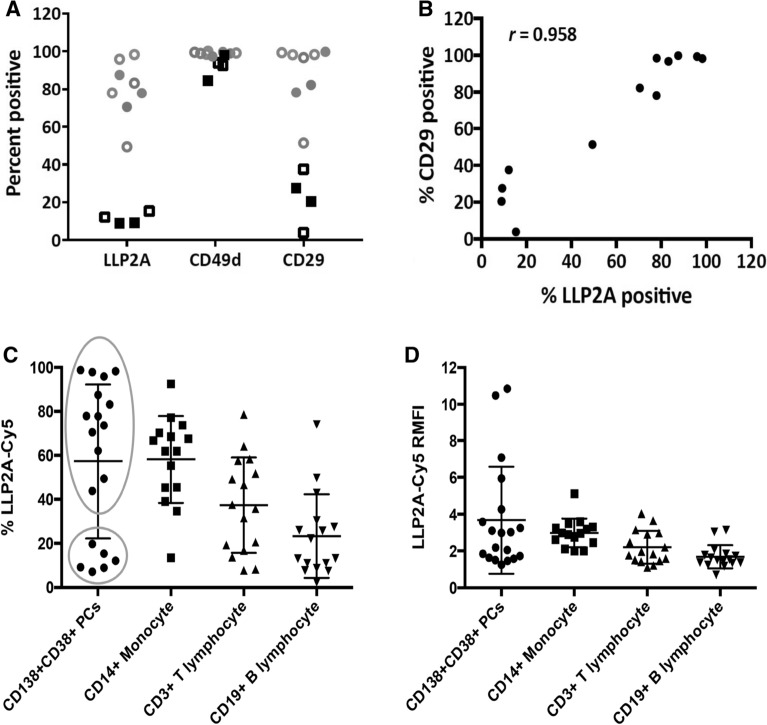
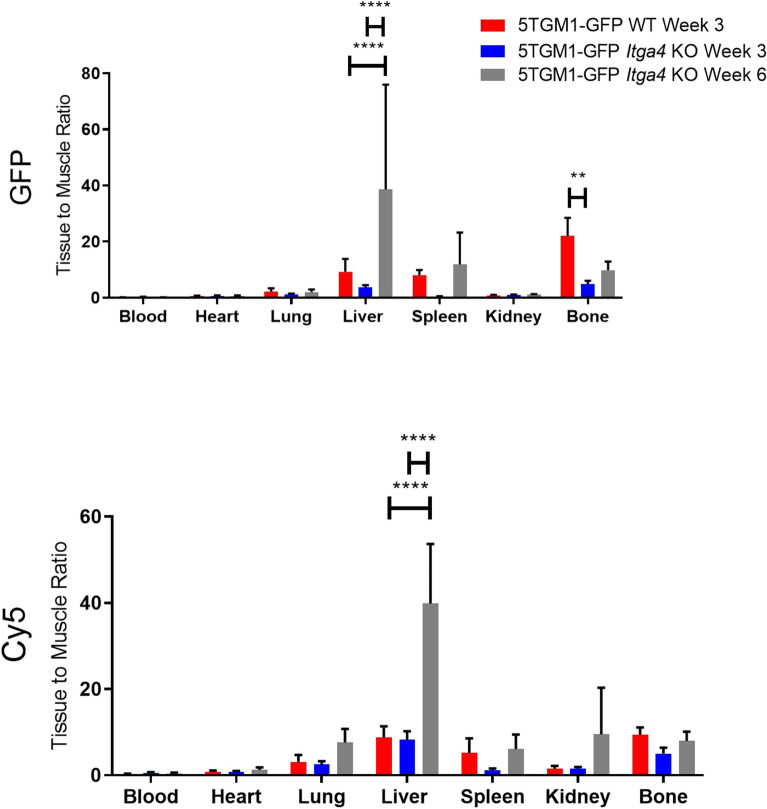
Multiple myeloma (MM) is a cancer of bone marrow (BM) plasma cells, which is increasingly treatable but still incurable. In 90% of MM patients, severe osteolysis results from pathological interactions between MM cells and the bone microenvironment. Delineating specific molecules and pathways for their role in cancer supportive interactions in the BM is vital for developing new therapies. Very Late Antigen 4 (VLA4, integrin α4β1) is a key player in cell-cell adhesion and signaling between MM and BM cells. We evaluated a VLA4 selective near infrared fluorescent probe, LLP2A-Cy5, for in vitro and in vivo optical imaging of VLA4. Furthermore, two VLA4-null murine 5TGM1 MM cell (KO) clones were generated by CRISPR/Cas9 knockout of the Itga4 (α4) subunit, which induced significant alterations in the transcriptome. In contrast to the VLA4+ 5TGM1 parental cells, C57Bl/KaLwRij immunocompetent syngeneic mice inoculated with the VLA4-null clones showed prolonged survival, reduced medullary disease, and increased extramedullary disease burden. The KO tumor foci showed significantly reduced uptake of LLP2A-Cy5, confirming in vivo specificity of this imaging agent. This work provides new insights into the pathogenic role of VLA4 in MM, and evaluates an optical tool to measure its expression in preclinical models.


Conflict of interest statement

JFD receives research support from Macrogenics, NeoImmuneTech and Bioline; is a consultant of REvervest; received honorarium Amgen and has ownership/equity in Magenta, WUGEN. MS is the co-founder of Sarya, LLC. All other authors declare no competing financial interests.

Figures

Figure 1
Figure 1
Gene set enrichment analysis (GSEA) of differentially expressed genes (DEG) by RNAseq of WT vs Itga4 KO 5TGM1 cells. (A) Identification of upregulated (top) and downregulated (bottom) genes (left), and gene ontology analysis (right). Gene ontology results from GSEA were plotted as negative Log of P value for gene set enrichment and color coded for involvement in intracellular membrane or protein trafficking (pink), synthesis and secretion of secretory proteins from co-translational entry in the Endoplasmic Reticulum (ER) to the Golgi apparatus (orange), signaling (light blue), cell adhesion and motility (blue), metabolism (light green), cell death (red), cytoskeleton (green), and mitochondria (purple). (BD) univariate analysis of expression of adhesion molecules (A) integrins, (B) cadherins, (C) intercellular adhesion molecules *p < 0.05, **p < 0.01, ***p < 0.001, ****p < 0.0001, ns non significant.
Figure 2
Figure 2
In vitro characterization and functional assessment of Itga4 KO 5TGM1-GFP cells compared to WT 5TGM1-GFP cells. (A) The WST-1 proliferation assay comparing the WT with the KO cells. (B) gene expression by RNAseq of proliferation-associated genes in 5TGM1 WT and Itga4 KO clones KO1 and KO2. (C) Correlation matrix from RNAseq data from patient myeloma cells comparing ITGA4 (arrow) to the proliferative MM signature genes, plasma cell identity markers, and common housekeeping genes. (D) Fluorescence bead count assay to quantify proliferation of Itga4 KO 5TGM1-GFP cells vs WT 5TGM1-GFP cells in the presence and absence of M2-10B4 (M2) stromal cells. The open and dense labels refer to cells cultured with and without M2-10B4 (M2). (E) Cell cycle assay comparing the Itga4 KO 5TGM1-GFP cells vs. WT 5TGM1-GFP cells in the presence and absence of M2-10B4 (M2). Data are shown as mean and SD. All cell biology panels represent the combination of three independent experiments. (*p < 0.05, **p < 0.01, ***p < 0.001; unpaired t test).
Figure 3
Figure 3
The in vivo characteristics of the Itga4 KO 5TGM1-GFP cells were compared with the WT 5TGM1-GFP cells in the intravenous (i.v.) KaLwRij mouse model. (A) The Itga4 KO 5TGM1-GFP cells engrafted in immunocompetent C57BL/KaLwRij mouse model demonstrated significant survival advantage. (B) Quantitation of number of mice that developed extramedullary tumors detected in mice engrafted with WT or Itga4 KO 5TGM1-GFP cells. (C) Flow cytometry was used to measure percent 5TGM1 cell levels in different tissues. Each symbol represents a unique mouse. (D) Lack of Itga4 in 5TGM1 cells led to reduced BM homing in in vivo competitive homing experiment (n = 18). Shown is the percentage of 5TGM1 cells in the BM. All graphs represent data at time of death. (E) Assessment of myeloma bone disease three weeks from inoculation of 5TGM1 WT vs Itga4 KO, representative X-ray (left) and quantification of hypointense areas/total bone area in tibia and femur (N = 5 mice/group).
Figure 4
Figure 4
LLP2A-Cy5 specificity and affinity to VLA4 in vitro. (A) Strong cell surface fluorescence was observed in the WT 5TGM1-GFP cells incubated with LLP2A-Cy5 (1 µM, 15 min, at 4 °C). Blue, green and red colors represent nuclear stain, GFP, and Cy5 signal, respectively in all images (60x; scale bar: 20 µm). (B) Cell surface signal was decreased when the same was co-incubated with 100-fold excess of LLP2A-PEG4 blocking peptide (100 µM). (C) Cell surface binding was also reduced in the WT 5TGM1-GFP cells treated with scLLPA-Cy5 (1 µM, 15 min, at 4 °C). (D) Quantification of background corrected cell fluorescence showed significantly increased signal in LLP2A-Cy5 incubated cells, relative to scLLP2A-Cy5 and blocking (***p < 0.001 1-way analysis of variance (ANOVA) with Bonferroni multiple comparisons test). (E) Representative high-resolution imaging of a single cell incubated with LLP2A-Cy5 for 2.5 h at 37 °C. Cells exhibiting minimal motion at 60 × magnification were imaged in a confocal 3D z-stack. Post-deconvolution visualization of a single confocal plane (left) and maximal intensity projection (right) of the confocal 3D z-stack (100x; scale bar: 3 µm) show strong cell surface binding with minimal internalization of LLP2A-Cy5. (F) FACS of LLP2A-Cy5 incubated with WT 5TGM1-GFP cells demonstrated selective binding of LLP2A-Cy5 to VLA4. WT 5TGM1-GFP cells and varying LLP2A-Cy5 concentrations (0-1400 nM) were co-incubated for 30 min and washed with Tyrode’s buffer containing 1% BSA. BIO5192 (100 nM) was used to evaluate non-specific binding. (G) LLP2A-Cy5 showed minimal binding to VLA4 KO cells relative to VLA4+ WT tumor cells. (Top) 1.5 × 105 WT and KO 5TGM1-GFP cells were assessed for α4 and β1 levels, and for binding with sVCAM-1 (Middle), and (Bottom) LLP2A-Cy5 respectively.
Figure 5
Figure 5
LLP2A-Cy5 binding to diverse MM cell lines. Flow cytometry was performed to evaluate binding of LLP2A-Cy5 to different myeloma cell lines.
Figure 6
Figure 6
LLP2A-Cy5 reports on expression of dimeric VLA4 in primary human multiple myeloma. (A) Percentage of LLP2A + , CD49d + (α4) and CD29 + (β1) on CD138 + CD38 + cells from 12 MM BM patient samples. Dense and open symbols referred to newly diagnosed and relapsed patient samples, respectively. (B) The correlation between percentage of LLP2A + cells and CD29 + cells [Pearson correlation coefficient with r = 0.958 (p < 0.0001)]. (C) The percentage of LLP2A + cells and (D) relative mean fluorescent intensity (RMFI) on different cell types (19 MM PC samples).
Figure 7
Figure 7
LLP2A-Cy5 NIR imaging of C57Bl/6 KaLwRij mice injected with 5TGM1-GFP WT and KO cells. Normalized biodistribution [defined as tissue to muscle ratio (TMR)] of GFP and Cy5 three and six weeks post-administration of cells. Two-way ANOVA followed by Sidak’s multiple comparisons test was performed on biodistribution data (**p < 0.01; ****p < 0.0001).

Similar articles

Cited by

References

    1. Howlader, N.N.A., Krapcho, M., Miller, D., Brest, A., Yu, M., Ruhl, J., Tatalovich, Z., Mariotto, A., Lewis, D.R., Chen, H.S., Feuer, E.J., Cronin, K.A. (eds). SEER Cancer Statistics Review, 1975–2018, National Cancer Institute. Bethesda, MD, https://seer.cancer.gov/csr/1975_2018/, based on November 2020 SEER data submission, posted to the SEER web site, April 2021.
    1. Mina R, Joseph NS, Gay F, Kastritis E, Petrucci MT, Kaufman JL, Montefusco V, Gavriatopoulou M, Patriarca F, Omedé P, Boise LH, Roussou M, Giuliani N, Oliva S, Offidani M, Belotti A, Jaye DL, De Paoli L, Terpos E, Lonial S, Boccadoro M, Nooka AK, Dimopoulos MA. Clinical features and survival of multiple myeloma patients harboring t(14;16) in the era of novel agents. Blood Cancer J. 2020;10:40. - PMC - PubMed
    1. Terpos E, Ntanasis-Stathopoulos I, Gavriatopoulou M, Dimopoulos MA. Pathogenesis of bone disease in multiple myeloma: from bench to bedside. Blood Cancer J. 2018;8:7. - PMC - PubMed
    1. Lentzsch S, Ehrlich LA, Roodman GD. Pathophysiology of multiple myeloma bone disease. Hematol. Oncol. Clin. North Am. 2007;21:1035–1049. - PubMed
    1. Terpos, E., Christoulas, D., Gavriatopoulou, M. and Dimopoulos, M.A. Mechanisms of bone destruction in multiple myeloma. Eur. J. Cancer Care (Engl). 2017;26. - PubMed

Publication types