. 2022 Jan 7;12(1):143.
doi: 10.1038/s41598-021-03744-4.

Blast-induced axonal degeneration in the rat cerebellum in the absence of head movement

Affiliations

Blast-induced axonal degeneration in the rat cerebellum in the absence of head movement

Robin Bishop et al. Sci Rep. .

Abstract

Blast exposure can injure brain by multiple mechanisms, and injury attributable to direct effects of the blast wave itself have been difficult to distinguish from that caused by rapid head displacement and other secondary processes. To resolve this issue, we used a rat model of blast exposure in which head movement was either strictly prevented or permitted in the lateral plane. Blast was found to produce axonal injury even with strict prevention of head movement. This axonal injury was restricted to the cerebellum, with the exception of injury in visual tracts secondary to ocular trauma. The cerebellar axonal injury was increased in rats in which blast-induced head movement was permitted, but the pattern of injury was unchanged. These findings support the contentions that blast per se, independent of head movement, is sufficient to induce axonal injury, and that axons in cerebellar white matter are particularly vulnerable to direct blast-induced injury.


Conflict of interest statement

The authors declare no competing interests.

Figures
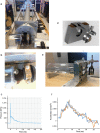
Figure 1
Figure 1
Blast simulator tube with head-fixed and head-movement rat holsters. (a, b) Blast simulator tube with rat in head-fixed configuration, from side and from top. (c) Trace of blast overpressure wave measured 2.54 cm from the tube orifice. (d, e) Schematic rendering and photograph of head-movement rat holster. Metal stop to the right of the fulcrum serves to prevent extreme neck flexion. (f) Three superimposed recordings of rat head lateral acceleration during blast exposure with rats placed in the head-movement holster.
Figure 2
Figure 2
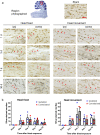
Injured nerve fibers in superficial cerebellar white matter. (a) Silver staining identifies injured nerve fibers (black, red arrowheads) and cell nuclei (brown) in sections taken ipsilateral and contralateral to blast impact. Heads were either fixed in place or allowed to move laterally during blast exposure, and brains were harvested at the indicated time points. Sections from control (sham blast exposure) rats showed no detectable silver staining. Scale bar = 30 µm. Images are representative of n = 3 rats treated under each condition and time point. (b) Quantification of silver-stained neurites (means ± s.e.m per field; n = 3). In both the head-fixed and head-movement conditions, the number of injured neurites was increased relative to the sham condition. (p < 0.01 by the Mann–Whitney test). Differences between the two sides and between the four time points assessed were not statistically different in either condition.
Figure 3
Figure 3
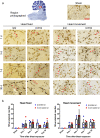
Injured nerve fibers in deep cerebellar white matter. (a) Silver staining identifies injured nerve fibers (black, red arrowheads) and cell nuclei (brown) in sections taken ipsilateral and contralateral to blast impact. Heads were either fixed in place or allowed to move laterally during blast exposure, and brains were harvested at the indicated time points. Sections from sham-treated rats showed no detectable silver staining. Scale bar = 30 µm. Images are representative of n = 3 rats treated under each condition at each time point. (b) Quantification of silver-stained neurites (means ± s.e.m per field; n = 3). In both the head-fixed and head-movement conditions, the number of injured neurites was increased relative to the sham condition. (p < 0.01 by the Mann–Whitney test). Differences between the two sides and between the four time points assessed were not statistically different in either condition.
Figure 4
Figure 4
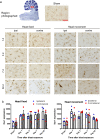
Microglial activation in cerebellar white matter. (a) Scattered microglia with activated, hypertrophied morphology and increased Iba-1 immunoreactivity (brown) are evident in brains from both the head-fixed and head-movement blast exposures at all time points evaluated. Scale bar = 30 µm. Images are from sections taken ipsilateral and contralateral to blast impact and are representative of n = 3 rats in each condition and time point. (b) Quantification of Iba-1 expression, means ± s.e.m; n = 3–4). In both the head-fixed and head-movement conditions, Iba-1 expression was increased relative to the sham condition. (p < 0.05 by the Mann–Whitney test). Differences between the two sides and between the four time points assessed were not statistically different in either condition.
Figure 5
Figure 5
Microglial association with injured axons. High power views of cerebellar white matter show Iba-1 positive microglia with activated, hypertrophied morphology (brown, red arrows) are in contact with silver-stained fibers (black, red arrowheads). Images are from brains harvested 7 days after exposure to blast with heads fixed in place. Scale bar = 50 µm.
Figure 6
Figure 6
Degenerating nerve fibers in optic tracts. (a) Silver staining identifies degenerating nerve fibers (black, in regions marked by red arrowheads and dashed lines) and cell nuclei (brown). Note dense fiber degeneration contralateral to blast, scattered fiber degeneration ipsilateral to last, and none in sham-treated rat brain. Scale bar = 100 µm. Images are representative of n = 3 rats treated at each time point and condition. (b) Double labeling for microglia (red arrows) and silver-stained fibers (arrowheads) in a section taken contralateral to blast impact, 7 days after blast. Note microglia outside the optic tract marked by dotted lines do not exhibit activated morphology (open red arrow). Scale bar = 50 µm.
Figure 7
Figure 7
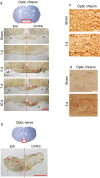
Degenerating fibers in optic nerve and optic chiasm. (a) Silver staining identifies degenerating nerve fibers (black) and cell nuclei (brown) in the optic chiasm of brains harvested at the indicated time points after head-fixed blast exposure. Red arrowheads show areas containing the very fine silver-stained processes. Representative of n = 3. Scale bar = 500 µm. (b) Silver stained fibers in the optic nerve were present exclusively in the nerve ipsilateral to blast (representative of n = 4). Note that fibers in these sections are running orthogonal to the plane of section. Scale bar = 500 µm. (c) Blast-induced axonal varicosities in the optic chiasm as shown by immunostaining for neurofilament–H. (d) Blast induced foci of amyloid precursor protein in the optic chiasm. Representative of n = 3. Scale bar = 30 µm for (c) and (d).

Similar articles

Cited by

References

    1. DePalma RG, Burris DG, Champion HR, Hodgson MJ. Blast injuries. N. Engl. J. Med. 2005;352:1335–1342. doi: 10.1056/NEJMra042083. - DOI - PubMed
    1. Cernak I, Noble-Haeusslein LJ. Traumatic brain injury: An overview of pathobiology with emphasis on military populations. J. Cereb. Blood Flow Metab. 2010;30:255–266. doi: 10.1038/jcbfm.2009.203. - DOI - PMC - PubMed
    1. Rosenfeld JV, et al. Blast-related traumatic brain injury. Lancet Neurol. 2013;12:882–893. doi: 10.1016/S1474-4422(13)70161-3. - DOI - PubMed
    1. Wolf SJ, Bebarta VS, Bonnett CJ, Pons PT, Cantrill SV. Blast injuries. Lancet. 2009;374:405–415. doi: 10.1016/S0140-6736(09)60257-9. - DOI - PubMed
    1. Hoge CW, et al. Mild traumatic brain injury in U.S. Soldiers returning from Iraq. N. Engl. J. Med. 2008;358:453–463. doi: 10.1056/NEJMoa072972. - DOI - PubMed

Publication types

MeSH terms