

In vivo electrical conductivity measurement of muscle, cartilage, and peripheral nerve around knee joint using MR-electrical properties tomography
- PMID: 34996978
- PMCID: PMC8741940
- DOI: 10.1038/s41598-021-03928-y
In vivo electrical conductivity measurement of muscle, cartilage, and peripheral nerve around knee joint using MR-electrical properties tomography
Abstract
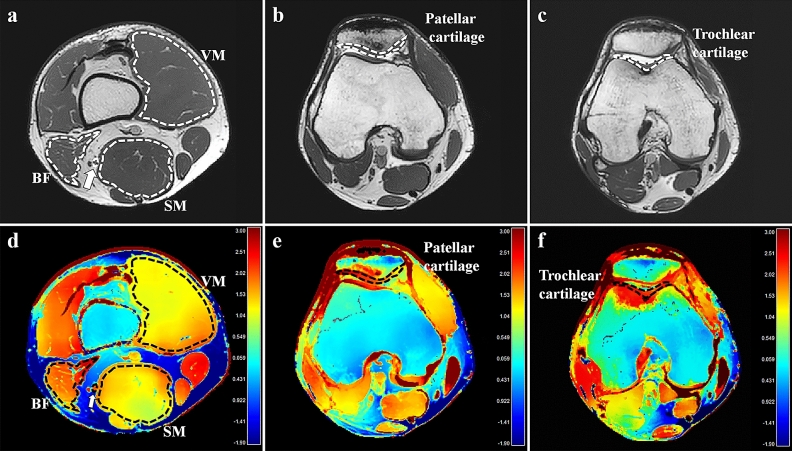
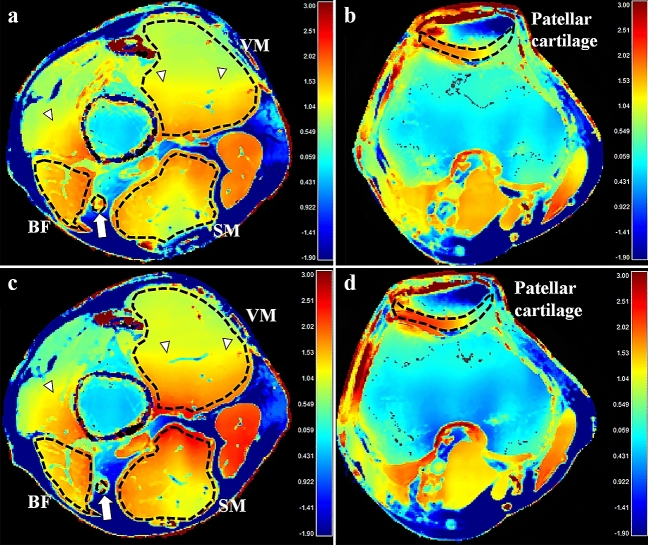
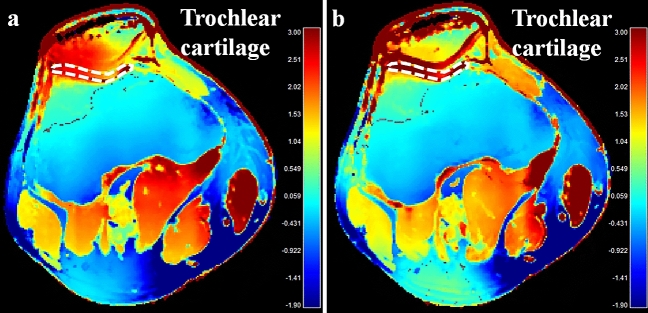
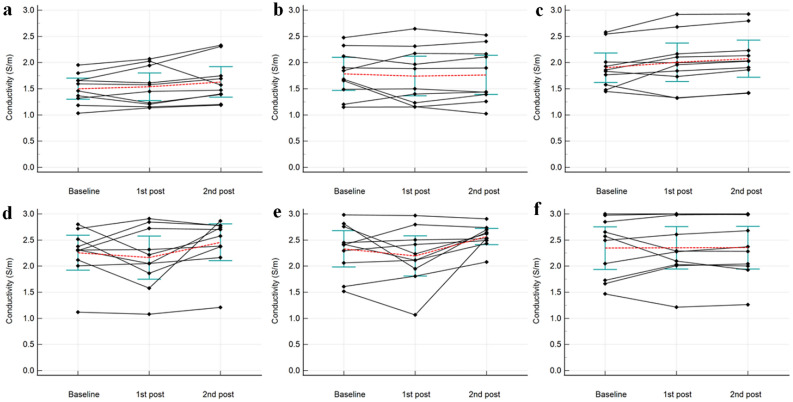
This study aimed to investigate whether in vivo MR-electrical properties tomography (MR-EPT) is feasible in musculoskeletal tissues by evaluating the conductivity of muscle, cartilage, and peripheral nerve around the knee joint, and to explore whether these measurements change after exercise. This prospective study was approved by the institutional review board. On February 2020, ten healthy volunteers provided written informed consent and underwent MRI of the right knee using a three-dimensional balanced steady-state free precession (bSSFP) sequence. To test the effect of loading, the subjects performed 60 squatting exercises after baseline MRI, immediately followed by post-exercise MRI with the same sequences. After reconstruction of conductivity map based on the bSSFP sequence, conductivity of muscles, cartilages, and nerves were measured. Measurements between the baseline and post-exercise MRI were compared using the paired t-test. Test-retest reliability for baseline conductivity was evaluated using the intraclass correlation coefficient. The baseline and post-exercise conductivity values (mean ± standard deviation) [S/m] of muscles, cartilages, and nerves were 1.73 ± 0.40 and 1.82 ± 0.50 (p = 0.048), 2.29 ± 0.47 and 2.51 ± 0.37 (p = 0.006), and 2.35 ± 0.57 and 2.36 ± 0.57 (p = 0.927), respectively. Intraclass correlation coefficient for the baseline conductivity of muscles, cartilages, and nerves were 0.89, 0.67, and 0.89, respectively. In conclusion, in vivo conductivity measurement of musculoskeletal tissues is feasible using MR-EPT. Conductivity of muscles and cartilages significantly changed with an overall increase after exercise.
© 2022. The Author(s).
Conflict of interest statement
This work was supported by research funding of Samsung Medical Center (No. SMO1200281). Three authors of this manuscript (E.K., C.F., and U.K.) are employees of Philips. All the other authors (J.H.L., Y.C.Y., H.S.K., J.L.) declare no competing interests.
Figures
Similar articles
-
Articular cartilage of the knee: rapid three-dimensional MR imaging at 3.0 T with IDEAL balanced steady-state free precession--initial experience.Radiology. 2006 Aug;240(2):546-51. doi: 10.1148/radiol.2402050288. Epub 2006 Jun 26. Radiology. 2006. PMID: 16801369
-
Reproducibility and regional variations of an improved gagCEST protocol for the in vivo evaluation of knee cartilage at 7 T.MAGMA. 2016 Jun;29(3):513-21. doi: 10.1007/s10334-016-0544-5. Epub 2016 Mar 10. MAGMA. 2016. PMID: 26965509
-
Automatic segmentation of the glenohumeral cartilages from magnetic resonance images.Med Phys. 2016 Oct;43(10):5370. doi: 10.1118/1.4961011. Med Phys. 2016. PMID: 27782728
-
In vivo morphometry and functional analysis of human articular cartilage with quantitative magnetic resonance imaging--from image to data, from data to theory.Anat Embryol (Berl). 2001 Mar;203(3):147-73. doi: 10.1007/s004290000154. Anat Embryol (Berl). 2001. PMID: 11303902 Review.
-
Electrical Properties Tomography: A Methodological Review.Diagnostics (Basel). 2021 Jan 26;11(2):176. doi: 10.3390/diagnostics11020176. Diagnostics (Basel). 2021. PMID: 33530587 Free PMC article. Review.
Cited by
-
Axon-like aligned conductive CNT/GelMA hydrogel fibers combined with electrical stimulation for spinal cord injury recovery.Bioact Mater. 2024 Feb 22;35:534-548. doi: 10.1016/j.bioactmat.2024.01.021. eCollection 2024 May. Bioact Mater. 2024. PMID: 38414842 Free PMC article.
-
The science of bioelectrical impedance-derived phase angle: insights from body composition in youth.Rev Endocr Metab Disord. 2025 Aug;26(4):603-624. doi: 10.1007/s11154-025-09964-7. Epub 2025 Apr 10. Rev Endocr Metab Disord. 2025. PMID: 40208410 Free PMC article. Review.
-
High frequency conductivity decomposition by solving physically constraint underdetermined inverse problem in human brain.Sci Rep. 2023 Feb 25;13(1):3273. doi: 10.1038/s41598-023-30344-1. Sci Rep. 2023. PMID: 36841894 Free PMC article.
-
Blood-Catalyzed Polymerization Creates Conductive Polymer in Live Zebrafish.Res Sq [Preprint]. 2024 Jun 25:rs.3.rs-3602290. doi: 10.21203/rs.3.rs-3602290/v1. Res Sq. 2024. PMID: 38978602 Free PMC article. Preprint.
-
Changes of in vivo electrical conductivity in the brain and torso related to age, fat fraction and sex using MRI.Sci Rep. 2024 Jul 12;14(1):16109. doi: 10.1038/s41598-024-67014-9. Sci Rep. 2024. PMID: 38997324 Free PMC article.
References
-
- Gabriel, S., Lau, R. W. & Gabriel, C. The dielectric properties of biological tissues: II. Measurements in the frequency range 10 Hz to 20 GHz. Phys. Med. Biol.41, 2251–2269, 10.1088/0031-9155/41/11/002 (1996). - PubMed
Publication types
MeSH terms
Grants and funding
LinkOut - more resources
Full Text Sources
Medical
