

Global variation in the cost of a nutrient-adequate diet by population group: an observational study
- PMID: 34998455
- PMCID: PMC8753783
- DOI: 10.1016/S2542-5196(21)00285-0
Global variation in the cost of a nutrient-adequate diet by population group: an observational study
Abstract
Background: Nutrient deficiencies limit human development and could be caused by the high cost of locally available foods needed to meet nutrient requirements. We aimed to identify the populations whose nutrient needs are most difficult to meet with existing global food systems.
Methods: In this observational study, we used the International Comparison Program 2017 collection of global food prices to measure cost per day and cost per calorie of meeting nutrient needs, based on least-cost diets within upper and lower bounds for energy and 20 nutrients for healthy populations across 20 demographic groups in 172 countries. We then analysed the composition of these least-cost diets by food groups to estimate how the affordability of foods for meeting nutrient needs varied by age, sex, and reproductive status.
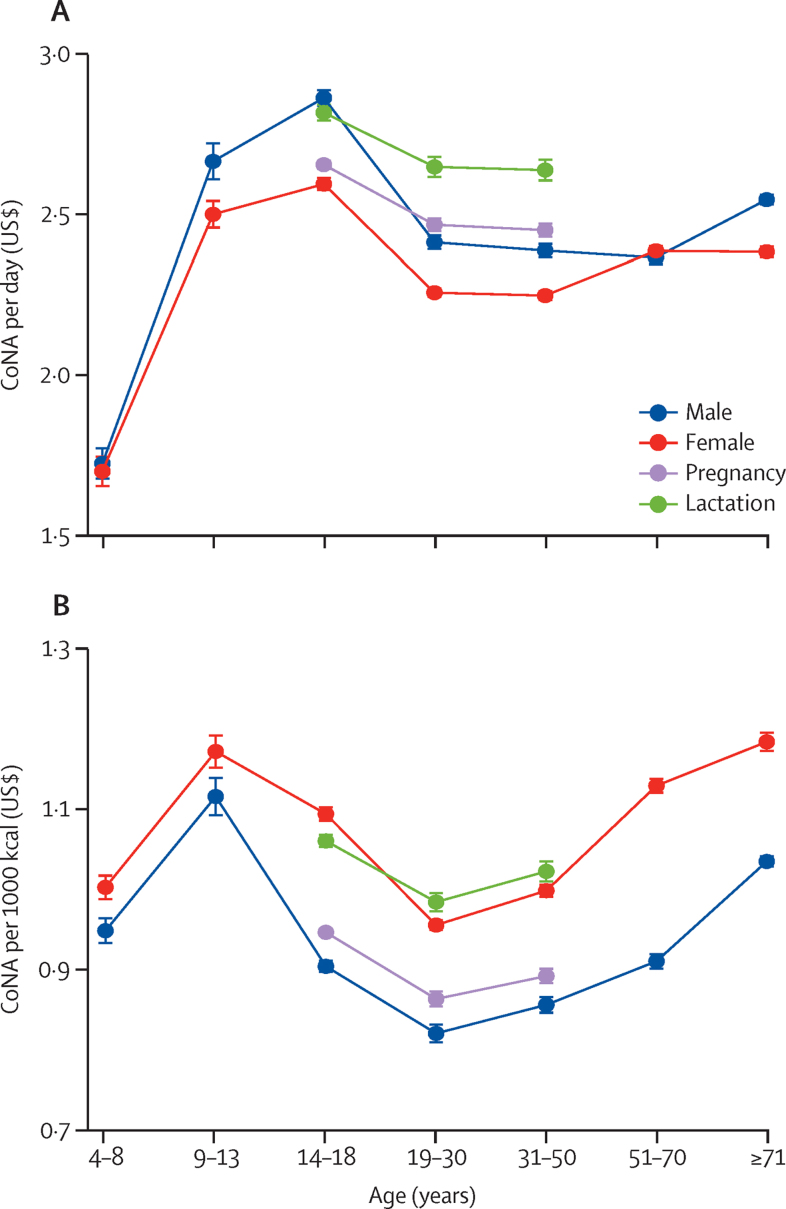
Findings: In 2017, the global median of diet costs per day was US$2·32 (IQR 1·95-2·76), with cost highest for adolescent boys aged 14-18 years at $2·72 (2·31-3·15). For females, median cost was highest for adolescents aged 14-18 years during pregnancy and lactation at $2·64 (2·29-3·15), exceeding the cost for adult men aged 19-30 years. The global median of diet cost per 1000 kcal was $0·94 (IQR 0·80-1·12), and was higher for females throughout the life course than for males, peaking for adolescent girls aged 9-13 years ($1·17 [95% CI 1·15-1·19]) and women older than 70 years ($1·18 [1·17-1·19]). Diet costs were most sensitive to requirements for calcium, iron, zinc, and vitamins C and E, as well as the upper bounds on carbohydrates and sodium. Total diet costs per day did not vary significantly with national income; however, in high-income countries, the composition of least-cost diets included more animal-source foods, whereas in low-income countries, diets with more pulses, nuts and seeds, and fruits and vegetables provided the most affordable way to meet nutrient requirements.
Interpretation: Diets with adequate nutrients were unaffordable for many demographic groups, especially women and girls. These results could help to guide agriculture and food policy or transfer programmes to support populations at risk of inadequate intake.
Funding: The Bill & Melinda Gates Foundation and UKAid.
Copyright © 2022 The Author(s). Published by Elsevier Ltd. This is an Open Access article under the CC BY 4.0 license. Published by Elsevier Ltd.. All rights reserved.
Conflict of interest statement
Declaration of interests We declare no competing interests.
Figures


References
-
- Global Nutrition Report 2020 Global Nutrition Report. https://globalnutritionreport.org/reports/2020-global-nutrition-report/
-
- Black RE, Allen LH, Bhutta ZA, et al. Maternal and child undernutrition: global and regional exposures and health consequences. Lancet. 2008;371:243–260. - PubMed
-
- Black RE, Victora CG, Walker SP, et al. Maternal and child undernutrition and overweight in low-income and middle-income countries. Lancet. 2013;382:427–451. - PubMed
-
- Caleyachetty R, Thomas GN, Kengne AP, et al. The double burden of malnutrition among adolescents: analysis of data from the Global School-Based Student Health and Health Behavior in School-Aged Children surveys in 57 low- and middle-income countries. Am J Clin Nutr. 2018;108:414–424. - PubMed
Publication types
MeSH terms
LinkOut - more resources
Full Text Sources
