. 2022 May:141:104311.
doi: 10.1016/j.mvr.2022.104311. Epub 2022 Jan 7.

Gene therapy with Pellino-1 improves perfusion and decreases tissue loss in Flk-1 heterozygous mice but fails in MAPKAP Kinase-2 knockout murine hind limb ischemia model

Affiliations

Gene therapy with Pellino-1 improves perfusion and decreases tissue loss in Flk-1 heterozygous mice but fails in MAPKAP Kinase-2 knockout murine hind limb ischemia model

Mahesh Thirunavukkarasu et al. Microvasc Res. 2022 May.

Abstract

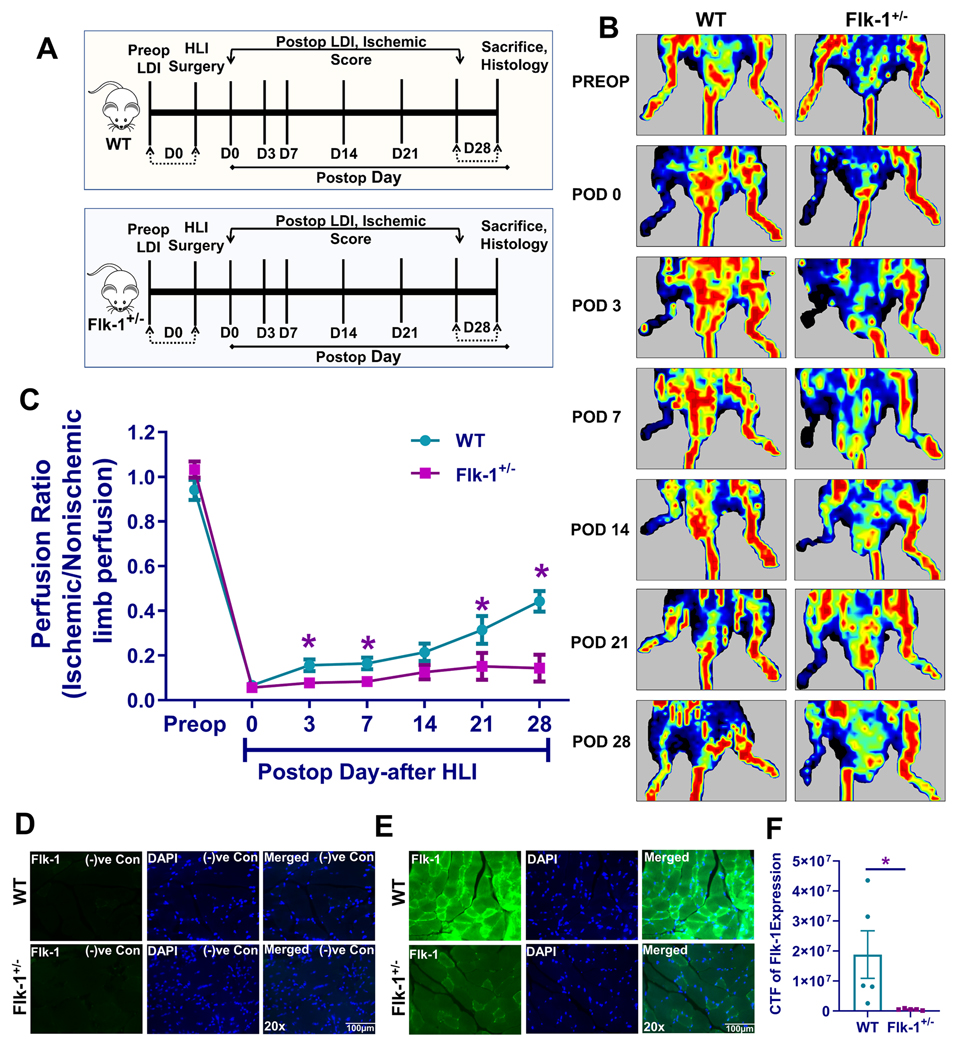
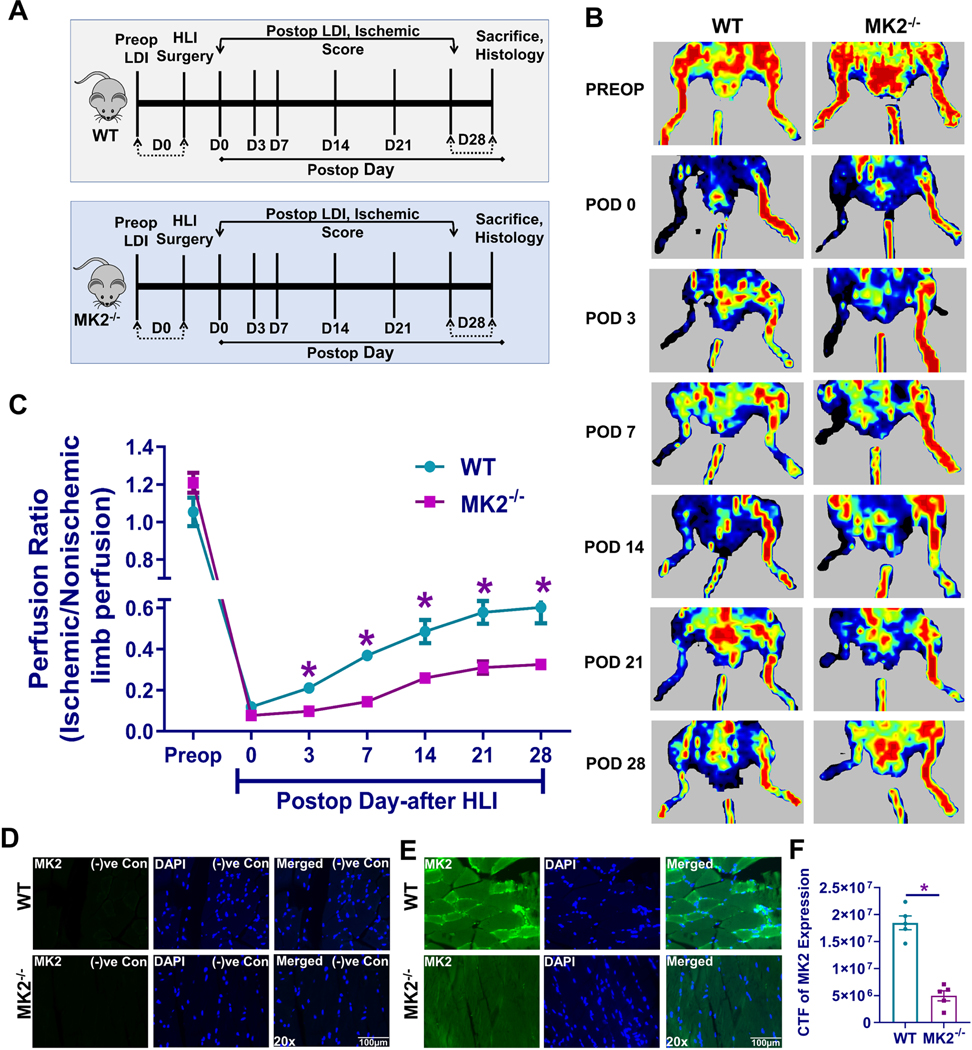
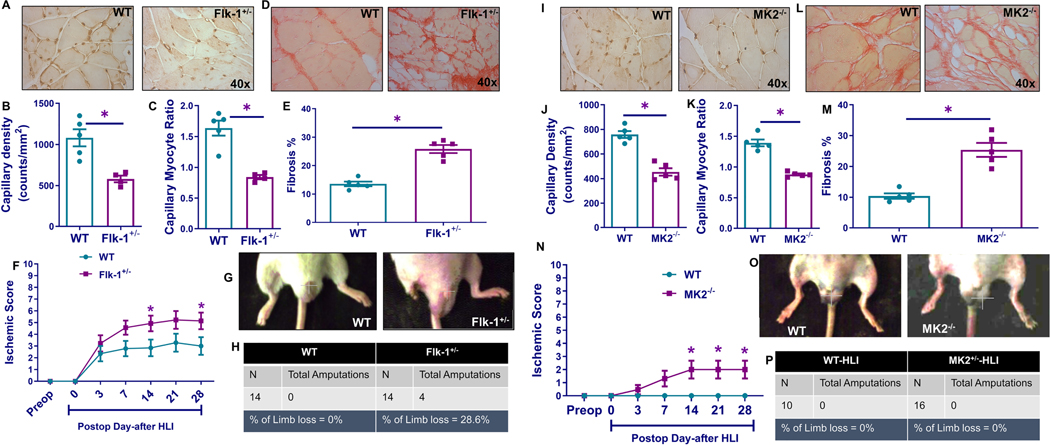
Objectives: In the United States, over 8.5 million people suffer from peripheral arterial disease (PAD). Previously we reported that Pellino-1(Peli1) gene therapy reduces ischemic damage in the myocardium and skin flaps in Flk-1 [Fetal Liver kinase receptor-1 (Flk-1)/ Vascular endothelial growth factor receptor-2/VEGFR2] heterozygous (Flk-1+/--) mice. The present study compares the angiogenic response and perfusion efficiency following hind limb ischemia (HLI) in, Flk-1+/- and, MAPKAPKINASE2 (MK2-/-) knockout (KO) mice to their control wild type (WT). We also demonstrated the use of Peli1 gene therapy to improve loss of function following HLI.

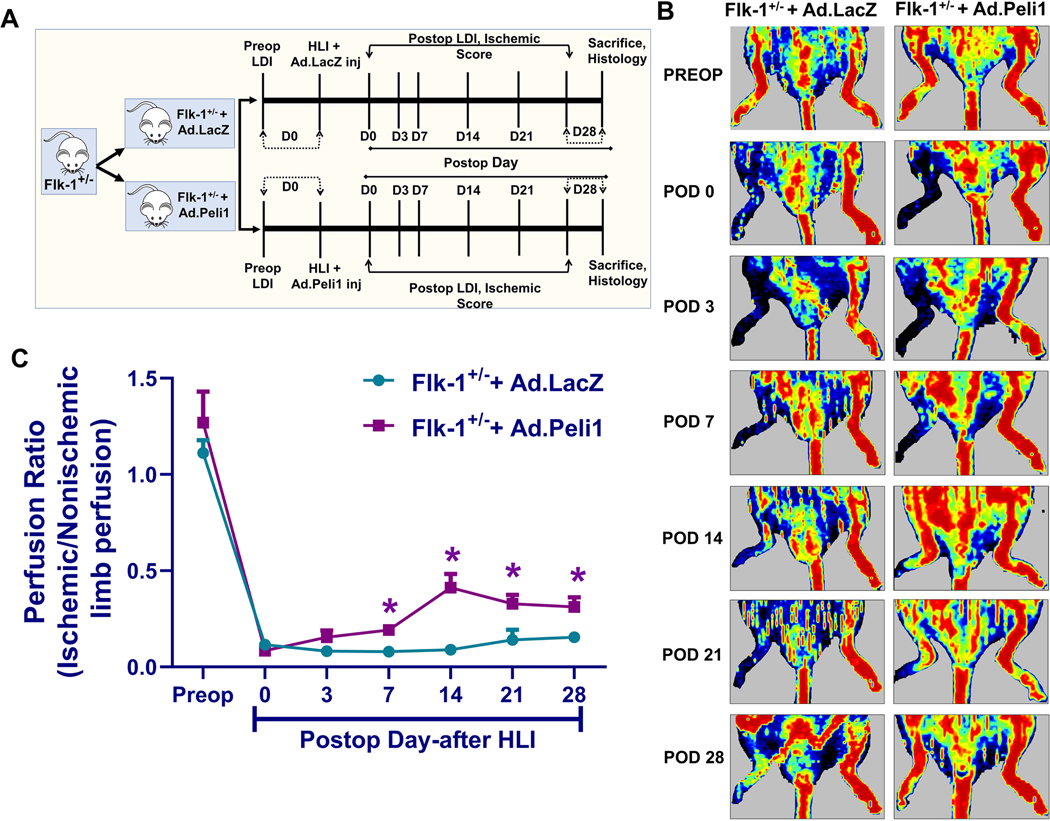
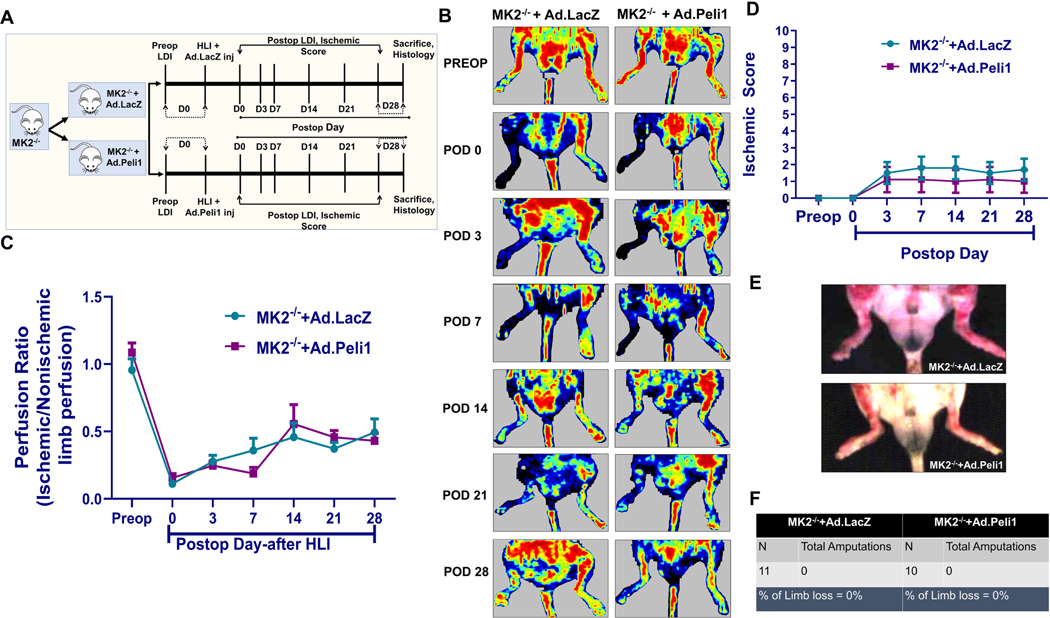
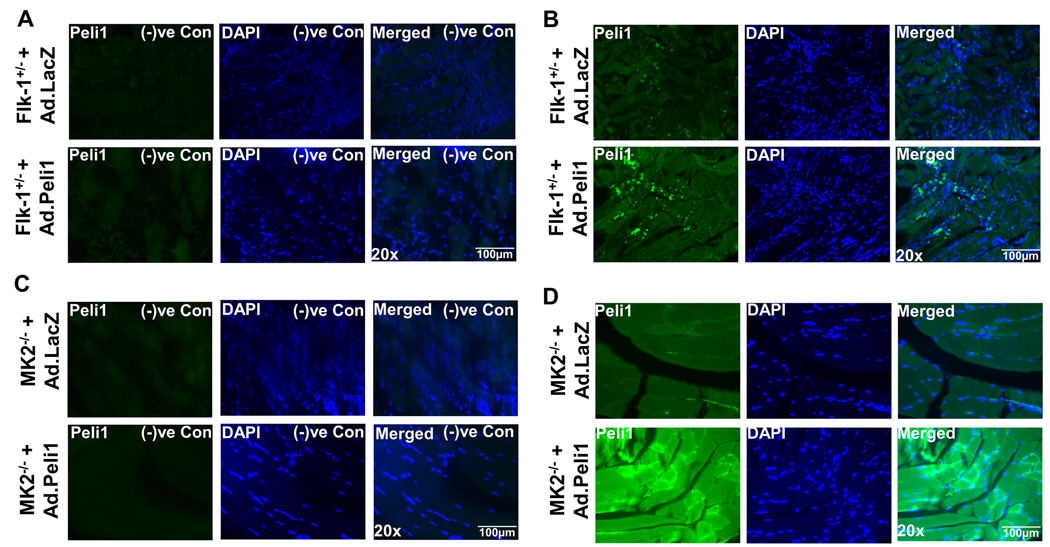
Study design and methods: Femoral artery ligation (HLI) was performed in both Flk-1+/- and MK2-/- mice along with their corresponding WT. Another set of Flk-1+/- and MK2-/- were injected with either Adeno-LacZ (Ad.LacZ) or Adeno-Peli1 (Ad.Peli1) after HLI. Hind limb perfusion was assessed by laser doppler imaging at specific time points. A standardized scoring scale is used to quantify the extent of ischemia. Histology analysis performed includes capillary density, fibrosis, pro-angiogenic and anti-apoptotic proteins.

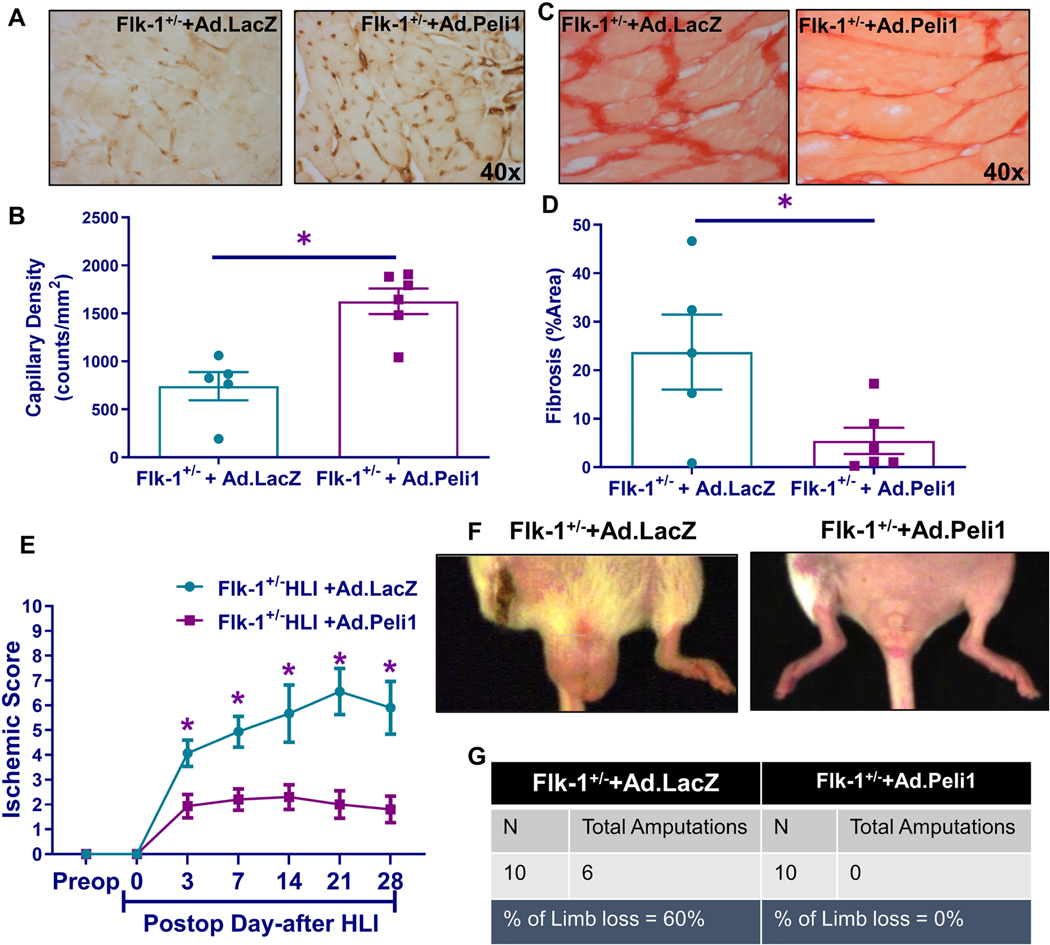
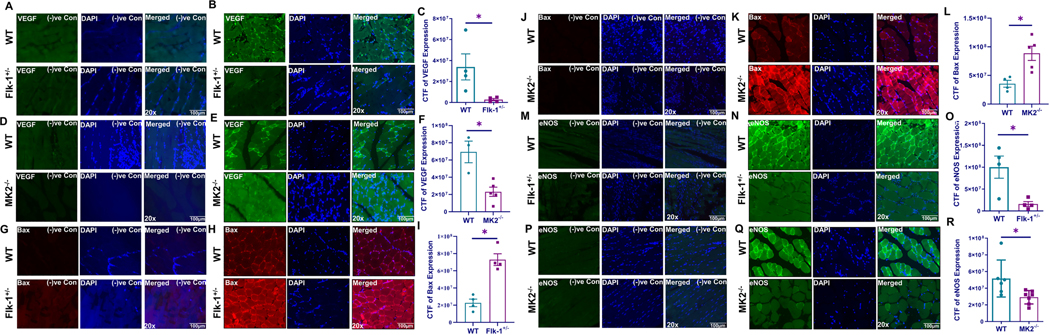
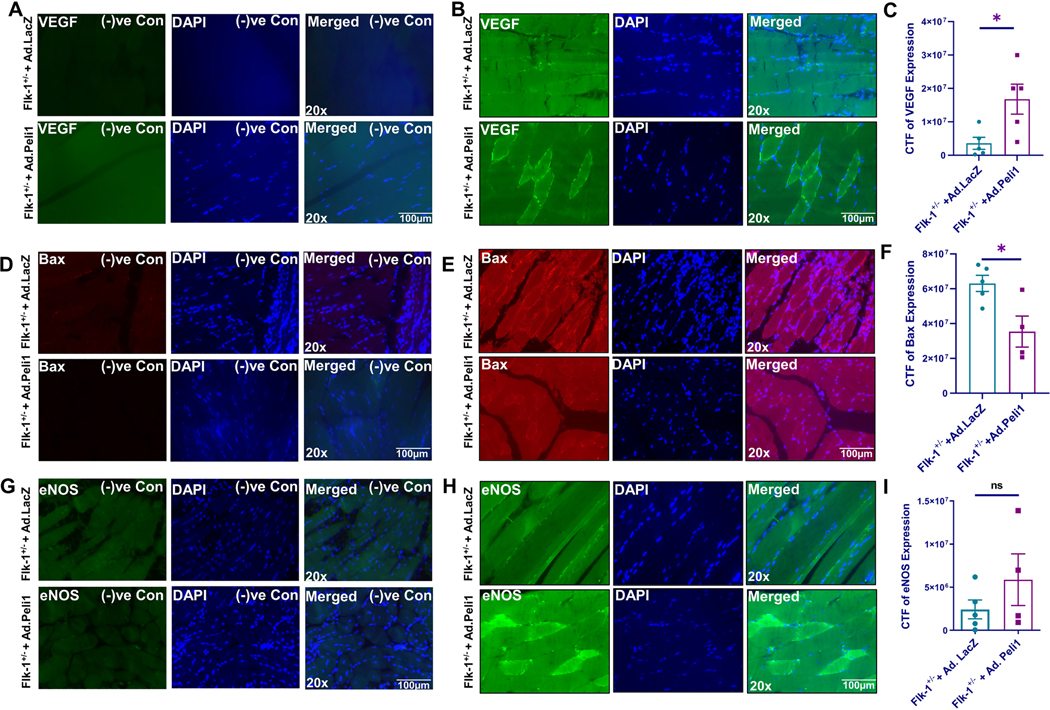
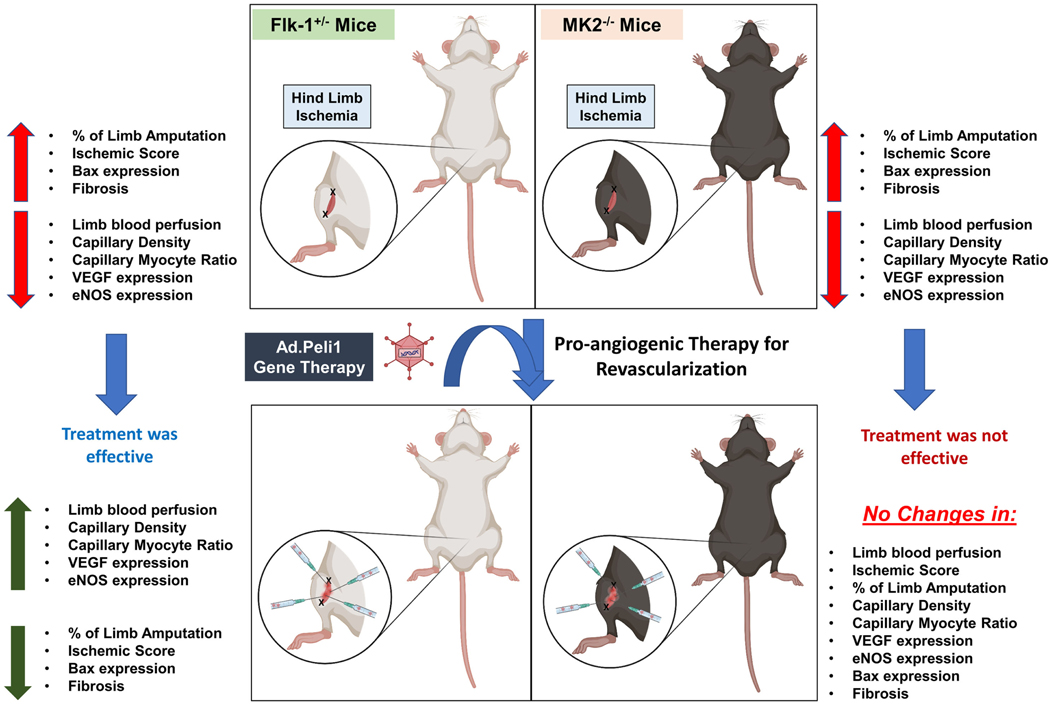
Results: Flk-1+/- and MK2-/- had a slower recovery of perfusion efficiency in the ischemic limbs than controls. Both Flk-1+/- and MK2-/- KO mice showed decreased capillary density and capillary myocyte ratios with increased fibrosis than their corresponding wild types. Ad.Peli1 injected ischemic Flk-1+/- limb showed improved perfusion, increased capillary density, and pro-angiogenic molecules with reduced fibrosis compared to Ad.LacZ group. No significant improvement in perfusion was observed in MK2-/- ischemic limb after Ad. Peli1 injection.

Conclusion: Deletion of Flk-1 and MK2 impairs neovascularization and perfusion following HLI. Treatment with Ad. Peli1 results in increased angiogenesis and improved perfusion in Flk-1+/- mice but fails to rectify perfusion in MK2 KO mice. Overall, Peli1 gene therapy is a promising candidate for the treatment of PAD.

Keywords: Hind limb ischemia; Ischemic score; Peli1; Perfusion; VEGF signaling.


Conflict of interest statement

Conflict of Interest: None

Figures

Fig 1.
Fig 1.
A) Graphical representation of experimental design showing laser doppler imaging (LDI) being performed on both limbs preoperatively, immediately after surgery, and on days 3, 7, 14, 21, and 28 on both WT and Flk-1+/− group. On postoperative day 28, animals were sacrificed, hind limb muscles were harvested from both limbs. B) Representative perfusion images from the ischemic limb of the WT group (n=14) and Flk-1+/− group (n=15) at the predetermined time points. C) Flk-1+/− mice subjected to HLI showed decreased perfusion ratio as early as day 3 and were most pronounced on day 28 when compared to WT mice. Values are mean ± S.E.M; [(Preop: p=0.1383, Unpaired t-test, Two-tailed); (Postop Day 0: p=0.3375, Unpaired t-test, Twotailed); (Postop Day 3: *p=0.0105, Unpaired t-test, Two-tailed); (Postop Day 7: p=0.0245, Unpaired t-test, Two-tailed); (Postop Day 14: p=0.1320, Mann–Whitney U test, Two-tailed); (Postop Day 21: *p=0.0469, Mann–Whitney U test, Two-tailed); (Postop Day 28: *p=0.0022, Mann–Whitney U test, Two-tailed)]. D) Representative picture shows Flk-1 negative control (no primary antibody) staining (GFP: Gain-18, Exposure-100; DAPI: Gain-6, Exposure-80). E) Representative picture showing Flk-1 staining in Flk-1+/− mice limb tissue compared to WT mice (GFP: Gain-18, Exposure-100; DAPI: Gain-6, Exposure-100). F) Graphical representation Flk-1 expression in both WT and Flk-1+/− mice showed decreased levels of Flk-1 expression in Flk-1+/− mice when compared to WT mice (n=5). Values are mean ± S.E.M; *p=0.0498, Unpaired t-test, Two-tailed.
Fig 2:
Fig 2:
A) Graphical representation of experimental design showing laser doppler imaging (LDI) being performed on both limbs preoperatively, immediately after surgery, and on days 3, 7, 14, 21, and 28 both WT and MK2−/− group. At postoperative day 28, animals were sacrificed, hind limb muscles were harvested from both limbs. B) Representative perfusion images from the ischemic limb of the WT group (n=9–10) and MK2−/− group (n=12–16) at the predetermined time points. C) MK2−/− mice subjected to HLI showed decreased perfusion ratio as early as day 3 and most pronounced on day 28 when compared to WT mice. Values are mean ± S.E.M; [(Preop: p=0.1945, Unpaired t-test, Two-tailed); (Postop Day 0: *p=0.0974, Mann-Whitney U test, Two-tailed); (Postop Day 3: *p=0.0001, Unpaired t-test, Two-tailed); (Postop Day 7: *p<0.0001, Unpaired t-test, Two-tailed); (Postop Day 14: p=*0.0008, Unpaired t-test, Two-tailed); (Postop Day 21: *p=0.0001, Unpaired t-test, Two-tailed); (Postop Day 28: *p=0.0010, Unpaired t-test, Two-tailed)]. D) Representative picture shows MK2 negative control (no primary antibody) staining (GFP: Gain-18, Exposure-100; DAPI: Gain-6, Exposure-80). E) Representative picture showing MK2 staining in MK2−/− mice limb tissue compared to WT mice (GFP: Gain-18, Exposure-100; DAPI: Gain-6, Exposure-80). F) Graphical representation of MK2 expression in both WT and MK2−/− mice showed decreased levels of MK2 expression in MK2−/− mice when compared to WT mice (n=5). Values are mean ± S.E.M; *p<0.0001, Unpaired t-test, Two-tailed.
Fig 3.
Fig 3.
A) Graphical representation of experimental design showing laser doppler imaging (LDI) being performed on both limbs preoperatively, immediately after surgery, and on days 3, 7, 14, 21, and 28 on Flk-1+/− mice subjected to HLI and further treated both Ad.LacZ and Ad.Peli1. At postoperative day 28, animals were sacrificed, hind limb muscles were harvested from both limbs. B) Representative perfusion images from the ischemic limb of Flk-1+/− mice treated with Ad.LacZ (n=9–15) and Ad.Peli1 (n=9–15) at the predetermined time points. C) Perfusion ratios in Flk-1+/− mice treated with Ad. Peli1 shows statistically significant improvement of perfusion ratio from postoperative day 7 and continues to improve until day 28 compared to WT mice. Values are mean ± S.E.M; [(Preop: p=0.5907, Mann–Whitney U test, Two-tailed); (Postop Day 0: p=0.1607, Mann–Whitney U test, Two-tailed); (Postop Day 3: p=0.0675, Mann–Whitney U test, Two-tailed); (Postop Day 7: *p=0.0015, Unpaired t-test, Two-tailed); (Postop Day 14: p=*0.0009, Unpaired t-test, Two-tailed); (Postop Day 21: *p=0.0160, Unpaired t-test, Twotailed); (Postop Day 28: *p=0.0029, Mann–Whitney U test, Two-tailed)].
Fig 4.
Fig 4.
A) Graphical representation of experimental design showing laser doppler imaging (LDI) being performed on both limbs preoperatively, immediately after surgery, and on days 3, 7, 14, 21, and 28 on MK2−/− mice subjected to HLI and further treated both Ad.LacZ and Ad.Peli1. At postoperative day 28, animals were sacrificed, hind limb muscles were harvested from both limbs. B) Representative perfusion images from the ischemic limb of MK2−/− mice treated with Ad.LacZ (n=11) and Ad.Peli1 (n=10) at the predetermined time points. C) There is no significant difference observed between perfusion ratios in MK2−/− mice treated with Ad.LacZ and Ad. Peli1. Values are mean ± S.E.M; [(Preop: p=0.2568, Unpaired t-test, Two-tailed); (Postop Day 0: p=0.2050, Unpaired t-test, Two-tailed); (Postop Day 3: p=0.5972, Unpaired t-test, Two-tailed); (Postop Day 7: p=01.463, Unpaired t-test, Two-tailed); (Postop Day 14: p=0.5832, Unpaired ttest, Two-tailed); (Postop Day 21: p=0.3969, Mann–Whitney U test, Two-tailed); (Postop Day 28: p=0.6168, Unpaired t-test, Two-tailed)]. D) MK2−/− mice treated with Ad.Peli1 or Ad.LacZ after HLI shows no significant difference in ischemic score up to 28 days post-HLI. Values are mean ± S.E.M.; [ (Postop Day 3: p=0.7002, Unpaired t-test, Two-tailed); (Postop Day 7: p=0.5053, Unpaired t-test, Two-tailed); (Postop Day 14: p=0.4174, Unpaired t-test, Two-tailed); (Postop Day 21: p=0.7058, Unpaired t-test, Two-tailed); (Postop Day 28: p=0.4677, Unpaired ttest, Two-tailed)]. E-F) Representative photographs MK2−/− mice after HLI followed by Ad.LacZ and Ad.Peli1 treatment. MK2−/− mice injected with Ad.LacZ or Ad.Peli1 did not suffer from any limb amputations (n=10–11).
Fig 5.
Fig 5.
A) Representative micrograph of the ischemic limb in Flk-1+/− mice showed decreased capillary density compared to WT mice. B) Graphical representation of capillary density count between two groups, showing statistically significant reduction in capillary density in Flk-1+/− mice compared to WT mice (n=4–5). Values are mean ± S.E.M; *p=0.0047, Unpaired t-test, Two-tailed. C) Graphical representation of capillary-to-myocyte ratio showing a similar reduction in Flk-1+/− mice compared to corresponding WT (n=4–5). Values are mean ± S.E.M; *p=0.0008, Unpaired t-test, Two-tailed. D-E) Picrosirius red staining demonstrates increased fibrosis in Flk-1+/− mice compared to WT mice (n=5). Values are mean ± S.E.M; *p<0.0001, Unpaired t-test, Two-tailed. F) Flk-1+/− mice showed increased ischemic scores than WT mice, reaching statistical significance on day 14 (*p=0.0417, Unpaired t-test, Two-tailed) and day 28 (*p=0.0484, Unpaired t-test, Two-tailed) (n=14). G-H) Representative photographs of WT mice and Flk-1+/−mice following HLI. The amputation rate in Flk-1+/− group is 28.6%, whereas no WT mice suffered limb loss following surgery (n=14). I) Representative micrograph of the ischemic limb in MK2−/− mice showing decreased capillary density as compared to WT mice. J) Graphical representation of capillary density count between two groups, showing statistically significant reduction in capillary density in MK2−/− mice compared to WT mice (n=5). Values are mean ± S.E.M; *p<0.0001, Unpaired t-test, Two-tailed. K) Graphical representation of capillary-to-myocyte ratio showing a similar reduction in MK2−/− mice compared to corresponding WT (n=5). Values are mean ± S.E.M; *p<0.0001, Unpaired t-test, Two-tailed. L-M) Picrosirius red staining demonstrates increased fibrosis in MK2−/− mice compared to WT (n=5). Values are mean ± S.E.M; *p=0.0003, Unpaired t-test, Two-tailed. N) MK2−/− mice show increased ischemic scores than WT mice, reaching statistical significance on days 14 (*p=0.0307, Unpaired t-test, Twotailed), 21 (*p=0.0401, Unpaired t-test, Two-tailed), and 28 (*p=0.0307, Unpaired t-test, Two-tailed), (n=10–16). O-P) Representative photographs of WT mice and MK2−/− mice following HLI. In both groups, no animals suffered limb loss. Values are mean ± S.E.M; *p<0.05.
Fig 6.
Fig 6.
A) Representative micrograph of the ischemic limb in Flk-1+/− mice showing decreased capillary density in mice treated with Ad.LacZ compared to those treated with Ad.Peli1. B) Graphical representation of capillary density count between two groups, showing a statistically significant increase in capillary density in the group treated with Ad.Peli1 (n=5–6). Values are mean ± S.E.M; *p=0.0016, Unpaired t-test, Two-tailed. C-D) Picrosirius red staining demonstrates a reduction in fibrosis in Ad.Peli1 treated mice compared to Ad.LacZ group (n=5–6). Values are mean ± S.E.M; *p=0.0389, Unpaired t-test, Two-tailed. E) Flk-1+/− mice treated with Ad.Peli1 after HLI shows significant improvement in the ischemic score as early as day 3 (*p=0.0056, Unpaired t-test, Two-tailed), with its effect lasting up to day 28 (*p=0.0028, Unpaired t-test, Two-tailed). F-G) Representative photographs Flk-1+/− mice after HLI followed by Ad.LacZ and Ad.Peli1 treatment. Flk-1+/−Ad.LacZ group has a limb loss rate of 60%, whereas none from Ad.Peli1 group suffered limb loss (n=10–15).
Fig 7.
Fig 7.
A) Representative picture shows Peli1 negative control (no primary antibody) staining in Flk-1+/− injected with Ad.LacZ or Ad.Peli1 treatment (GFP: Gain-17, Exposure-150; DAPI: Gain-7, Exposure-100). B) Representative digital micrograph showing the increased level of Peli1 expression in Flk-1+/− mice subjected to HLI followed by Ad.LacZ or Ad.Peli1 injection (GFP: Gain-17, Exposure-150; DAPI: Gain-7, Exposure-100), (n=6). C) Representative picture shows Peli1 negative control (no primary antibody) staining in MK2−/− mice injected with Ad.LacZ or Ad.Peli1 treatment (GFP: Gain-17, Exposure-150; DAPI: Gain-7, Exposure-100). D) Representative digital micrograph showing the increased level of Peli1 expression in MK2−/− mice subjected to HLI followed by Ad.LacZ or Ad.Peli1 injection (GFP: Gain-17, Exposure-150; DAPI: Gain-7, Exposure-100), (n=3).
Fig 8.
Fig 8.
A) Representative picture shows VEGF negative control (no primary antibody) staining in both WT and Flk-1+/− mice (GFP: Gain-17, Exposure-250; DAPI: Gain-8, Exposure-100). (B-C) Representative digital micrograph (GFP: Gain-17, Exposure-250; DAPI: Gain-8, Exposure-100) (B) and a bar graph (C) showing the suppressed level of VEGF in Flk-1+/− mice subjected to HLI compared to WT mice (n=4). Values are mean ± S.E.M; *p=0.0464, Unpaired t-test, Two-tailed. D) Representative picture shows VEGF negative control (no primary antibody) staining in both WT and MK2−/− mice (GFP: Gain-17, Exposure-250; DAPI: Gain-8, Exposure-100). E-F) Representative digital micrograph (E) (GFP: Gain-17, Exposure-250; DAPI: Gain-8, Exposure100) and a bar graph (F) showing the suppressed level of VEGF in MK2−/− mice subjected to HLI compared to WT mice (n=3–5). Values are mean ± S.E.M; *p=0.0073, Unpaired t-test, Twotailed. G) Representative picture shows Bax negative control (no primary antibody) staining in both WT and Flk-1+/− mice (RFP: Gain-17, Exposure-200; DAPI: Gain-13, Exposure-30). H-I) Representative digital micrograph (RFP: Gain-17, Exposure-200; DAPI: Gain-13, Exposure-30) (H) and a bar graph (I) showing the increased level of Bax in Flk-1+/− mice subjected to HLI compared to WT mice (n=4). Values are mean ± S.E.M; *p=0.0008, Unpaired t-test, Two-tailed. J) Representative picture shows Bax negative control (no primary antibody) staining in both WT and MK2−/− mice (RFP: Gain-17, Exposure-200; DAPI: Gain-13, Exposure-30). (K-L) Representative digital micrograph (RFP: Gain-17, Exposure-200; DAPI: Gain-13, Exposure-30) (K) and a bar graph (L) showing the increased level of Bax in MK2−/− mice subjected to HLI compared to WT mice (n=4–5). Values are mean ± S.E.M; *p=0.0095, Unpaired t-test, Twotailed. M) Representative picture shows eNOS negative control (no primary antibody) staining in both WT and Flk-1+/− mice (GFP: Gain-17, Exposure-250; DAPI: Gain-8, Exposure-100). (N-O) Representative digital micrograph (GFP: Gain-17, Exposure-250; DAPI: Gain-8, Exposure-100) (N) and a bar graph (O) showing the suppressed level of eNOS in Flk-1+/− mice subjected to HLI compared to WT mice (n=4). Values are mean ± S.E.M; *p=0.0175, Unpaired t-test, Two-tailed. P) Representative picture shows eNOS negative control (no primary antibody) staining in both WT and MK2−/− mice (GFP: Gain-17, Exposure-250; DAPI: Gain-8, Exposure-100). (Q-R) Representative digital micrograph (GFP: Gain-17, Exposure-250; DAPI: Gain-8, Exposure-100) (Q) and a bar graph (R) showing the suppressed level of eNOS in MK2−/− mice subjected to HLI compared to WT mice (n=6–7). Values are mean ± S.E.M; *p=0.0291, Unpaired t-test, Two-tailed.
Fig 9.
Fig 9.
A) Representative picture shows VEGF negative control (no primary antibody) staining in Flk-1+/− injected with Ad.LacZ or Ad.Peli1 treatment (GFP: Gain-17, Exposure-250; DAPI: Gain-8, Exposure-100). (B-C) Representative digital micrograph (GFP: Gain-17, Exposure-250; DAPI: Gain-8, Exposure-100) (B) and a bar graph (C) show the increased VEGF level in Flk-1+/− + Ad.Peli1 group compared to Flk-1+/− + Ad.LacZ group (n=5). Values are mean ± S.E.M; *p=0.0260, Unpaired t-test, Two-tailed. D) Representative picture shows Bax negative control (no primary antibody) staining in Flk-1+/− injected with Ad.LacZ or Ad.Peli1 treatment (RFP: Gain-17, Exposure-200; DAPI: Gain-13, Exposure-30). (E-F) Representative digital micrograph (RFP: Gain-17, Exposure-200; DAPI: Gain-13, Exposure-30) (E) and a bar graph (F) showing the decreased level of Bax in Flk-1+/− + Ad.Peli1 group compared to Flk-1+/− + Ad.LacZ group (n=4–5). Values are mean ± S.E.M; *p=0.0216, Unpaired t-test, Two-tailed. G) Representative picture shows eNOS negative control (no primary antibody) staining in Flk-1+/− injected with Ad.LacZ or Ad.Peli1 treatment (GFP: Gain-17, Exposure-250; DAPI: Gain-8, Exposure-100). (H-I) Representative digital micrograph (GFP: Gain-17, Exposure-250; DAPI: Gain-8, Exposure-100) (H) and a bar graph (I) showing the increased level of eNOS in Flk-1+/− + Ad.Peli1 group compared to Flk-1+/− + Ad.LacZ group (n=4–5). Values are mean ± S.E.M; p=0.2739, Unpaired t-test, Two-tailed.
Fig 10.
Fig 10.
Schematic diagram showing the overall effect achieved by Peli1 gene therapy to ischemic limbs of Flk-1+/− and MK2−/− mice (created with Biorender.com).

Similar articles

Cited by

References

    1. Asahara T, et al., 1998. Tie2 receptor ligands, angiopoietin-1 and angiopoietin-2, modulate VEGF-induced postnatal neovascularization. Circ Res. 83, 233–40. - PubMed
    1. Banai S, et al., 1994. Angiogenic-induced enhancement of collateral blood flow to ischemic myocardium by vascular endothelial growth factor in dogs. Circulation. 89, 2183–9. - PubMed
    1. Bates DO, 2010. Vascular endothelial growth factors and vascular permeability. Cardiovasc Res. 87, 262–71. - PMC - PubMed
    1. Belch J, et al., 2011. Effect of fibroblast growth factor NV1FGF on amputation and death: a randomised placebo-controlled trial of gene therapy in critical limb ischaemia. Lancet. 377, 1929–37. - PubMed
    1. Brenes RA, et al., 2012. Toward a mouse model of hind limb ischemia to test therapeutic angiogenesis. J Vasc Surg. 56, 1669–79; discussion 1679. - PMC - PubMed

Publication types

MeSH terms

Substances