. 2022 Mar 4;38(6):1615-1623.
doi: 10.1093/bioinformatics/btac003.

MIMOSA2: a metabolic network-based tool for inferring mechanism-supported relationships in microbiome-metabolome data

Affiliations

MIMOSA2: a metabolic network-based tool for inferring mechanism-supported relationships in microbiome-metabolome data

Cecilia Noecker et al. Bioinformatics. .

Abstract

Motivation: Recent technological developments have facilitated an expansion of microbiome-metabolome studies, in which samples are assayed using both genomic and metabolomic technologies to characterize the abundances of microbial taxa and metabolites. A common goal of these studies is to identify microbial species or genes that contribute to differences in metabolite levels across samples. Previous work indicated that integrating these datasets with reference knowledge on microbial metabolic capacities may enable more precise and confident inference of microbe-metabolite links.

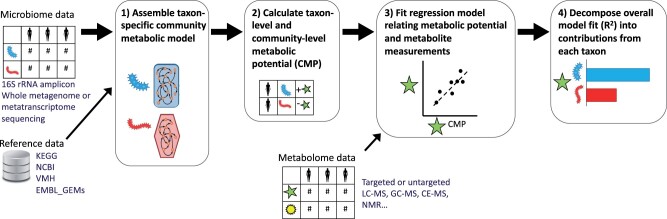
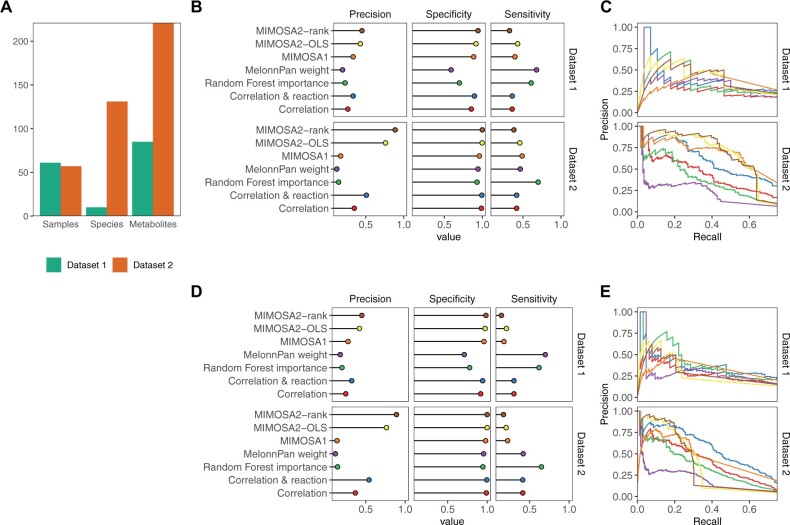
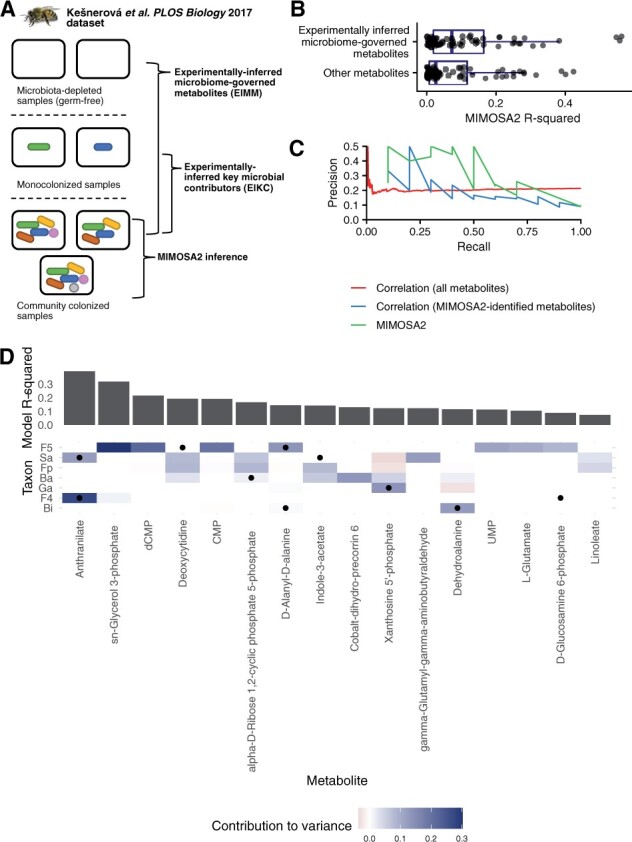
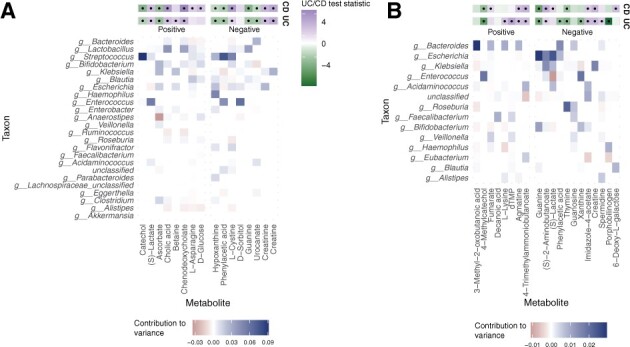
Results: We present MIMOSA2, an R package and web application for model-based integrative analysis of microbiome-metabolome datasets. MIMOSA2 uses genomic and metabolic reference databases to construct a community metabolic model based on microbiome data and uses this model to predict differences in metabolite levels across samples. These predictions are compared with metabolomics data to identify putative microbiome-governed metabolites and taxonomic contributors to metabolite variation. MIMOSA2 supports various input data types and customization with user-defined metabolic pathways. We establish MIMOSA2's ability to identify ground truth microbial mechanisms in simulation datasets, compare its results with experimentally inferred mechanisms in honeybee microbiota, and demonstrate its application in two human studies of inflammatory bowel disease. Overall, MIMOSA2 combines reference databases, a validated statistical framework, and a user-friendly interface to facilitate modeling and evaluating relationships between members of the microbiota and their metabolic products.

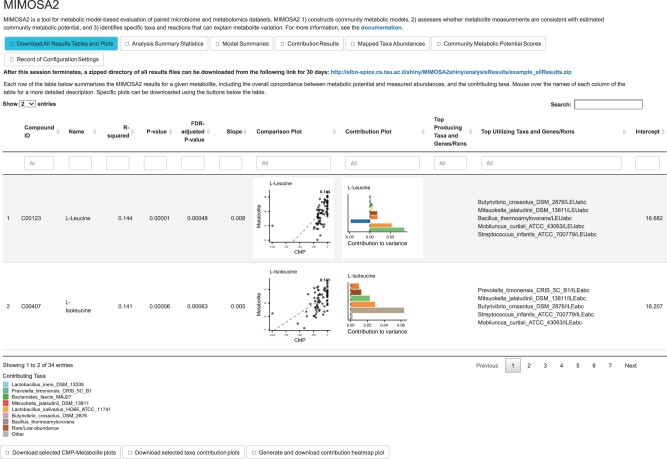
Availability and implementation: MIMOSA2 is implemented in R under the GNU General Public License v3.0 and is freely available as a web server at http://elbo-spice.cs.tau.ac.il/shiny/MIMOSA2shiny/ and as an R package from http://www.borensteinlab.com/software_MIMOSA2.html.

Supplementary information: Supplementary data are available at Bioinformatics online.


Figures

Fig. 1.
Fig. 1.
Summary of the MIMOSA2 analysis pipeline. In a MIMOSA2 analysis, microbiome data features are first linked to pre-processed reference databases to construct a community metabolic model describing the predicted metabolic reaction capabilities of each community member taxon (Step 1). Next, this network model is combined with microbiome feature abundances to calculate CMP scores for each metabolite, taxon and sample, representing the approximate relative capacity to synthesize or utilize that metabolite (Step 2). Total CMP scores for each metabolite are linked to metabolomics measurements using a regression model (Step 3). For metabolites with a significant relationship between concentration and potential, the specific taxonomic contributors to each metabolite are then analyzed (Step 4)
Fig. 2.
Fig. 2.
An example contribution analysis of hypothetical metabolite M. (A) In this toy example, metabolite M is produced by two taxa and utilized by a third. (B) Overview of CMP scores and metabolite measurements for metabolite M across a dataset of six samples. Taxon-level CMP scores are based on the estimated ability of each species to synthesize/utilize the metabolite and on the abundance of the taxon in the sample. (C) Comparison of CMP scores and measurements of M across this dataset. The solution found by OLS regression is affected more strongly by the outlier samples D and F than that found by rank-based regression. (D) Final summary contribution plot for metabolite M using the rank-based regression option. The bars represent the contributions to metabolite variance explained by each taxon. Most of the variance is attributed to differences in the amount of utilization of M by Taxon 3 across samples, reflecting the larger variability in Taxon 3’s CMP scores shown in panel (B)
Fig. 3.
Fig. 3.
Interactive results interface for the MIMOSA2 web application. In addition to making all processed results available for download, the application displays an interactive table in which each row summarizes the results for a single metabolite. The best-predicted metabolites are shown first, along with associated information including model statistics, plots of the data and top contributors and lists of the top contributing taxa and reactions predicted via both synthesis and utilization
Fig. 4.
Fig. 4.
Identification of key microbe–metabolite contributions by MIMOSA2 from simulated datasets. (A) Descriptive summary statistics for the two simulated datasets analyzed, including number of samples, species and metabolites included. (B) Precision, specificity and sensitivity of MIMOSA2 analysis for recovering true key microbial contributors to metabolite variation from metabolites identified as potentially microbiome-governed by MIMOSA2 in two simulated datasets, compared with correlation-based approaches, MIMOSA version 1, MelonnPan L1 linear models (Mallick et al., 2019) and feature importance from a cross-validated random forest regression (RF) (Muller et al., 2021). Standard thresholds were used to designate contributors for each method (correlation: 0.01 q-value, MIMOSA2: 5% contribution, MIMOSA1: correlation >0.25 and q-value <0.1, MelonnPan: non-zero model weight, RF: Altman P-value <0.1). (C) Precision-recall curves for identifying key contributors for the same set of metabolites in simulated Datasets 1 and 2 as in panel (B), by MIMOSA2 and the same alternative correlation-based methods. Colors for each method are the same as labeled in panel (B). (D) Precision, specificity and sensitivity of MIMOSA2 analysis for recovering true key microbial contributors to metabolite variation [as in panel (B)], but for all metabolites. All thresholds are the same as above. (E) Precision-recall curves for identifying key taxon–metabolite contributors in simulated Datasets 1 and 2, as in panel (C), but for all metabolites
Fig. 5.
Fig. 5.
Partial overlap between MIMOSA2 results and experimental inferences in honeybee gut microbiota. (A) Summary of experiments from Kešnerová et al. (2017) reanalyzed here. MIMOSA2 was applied to a dataset of 18 samples from community-colonized bees, and its results were compared with inferences from metabolomics of microbiota-depleted (germ-free) bees and bees monocolonized with individual bacterial strains. (B) Experimentally inferred microbial metabolites in 11-strain communities are significantly better predicted by MIMOSA2 than other metabolites. (C) MIMOSA2 identifies experimentally inferred microbial contributors with higher precision and recall than microbe–metabolite correlation analysis. (D) Metabolite-level comparison of experimentally inferred and MIMOSA2-inferred microbial key contributors. Cell color indicates a microbe’s contribution to variance in a metabolite as inferred by MIMOSA2; black dots indicate experimentally inferred contributors based on metabolomics of monocolonized samples. Metabolites shown are microbiome-governed as determined by the MIMOSA2 model. Ba, Bartonella apis; Bi, Bifidobacterium asteroides; F4, Lactobacillus Firm-4; F5, Lactobacillus Firm-5; Fp, Frischella perrara; Ga, Gilliamella apicola; Sa, Snodgrassella alvi
Fig. 6.
Fig. 6.
Taxonomic contributors to microbiome-governed metabolites in two studies of IBD. (A) Heatmap of genus-level microbial contributors to fecal metabolites identified by MIMOSA2-OLS in Franzosa et al. (2018). The upper two bars show the association of each metabolite with Crohn’s disease (CD) and/or ulcerative colitis (UC), with a black dot indicating a significant association (FDR-adjusted P<0.1). Metabolites with a false discovery rate-adjusted P-value <0.25 are shown. (B) Heatmap of genus-level microbial contributors to fecal metabolites in IBDMDB Investigators et al. (2019). As in panel (A), the upper two bars show association with CD and UC (same color scale), and metabolites with an FDR-adjusted P-value <0.25 are shown

References

    1. Adamovsky O. et al. (2020) Evaluation of microbiome-host relationships in the zebrafish gastrointestinal system reveals adaptive immunity is a target of bis(2-ethylhexyl) phthalate (DEHP) exposure. Environ. Sci. Technol., 54, 5719–5728. - PubMed
    1. Baldini F. et al. (2018) The Microbiome Modeling Toolbox: from microbial interactions to personalized microbial communities. Bioinformatics, 35, 2332–2334. - PMC - PubMed
    1. Bauer E. et al. (2015) Phenotypic differentiation of gastrointestinal microbes is reflected in their encoded metabolic repertoires. Microbiome, 3, 55. - PMC - PubMed
    1. Beghini F. et al. (2021) Integrating taxonomic, functional, and strain-level profiling of diverse microbial communities with bioBakery 3. Elife, 10, e65088. - PMC - PubMed
    1. Bourgonje A.R. et al. (2020) Oxidative stress and redox-modulating therapeutics in inflammatory bowel disease. Trends Mol. Med., 26, 1034–1046. - PubMed

Publication types