. 2022 Aug;71(8):1837-1849.
doi: 10.1007/s00262-021-03088-y. Epub 2022 Jan 9.

Combination immunotherapy including OncoVEXmGMCSF creates a favorable tumor immune micro-environment in transgenic BRAF murine melanoma

Affiliations

Combination immunotherapy including OncoVEXmGMCSF creates a favorable tumor immune micro-environment in transgenic BRAF murine melanoma

Robyn D Gartrell et al. Cancer Immunol Immunother. 2022 Aug.

Abstract

Talimogene Laherparepvec (OncoVEXmGMCSF), an oncolytic virus, immune checkpoint inhibitor anti-programmed cell death protein 1 (anti-PD1), and BRAF inhibition (BRAFi), are all clinically approved for treatment of melanoma patients and are effective through diverse mechanisms of action. Individually, these therapies also have an effect on the tumor immune microenvironment (TIME). Evaluating the combination effect of these three therapies on the TIME can help determine when combination therapy is most appropriate for further study. In this study, we use a transgenic murine melanoma model (Tyr::CreER; BRAFCA/+; PTENflox/flox), to evaluate the TIME in response to combinations of BRAFi, anti-PD1, and OncoVEXmGMCSF. We find that mice treated with the triple combination BRAFi + anti-PD1 + OncoVEXmGMCSF have decreased tumor growth compared to BRAFi alone and prolonged survival compared to control. Flow cytometry shows an increase in percent CD8 + /CD3 + cytotoxic T Lymphocytes (CTLs) and a decrease in percent FOXP3 + /CD4 + T regulatory cells (Tregs) in tumors treated with OncoVEXmGMCSF compared to mice not treated with OncoVEXmGMCSF. Immunogenomic analysis at 30d post-treatment shows an increase in Th1 and interferon-related genes in mice receiving OncoVEXmGMCSF + BRAFi. In summary, treatment with combination BRAFi + anti-PD1 + OncoVEXmGMCSF is more effective than any single treatment in controlling tumor growth, and groups receiving OncoVEXmGMCSF had more tumoral infiltration of CTLs and less intratumoral Tregs in the TIME. This study provides rational basis to combine targeted agents, oncolytic viral therapy, and checkpoint inhibitors in the treatment of melanoma.

Keywords: Immunotherapy; Melanoma; Microenvironment; Oncolytic virus; Tumor-infiltrating lymphocyte.


Conflict of interest statement

Authors have no disclosures.

Figures

Fig. 1
Fig. 1
Study Timeline & Schema. A At 6–8 weeks of age, mice with the desired genotype B were induced with tamoxifen (4-HT) pipetted onto their shaved right flank. Moles and small tumors began to develop 4–6 weeks later. Once tumor measured at least 5 mm in any dimension, the mice were randomized into one of six treatment groups C. Once on study, mice received intraperitoneal (IP) injections of isotype control 2A3 or anti-PD1 every other week on Monday, Wednesday, and Friday and intratumoral (IT) injections of OncoVEXmGMCSF or PBS every week on Monday and Friday. Mice were euthanized at 30 days and tumors were fixed and paraffin embedded (FFPE), RNA extracted and nanoString performed. Alternatively, mice were euthanized at end of study—when tumor reached 3000mm3, was > 25% ulcerated, or the mouse experienced > 20% weight loss, and/or showed signs of debility. At end of study flow cytometry was performed on lymph node, spleen and tumor
Fig. 2
Fig. 2
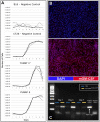
mRNA in situ Hybridization and RT-PCR Show Effective OncoVEXmGMCSF Infection in vitro and in vivo. A Proliferation assay showing number of cells over 10 days. From top to bottom, B16 – Negative Control (known resistance to OncoVEXmGMCSF), CT26 – Positive Control (known sensitivity to OncoVEXmGMCSF), and two BRAFV600E/wt PTEN−/− CDKN2−/− murine melanoma (YUMM 1.7, and YUMM 1.9) cell lines. B, top In situ GM-CSF mRNA hybridization in tumor from control B, bottom and BRAFi + anti-PD1 + OncoVEXmGMCSF (blue = DAPI, red = GM-CSF). C RT-PCR for HSV-1 Glycoprotein C (gC) gene in tumors from mice treated with either PBS (blue) or OncoVEXmGMCSF (yellow) at 1, 3, or 7 days post treatment
Fig. 3
Fig. 3
Tumor Growth and Survival Curves Comparing Treatment Groups A Mean tumor volume comparison of all mice up through 33 days. 2way ANOVA was performed comparing control (red) to BRAFi only (orange, p = 0.0033), BRAFi + anti-PD1 (yellow, p = 0.0045), BRAFi + OncoVEXmGMCSF (green, p = 0.0036), BRAFi + anti-PD1 + OncoVEXmGMCSF (blue, p = 0.0002), and anti-PD1 + OncoVEXmGMCSF (purple, p = 0.0087). B Mean tumor volume comparison of mice in groups receiving BRAFi up through 57 days. 2way ANOVA was performed comparing BRAFi alone (orange) to the other BRAFi treatment groups, BRAFi + anti-PD1 (yellow; p = 0.4705), BRAFi + OncoVEXmGMCSF (green; p = 0.5874), and BRAFi + anti-PD1 + OncoVEXmGMCSF (blue; p = 0.0141). (ns > 0.05, * ≤ 0.05, ** ≤ 0.01, *** ≤ 0.001, **** < 0.0001). C Survival comparison of mice in each treatment group using log-rank (Mantel-Cox) test. Findings show prolonged survival for BRAFi only (orange, p < 0.0001), BRAFi + anti-PD1 (yellow, p = 0.0002), BRAFi + OncoVEXmGMCSF (green, p < 0.0001), and BRAFi + anti-PD1 + OncoVEXmGMCSF (blue, p < 0.0001) groups in comparison to control mice (red). anti-PD1 + OncoVEXmGMCSF (purple) did not exhibit prolonged survival (p = 0.4527
Fig. 4
Fig. 4
Ulceration Comparing Treatment Groups. A Number of mice with tumor ulceration leading to stoppage of intratumoral injections. Number of mice receiving each treatment was evaluated using two-tailed fisher’s exact test comparing OncoVEXmGMCSF vs. no OncoVEXmGMCSF (p = 0.0003), BRAFi vs no BRAFi (p = 0.1336) and anti-PD1 vs no anti-PD1 (p = 0.4791). B Number of mice euthanized due to ulceration in each group comparing OncoVEXmGMCSF vs. no OncoVEXmGMCSF (p = 0.043), BRAFi vs no BRAFi (p = 0.8663), and anti-PD1 vs no anti-PD1 (p = 0.39). (ns > 0.05, * ≤ 0.05, ** ≤ 0.01, *** ≤ 0.001, **** < 0.0001)
Fig. 5
Fig. 5
Flow Cytometry Evaluation of Intratumoral T Cell Infiltration. A Percent of CD8 + /CD3 + Cytotoxic T lymphocytes (CTLs) comparing control (red) to BRAFi only (orange, p = 0.6943), BRAFi + anti-PD1 (yellow, p = 0.0557), BRAFi + OncoVEXmGMCSF (green, p = 0.0004), BRAFi + anti-PD1 + OncoVEXmGMCSF (blue, p = 0.0001), and anti-PD1 + OncoVEXmGMCSF (purple, p = 0.0001) B CTL infiltration was highest in groups receiving OncoVEXmGMCSF when compared to groups not receiving OncoVEXmGMCSF (p < 0.0001). C Percent of CD4 + FOXP3 + /CD4 + T-regulatory cells (Tregs) comparing control (red) to BRAFi only (orange, p = 0.6402), BRAFi + anti-PD1 (yellow, p = 0.8941), BRAFi + OncoVEXmGMCSF (green, p = 0.0082), BRAFi + anti-PD1 + OncoVEXmGMCSF (blue, p < 0.0001), and anti-PD1 + OncoVEXmGMCSF (purple, p = 0.0031). D) Treg infiltration is lowest in groups receiving OncoVEXmGMCSF when compared to groups not receiving OncoVEXmGMCSF (p < 0.0001). (ns > 0.05, * ≤ 0.05, ** ≤ 0.01, *** ≤ 0.001, **** < 0.0001)
Fig. 6
Fig. 6
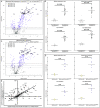
Treatment Correlates with Upregulation of Immune Related Genes. A Volcano plot shows differential expression of immune related genes in mice treated with OncoVEXmGMCSF compared with no OncoVEXmGMCSF. B Immune gene signature scores in tumors comparing groups receiving OncoVEXmGMCSF to groups not receiving OncoVEXmGMCSF including Defense response to virus (p < 0.0001), Innate Immune Response (p < 0.0001), T cell activation (p < 0.0001), and T cell differentiation (p < 0.0001). C Volcano plot shows differential expression of immune related genes in mice treated with BRAFi alone vs BRAFi + anti-PD1 + OncoVEXmGMCSF. D Immune gene signature scores in tumors comparing groups receiving OncoVEXmGMCSF to groups not receiving OncoVEXmGMCSF including Defense response to virus (p = 0.0022), Innate immune response (p = 0.002), T cell activation (p = 0.0022), and T cell differentiation (p = 0.0022). E To evaluate the effect of combining OncoVEXmGMCSF and BRAFi as compared to OncoVEXmGMCSF alone, we plotted the log2 fold change of differentially expressed genes in BRAFi + anti-PD1 + OncoVEXmGMCSF compared to BRAFi + anti-PD1 (y axis) and control + anti-PD1 + OncoVEXmGMCSF compared to BRAFi + anti-PD1 (x axis). (ns > 0.05, * ≤ 0.05, ** ≤ 0.01, *** ≤ 0.001, **** < 0.0001)

References

    1. Ascierto PA, Kirkwood JM, Grob JJ, et al. The role of BRAF V600 mutation in melanoma. J Transl Med. 2012;10:85. doi: 10.1186/1479-5876-10-85. - DOI - PMC - PubMed
    1. Dummer R, Ascierto PA, Gogas HJ, et al. Overall survival in patients with BRAF-mutant melanoma receiving encorafenib plus binimetinib versus vemurafenib or encorafenib (COLUMBUS): a multicentre, open-label, randomised, phase 3 trial. Lancet Oncol. 2018;19:1315–1327. doi: 10.1016/S1470-2045(18)30497-2. - DOI - PubMed
    1. Ascierto PA, Ferrucci PF, Fisher R, et al. Dabrafenib, trametinib and pembrolizumab or placebo in BRAF-mutant melanoma. Nat Med. 2019;25:941–946. doi: 10.1038/s41591-019-0448-9. - DOI - PubMed
    1. Huynh S, Mortier L, Dutriaux C, et al. Combined Therapy with Anti-PD1 and BRAF and/or MEK Inhibitor for Advanced Melanoma: A Multicenter Cohort Study. Cancers (Basel) 2020;12:1666. doi: 10.3390/cancers12061666. - DOI - PMC - PubMed
    1. Sun L, Funchain P, Song JM, Rayman P, Tannenbaum C, Ko J, McNamara M, Marcela Diaz-Montero C, Gastman B. Talimogene Laherparepvec combined with anti-PD-1 based immunotherapy for unresectable stage III-IV melanoma: a case series. J Immunother Cancer. 2018;6:36. doi: 10.1186/s40425-018-0337-7. - DOI - PMC - PubMed

Substances