. 2022 Aug;71(8):1989-2005.
doi: 10.1007/s00262-021-03126-9. Epub 2022 Jan 9.

Hypoxia-inducible factor-1 alpha expression is induced by IL-2 via the PI3K/mTOR pathway in hypoxic NK cells and supports effector functions in NKL cells and ex vivo expanded NK cells

Affiliations

Hypoxia-inducible factor-1 alpha expression is induced by IL-2 via the PI3K/mTOR pathway in hypoxic NK cells and supports effector functions in NKL cells and ex vivo expanded NK cells

Emily Cluff et al. Cancer Immunol Immunother. 2022 Aug.

Abstract

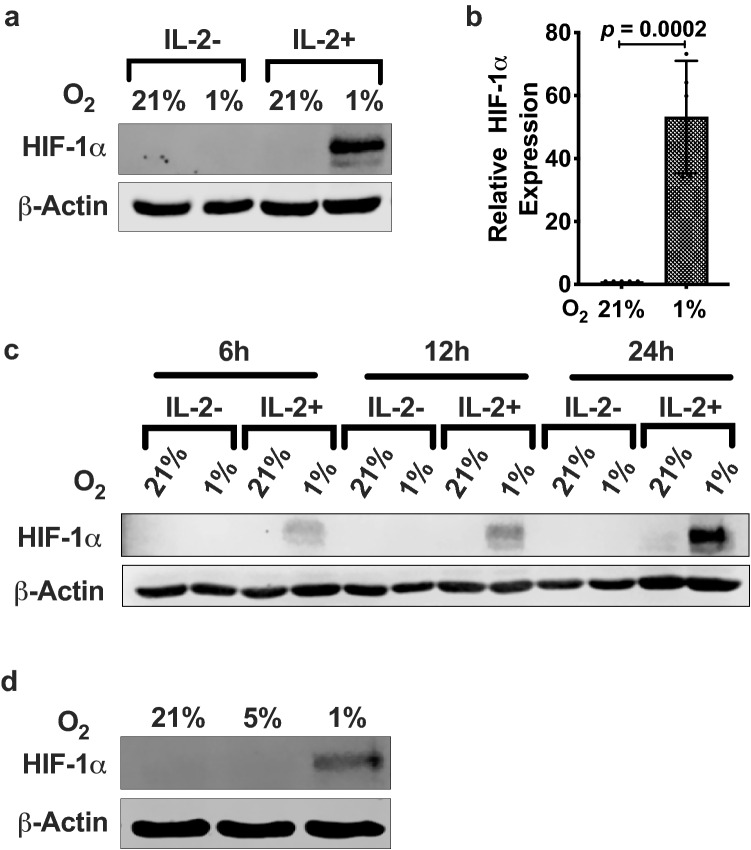
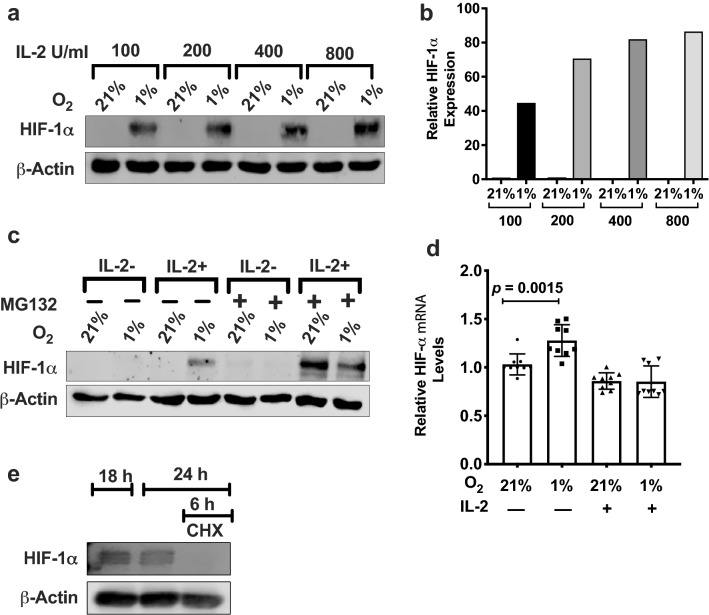
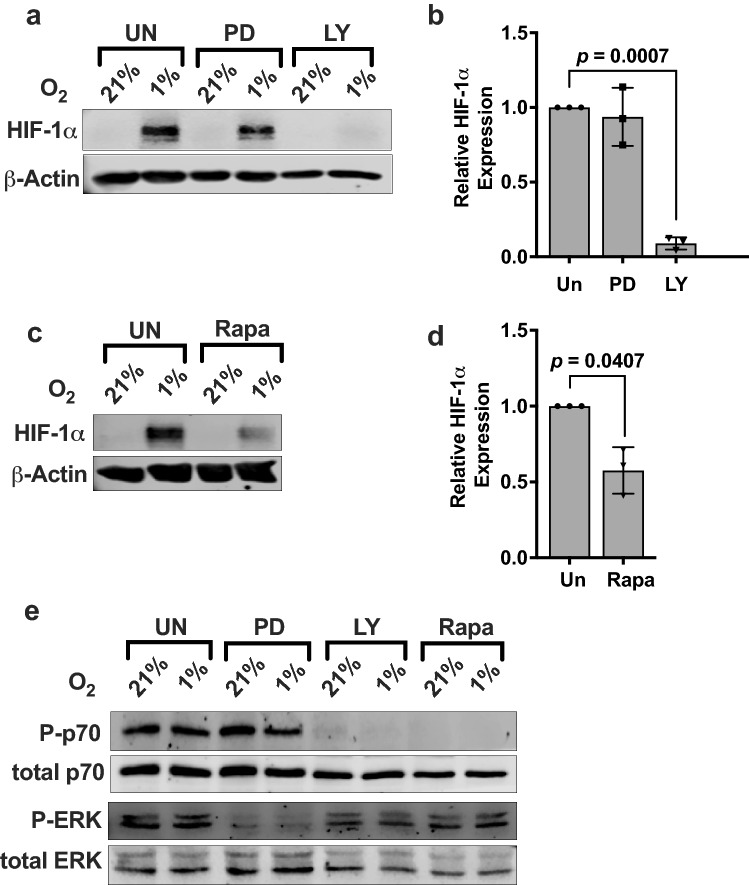
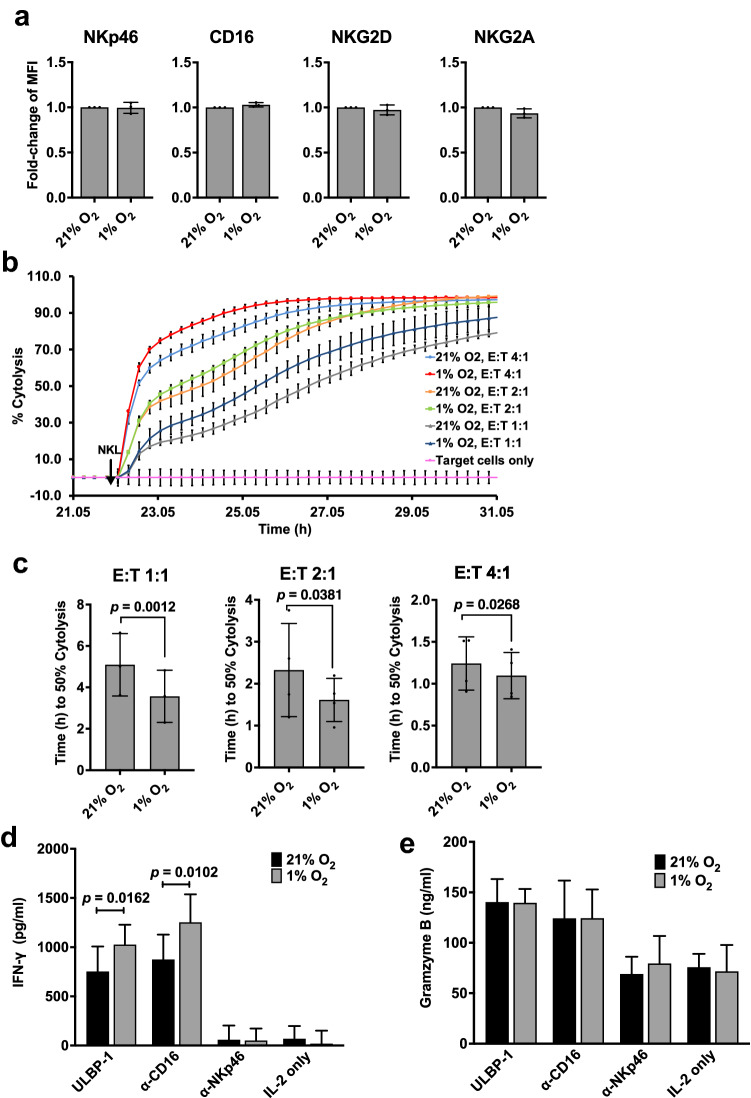
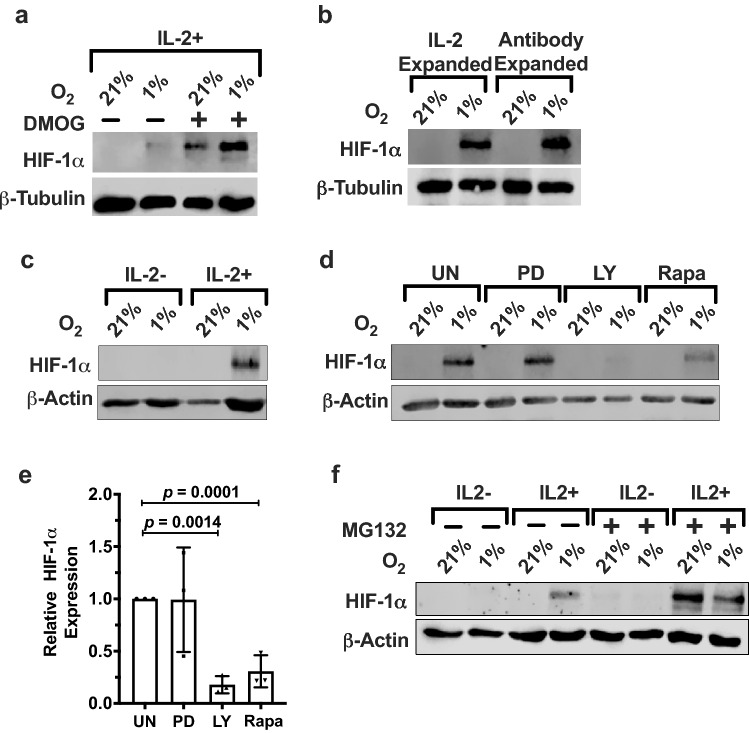
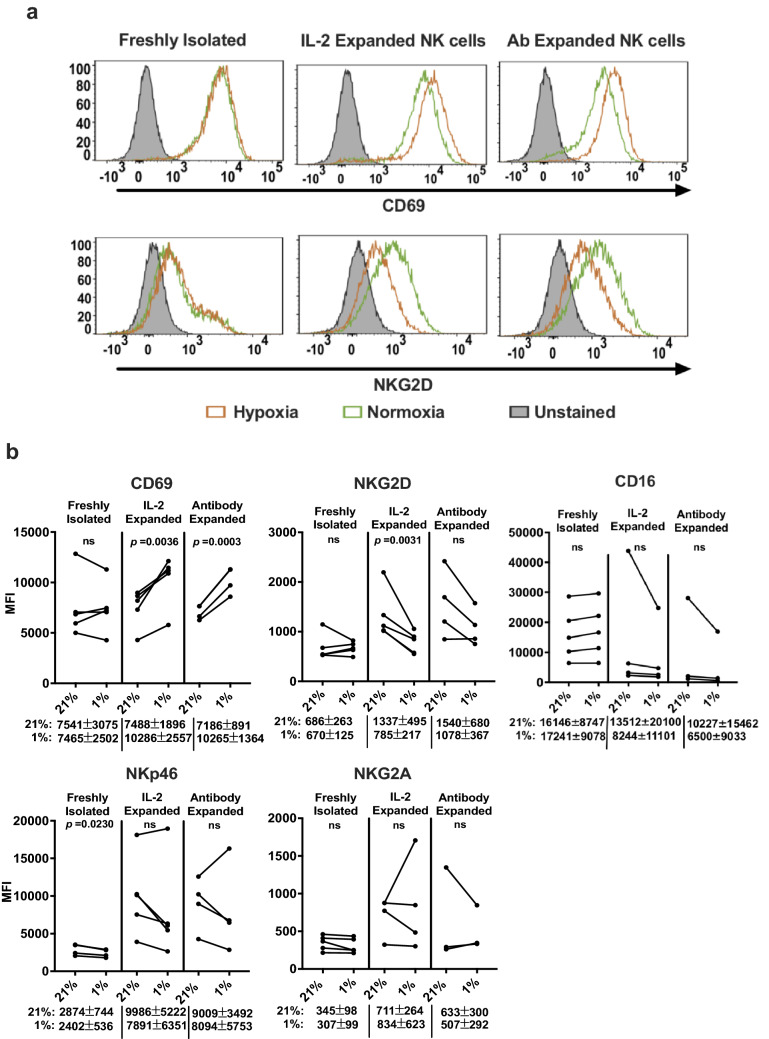
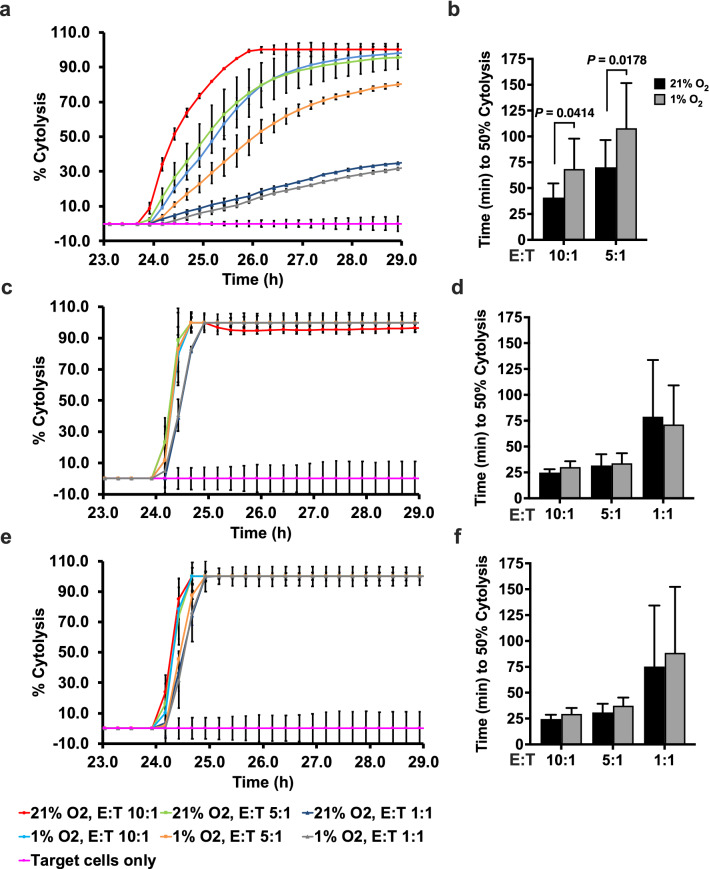
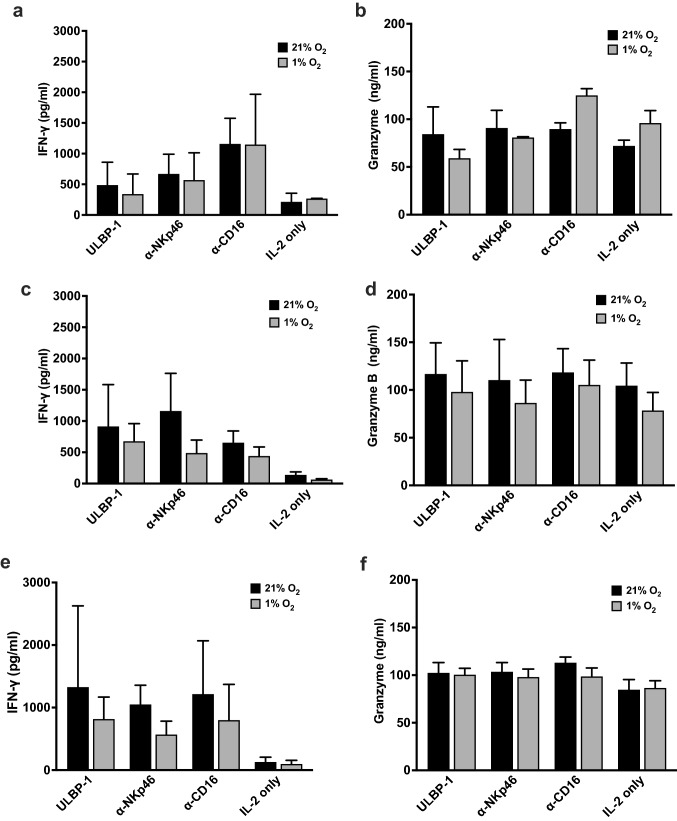
Natural killer (NK) cells are cytotoxic innate lymphocytes that are specialized to kill tumor cells. NK cells are responsive to the primary cytokine IL-2 in the tumor microenvironment (TME), to activate its effector functions against tumors. Despite their inherent ability to kill tumor cells, dysfunctional NK cells observed within advanced solid tumors are associated with poor patient survival. Hypoxia in the TME is a major contributor to immune evasion in solid tumors that could contribute to impaired NK cell function. HIF-1α is a nodal regulator of hypoxia in driving the adaptive cellular responses to changes in oxygen concentrations. Whether HIF-1α is expressed in hypoxic NK cells in the context of IL-2 and whether its expression regulates NK cell effector function are unclear. Here, we report that freshly isolated NK cells from human peripheral blood in hypoxia could not stabilize HIF-1α protein coincident with impaired anti-tumor cytotoxicity. However, ex vivo expansion of these cells restored HIF-1α levels in hypoxia to promote antitumor cytotoxic functions. Similarly, the human NK cell line NKL expressed HIF-1α upon IL-2 stimulation in hypoxia and exhibited improved anti-tumor cytotoxicity and IFN-γ secretion. We found that ex vivo expanded human NK cells and NKL cells required the concerted activation of PI3K/mTOR pathway initiated by IL-2 signaling in combination with hypoxia for HIF-1α stabilization. These findings highlight that HIF-1α stabilization in hypoxia maximizes NK cell effector function and raises the prospect of NK cells as ideal therapeutic candidates for solid tumors.

Keywords: HIF-1α; Hypoxia; IL-2; Natural killer cells.


Conflict of interest statement

The authors declare that they have no conflict of interest.

Figures

Fig. 1
Fig. 1
IL-2-induced HIF-1α protein expression in hypoxic NKL cells. a Immunoblot of HIF-1α expression. NKL cells were incubated in the absence or presence of 100 U/mL IL-2 for 24 h at 21% or 1% O2. Cells were lysed and immunoblotted for HIF-1α. β-Actin was used as the loading control. Blot is representative of > 4 independent trials. b Quantification of immunoblots presented as bar graphs are averages of four independent trials ± SEM. Statistical significance and p values were determined using the unpaired two-tailed Student’s t-test. p ≤ 0.05 is significant. c Time-dependent increase in HIF-1α protein levels. NKL cells were incubated in the absence or presence of 100 U/mL IL-2 for the indicated times at 21% or 1% O2. Cell lysates were immunoblotted for HIF-1α and β-Actin was used as the loading control. d Effect of physioxia (5% O2) on HIF-1α protein expression. IL-2-stimulated NKL cells exposed to 21%, 5%, or 1% O2 for 6 h were lysed and immunoblotted for HIF-1α. Data are representative of two independent trials
Fig. 2
Fig. 2
HIF-1α protein expression and stabilization in hypoxic NKL cells. a NKL cells were incubated in the presence or absence of the indicated concentrations of IL-2 for 24 h at 21% or 1% O2 and HIF-1α protein expression detected by immunoblotting. β-Actin was used as the loading control. b Quantification of immunoblots presented as bar graphs. Density of bands was normalized to β-actin and shown as fold difference of HIF-1α protein expression in hypoxic NK cells compared to 21% O2 with 100 U/mL IL-2. Blot is representative of two independent trials. c Immunoblot of HIF-1α protein in NKL cells incubated with or without 100 U/mL IL-2 in the presence or absence of 10 μg/mL of MG132 for 6 h at 21% or 1% O2. Blot is representative of three independent trials. d qPCR analysis for HIF-1α mRNA. NKL cells were incubated in the presence or absence of 100 U/mL IL-2 for 24 h at 21% or 1% O2 and cells processed for RNA extraction. Relative expression of HIF-1α mRNA was determined using the delta Ct method. β-Actin was used for normalization. Data are an average of three independent trials each performed in triplicates. Statistical significance and p values were determined using the unpaired Student’s t-test. p ≤ 0.05 is significant. e Immunoblot of HIF-1α protein levels in NKL cells incubated for 18 h in 1% O2 and then incubated in the presence or absence of 10 μg/mL CHX for an additional 6 h in 1% O2. β-Actin was used as loading control. Blot is representative of three independent trials
Fig. 3
Fig. 3
IL-2 mediates HIF-1α expression in NKL cells through the PI3K/mTOR signaling pathway. a IL-2-stimulated NKL cells were incubated for 24 h at 21% or 1% O2 in the presence or absence of 50 μM PD98059 (MAPK inhibitor) or 50 μM LY294002 (PI3K inhibitor). Lysates were immunoblotted for HIF-1α. β-Actin is the loading control. b Quantification of immunoblots normalized to β-actin is presented as fold difference of HIF-1α levels in 1% O2 relative to inhibited samples. Bar graph is representative of three independent experiments. c IL-2-stimulated NKL cells were incubated for 24 h at 21% or 1% O2 in the presence or absence of 10 nM rapamycin. Lysates were immunoblotted for HIF-1α. β-Actin is the loading control. d Quantification of immunoblots normalized to β-Actin is presented as fold difference of HIF-1α levels in 1% O2 relative to the inhibited sample. Bar graph is representative of three independent experiments. Statistical significance and p value between inhibitor treated and uninhibited were determined by unpaired two-tailed Student’s t-test. p ≤ 0.05 is significant. e IL-2-stimulated NKL cells exposed to 21% or 1% O2 were untreated or treated with 50 μM PD98059, 50 μM LY294002, or 10 nM rapamycin. Lysates were immunoblotted for the proteins as shown
Fig. 4
Fig. 4
NKL cells in hypoxia exhibit increased cytolytic activity and IFN-γ secretion. a Characterization of NK cell receptors on NKL cells in hypoxia. NKL cells in the presence of IL-2 were exposed to 21% or 1% O2 for 24 h. Expression of surface receptors NKG2D, NKp46, CD16 and NKG2A was analyzed by flow cytometry as described in “Materials and methods.” Fold changes in median fluorescence intensity (MFI) ± SEM of hypoxic NKL cells against normoxic NKL cells are shown (n = 3). Statistical significance was analyzed between normoxia and hypoxia by a paired two-tailed Student’s t-test. b Real-time analysis of cytolysis exhibited by hypoxia-treated NKL cells against target tumor cells. At 24 h after seeding the target DLD-1 cells, NKL cells pre-incubated in hypoxia or normoxia in the presence of IL-2 for 24 h were added to the target cells at E/T ratios of 4:1, 2:1, and 1:1. Real-time cytolysis of target cells was monitored using the xCELLigence RTCA SP system. Electrode impedance was measured and recorded as cell index. % Cytolysis was then determined using the RTCA Software Pro. One representative of three independent experiments performed in duplicates is shown. c 50% killing time (KT 50) for the same E/T ratios in b. d NKL cells incubated at 21% or 1% O2 for 24 h in the presence of IL-2 before being transferred to plates coated with ULBP-1 or anti-NKp46 or anti-CD16 antibodies, and incubations continued under same conditions for an additional 18 h. After incubation, supernatant was collected and ELISA performed to test the concentrations of IFN-γ and granzyme B. Results are reported as the mean of four independent experiments. Statistical significance was analyzed between 21% O2 and 1% O2 using two-tailed paired Student’s t-test. p ≤ 0.05 is significant
Fig. 5
Fig. 5
Ex vivo expanded PBMC NK cells express HIF-1α protein in the presence of IL-2. a Freshly isolated NK cells were prepared from human peripheral blood as described in “Materials and methods” and stimulated with 400 U/mL IL-2 and incubated for 72 h at 21% or 1% O2 in the presence or absence of 20 μM PHD inhibitor DMOG. HIF-1α and β-tubulin were detected by immunoblotting. Lanes lacking DMOG are representative of six different donors, and lanes with DMOG treatment are representative of three different donors. b PBMC-derived NK cells were expanded for 2 weeks using IL-2 only (IL-2 expanded) or IL-2 plus the Miltenyi MACSiBead™ loaded with anti-CD2 and anti-NKp46 abs (antibody expanded). NK cells were subsequently incubated with 400 U/mL IL-2 for 72 h at 21% or 1% O2. Whole-cell lysates were made and immunoblotted with anti-HIF-1α and β-tubulin antibodies. Blot is representative of seven different donors. c Ex vivo expanded NK cells were incubated in the absence or presence of 400 U/mL IL-2 for 72 h at 21% or 1% O2. Lysates were immunoblotted for HIF-1α. β-Actin is the loading control. d Ex vivo expanded NK cells were incubated with IL-2 for a total of 72 h at 21% or 1% O2 with the final 24 h in the presence of PD98059 (MAPK inhibitor), LY294002 (PI3K inhibitor), or rapamycin (mTOR inhibitor). Cell lysates were immunoblotted for HIF-1α. β-Actin is the loading control. Blot is representative of three independent experiments performed using three different donors. e Quantification of immunoblots in d normalized to β-actin and presented as fold difference of HIF-1α expression in 1% O2 relative to inhibited samples. Statistical significance was analyzed between inhibitor treated and control using paired two-tailed Student’s t-test. p ≤ 0.05 is significant. f Whole-cell lysates were prepared with ex vivo expanded NK cells incubated in the presence or absence of 400 U/mL of IL-2 and in the presence or absence of 10 µg/mL of MG132 for the final 24 h in a total 72-h incubation at 21% or 1% O2. HIF-1α and β-actin were detected by immunoblotting. Data are representative of two donors
Fig. 6
Fig. 6
Characterization of NK cell receptors on PBMC-derived NK cells in hypoxia. Freshly isolated NK cells and ex vivo expanded NK cells were stimulated with IL-2 and incubated in 21% O2 or 1% O2 for 72 h. Expression of surface receptors was analyzed by flow cytometry as described in “Materials and methods.” a Representative histograms of CD69 and NKG2D expression on freshly isolated NK cells, IL-2-expanded NK cells, and antibody-expanded NK cells. b Median fluorescence intensity (MFI) of the surface receptors expressed on NK cells isolated from various donors is shown in the graph. The average median fluorescence intensities ± SEM of the surface receptors for each NK cell type exposed to normoxia or hypoxia are shown below the graphs. Statistical significance was analyzed between normoxia and hypoxia by a paired two-tailed Student’s t-test. p ≤ 0.05 is significant. NK cells isolated from a minimum of four donors were used for this analysis
Fig. 7
Fig. 7
Real-time analysis of cytolysis exhibited by hypoxia-treated PBMC-derived NK cells against target tumor cells. Freshly isolated NK cells (a) or IL-2-expanded NK cells (c) or antibody-expanded NK cells (e) that were pre-incubated at 21% O2 or 1% O2 in the presence of IL-2 for 72 h were added to the target DLD-1 cells at E/T ratios of 10:1, 5:1, and 1:1. Real-time cytolysis of target cells was monitored using the xCELLigence RTCA SP system. Electrode impedance was measured and recorded as cell index. % Cytolysis was determined using the RTCA Software Pro. One representative of three independent experiments performed in duplicates using different donors is shown. b, d, and f show 50% killing time (KT 50) for the same E/T ratios in a, c, and e. p ≤ 0.05 is significant
Fig. 8
Fig. 8
IFN-γ and granzyme B expression in hypoxia-treated PBMC-derived NK cells. Freshly isolated NK cells (a, b) or IL-2-expanded NK cells (c, d) or antibody-expanded NK cells (e, f) were pre-incubated at 21% O2 or 1% O2 in the presence of IL-2 for 72 h before being transferred to plates coated with ULBP-1 or anti-NKp46 or anti-CD16 antibodies and incubations continued under the same conditions for another 18 h. After incubation, supernatant was collected, and ELISA performed in duplicates to test the concentrations of IFN-γ and granzyme B. Results are presented as mean of three different donors. Statistical significance was analyzed between 21% O2 and 1% O2 by two-tailed paired Student’s t-test

Similar articles

Cited by

References

    1. Sivori S, Vacca P, Del Zotto G, Munari E, Mingari MC, Moretta L. Human NK cells: surface receptors, inhibitory checkpoints, and translational applications. Cell Mol Immunol. 2019;16:430–441. doi: 10.1038/s41423-019-0206-4. - DOI - PMC - PubMed
    1. Fink T, Ebbesen P, Koppelhus U, Zachar V. Natural killer cell-mediated basal and interferon-enhanced cytotoxicity against liver cancer cells is significantly impaired under in vivo oxygen conditions. Scand J Immunol. 2003;58:607–612. doi: 10.1111/j.1365-3083.2003.01347.x. - DOI - PubMed
    1. Hudson CC, Liu M, Chiang GG, Otterness DM, Loomis DC, Kaper F, Giaccia AJ, Abraham RT. Regulation of hypoxia-inducible factor 1α expression and function by the mammalian target of rapamycin. In Mol Cell Biol. 2002;22:7004–7014. doi: 10.1128/MCB.22.20.7004-7014.2002. - DOI - PMC - PubMed
    1. Wang GL, Jiang B-H, Rue EA, Semenza GL (1995) Hypoxia-inducible factor 1 is a basic-helix-loop-helix-PAS heterodimer regulated by cellular 02 tension. Proc Natl Acad Sci USA 5 - PMC - PubMed
    1. Nakamura H, Makino Y, Okamoto K, Poellinger L, Ohnuma K, Morimoto C, Tanaka H. TCR engagement increases hypoxia-inducible factor-1 alpha protein synthesis via rapamycin-sensitive pathway under hypoxic conditions in human peripheral T cells. J Immunol. 2005;174:7592–7599. doi: 10.4049/jimmunol.174.12.7592. - DOI - PubMed

MeSH terms