. 2022 Jun;61(4):2051-2066.
doi: 10.1007/s00394-021-02787-7. Epub 2022 Jan 8.

Bioactive fish collagen peptides weaken intestinal inflammation by orienting colonic macrophages phenotype through mannose receptor activation

Affiliations

Bioactive fish collagen peptides weaken intestinal inflammation by orienting colonic macrophages phenotype through mannose receptor activation

Mouna Rahabi et al. Eur J Nutr. 2022 Jun.

Abstract

Purpose: Particular interest is now given to the potential of dietary supplements as alternative non-pharmacological approaches in intestinal inflammation handling. In this aim, this study evaluates the efficiency of fish collagen peptides, Naticol®Gut, on colonic inflammation.

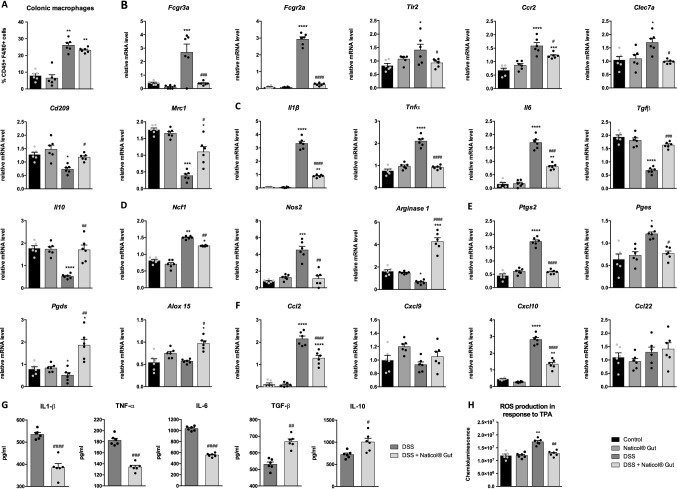
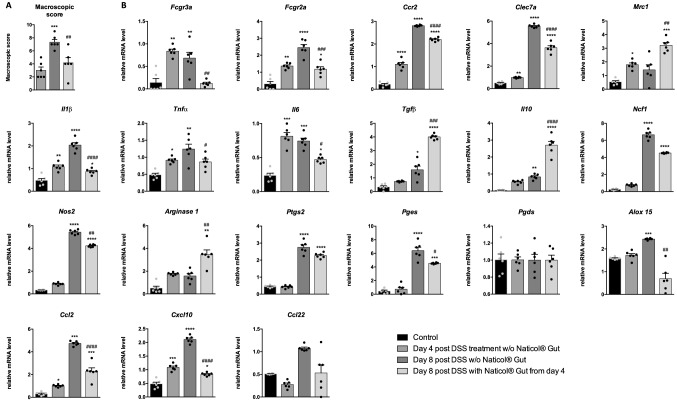
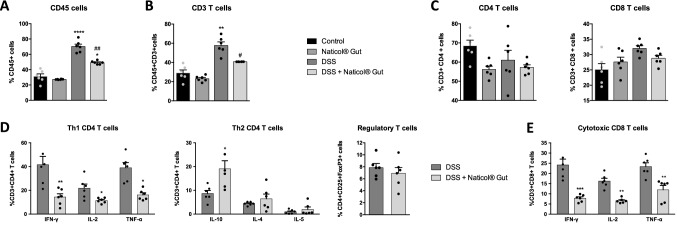
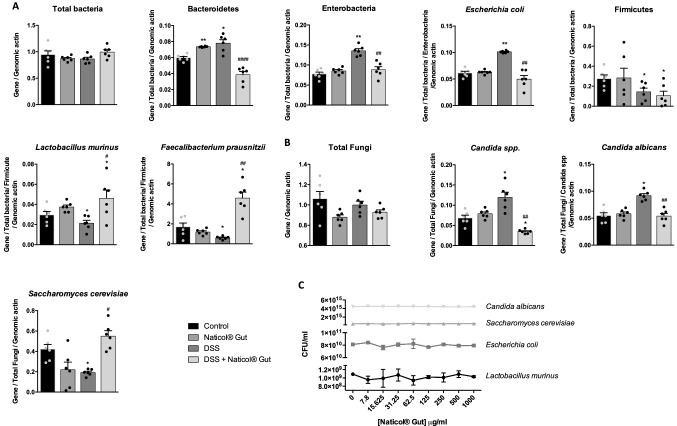
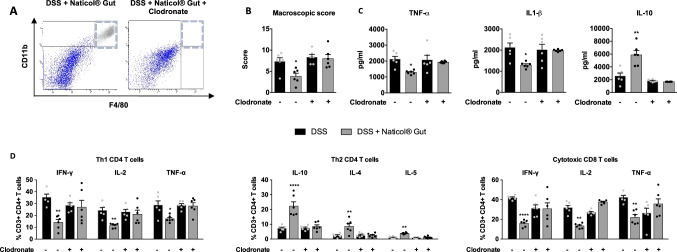
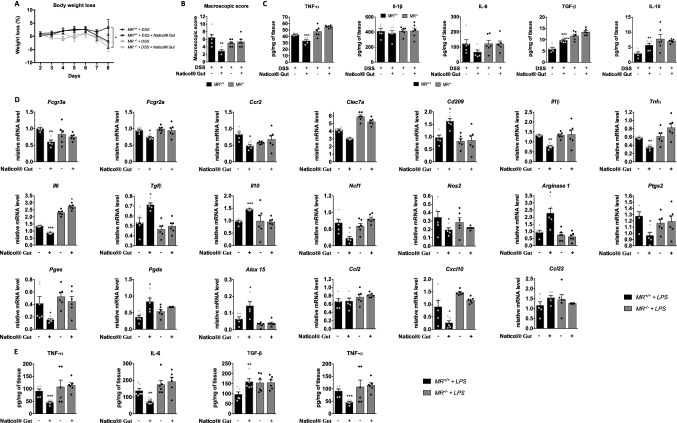
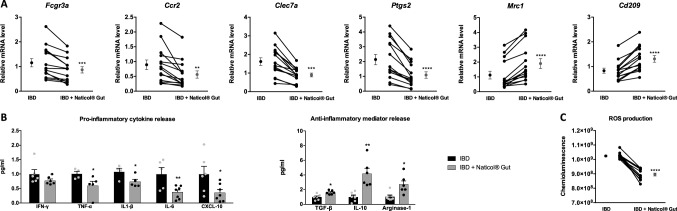
Methods: Wild type and Mannose receptor-deficient in the myeloid lineage C57BL/6 mice were administered with Dextran Sodium Sulfate (DSS), Naticol®Gut, DSS, and Naticol®Gut or only water for 4 or 8 days. Inflammatory status was evaluated by establishing macroscopic and microscopic scores, by measuring cytokine and calprotectin production by ELISA and the myeloperoxidase activity by chemiluminescence. Colonic macrophages were phenotyped by measuring mRNA levels of specific markers of inflammation and oxidative status. Colonic immune populations and T-cell activation profiles were determined by flow cytometry. Mucosa-associated gut microbiota assessment was undertaken by qPCR. The phenotype of human blood monocytes from inflammatory bowel disease (IBD) subjects was characterized by RT-qPCR and flow cytometry and their oxidative activity by chemiluminescence.

Results: Naticol®Gut-treated DSS mice showed attenuated colonic inflammation compared to mice that were only exposed to DSS. Naticol®Gut activity was displayed through its ability to orient the polarization of colonic macrophage towards an anti-inflammatory and anti-oxidant phenotype after its recognition by the mannose receptor. Subsequently, Naticol®Gut delivery modulated CD4 T cells in favor of a Th2 response and dampened CD8 T-cell activation. This immunomodulation resulted in an intestinal eubiosis. In human monocytes from IBD subjects, the treatment with Naticol®Gut also restored an anti-inflammatory and anti-oxidant phenotype.

Conclusion: Naticol®Gut acts as a protective agent against colitis appearing as a new functional food and an innovative and complementary approach in gut health.

Keywords: Collagen; Gut inflammation; Innate and adaptive immunity; Mannose receptor; Microbiota.


Conflict of interest statement

This work was supported by a grant from CIFRE-Association Nationale de la Recherche et de la Technologie (ANRT) awarded to Ms. Rahabi (2016/1443) and from the Weishardt Group.

Figures

Fig. 1
Fig. 1
In vivo Naticol®Gut administration dampens colonic inflammation during DSS-induced colitis. A Body weight loss, B serum calprotectin, C colon length, D macroscopic scores, E MPO activity, F microscopic scores, G H&E staining of representative cross-sections of distal colon, and H, I TNF-α, IL-6, IL-1β, TGF-β, and IL-10 protein levels were determined at day 8  in the colons of control or DSS-exposed mice treated or not with Naticol®Gut (n = 6 per group). **p ≤ 0.01, ***p ≤ 0.005, ****p ≤ 0.001 compared to control mice (DSS-unexposed mice). #p ≤ 0.05, ##p ≤ 0.01, ###p ≤ 0.005 compared to DSS-exposed mice
Fig. 2
Fig. 2
Naticol®Gut administration orients colonic macrophages towards an anti-inflammatory and anti-oxidant phenotype during colitis. A Percentage of macrophages in the colon of control or DSS-exposed mice treated or not with Naticol®Gut.. Cells were isolated by enzymatic digestion of colons, and among viable cells, the macrophages were identified as CD45+ CD11b+ and F4/80+ by flow cytometry. **p ≤ 0.01, compared to control mice (DSS-unexposed mice). BF Gene expression analysis of inflammatory and oxidative stress markers in colonic macrophages from control or DSS-exposed mice treated or not with Naticol®Gut using qRT-PCR. Results represent relative mRNA levels. Data are representative of three independent experiments (n = 6 per group). *p ≤ 0.05, **p ≤ 0.01, ***p ≤ 0.005, ****p ≤ 0.001 compared to control mice (DSS-unexposed mice). #p ≤ 0.05, ##p ≤ 0.01, ###p ≤ 0.005, ####p ≤ 0.001 DSS-exposed mice compared to DSS-exposed mice treated with Naticol®Gut. G IL-1β, TNF-α, IL-6, TGF-β, and IL-10 release by colonic macrophages from DSS-exposed mice treated or not with Naticol®Gut. #p ≤ 0.05, ##p ≤ 0.01, ###p ≤ 0.005, ####p ≤ 0.001 compared to DSS-exposed mice not treated with Naticol®Gut. H ROS production by colonic macrophages from DSS-unexposed mice treated or not with Naticol®Gut and DSS-exposed mice treated or not with Naticol®Gut upon (TPA) challenge. **p ≤ 0.01, compared to control mice (DSS-unexposed mice). ##p ≤ 0.01, DSS-exposed mice compared to DSS-exposed mice treated with Naticol®Gut
Fig. 3
Fig. 3
Naticol®Gut reverses pro-inflammatory and pro-oxidant colonic macrophages towards an anti-inflammatory and anti-oxidant phenotype during colitis. A Macroscopic scores, B gene expression analysis of inflammatory and oxidative stress markers in colonic macrophages from DSS-unexposed mice (control), mice exposed to DSS during 4 days or 8 days and mice exposed to DSS during 8 days treated with Naticol®Gut from day 4 post-DSS administration (n = 6 per group). Results represent relative mRNA levels. *p ≤ 0.05, **p ≤ 0.01, ***p ≤ 0.005, ****p ≤ 0.001 compared to control mice (DSS-unexposed mice). #p ≤ 0.05, ##p ≤ 0.01, ###p ≤ 0.005, ####p ≤ 0.001 untreated DSS-exposed mice during 8 days compared to DSS-exposed mice treated with Naticol®Gut from day 4 post-DSS administration
Fig. 4
Fig. 4
Naticol®Gut administration orients colonic CD4 and CD8 T cells towards an anti-inflammatory status during colitis. Percentage of leukocytes (A), T cells (B), and CD4 and CD8 T cells (C) in the colon of DSS-unexposed mice treated or not (control) with Naticol®Gut and of DSS-exposed mice treated or not with Naticol®Gut (n = 6 per group). Cells were isolated by enzymatic digestion of colons and among viable cells, the leukocytes, T cells and CD4+ and CD8+ T cells were, respectively, identified as CD45+, CD45+ CD3+ and CD45+ CD3+ CD4+ or CD8+ by flow cytometry. *p ≤ 0.05, **p ≤ 0.01, ****p ≤ 0.001 compared to control mice (DSS-unexposed mice). #p ≤ 0.05, ##p ≤ 0.01 DSS-exposed mice compared to DSS-exposed mice treated with Naticol®Gut. D Percentage of Th1, Th2, and Treg CD4+ T cells in the colon from DSS-exposed mice treated or not with Naticol®Gut. To evaluate Th1/Th2 activation of CD4+ T cells, their intracellular production of IFN-γ, IL-2, TNF-α, IL-10, IL-4, and IL-5 was assessed by flow cytometry. Regulatory T cells were identified as CD4+ CD25+ FoxP3 by flow cytometry. *p ≤ 0.05, **p ≤ 0.01 compared to DSS-exposed mice. E Percentage of cytotoxic CD8 T cells in the colon from DSS-exposed mice treated or not with Naticol®Gut. To evaluate CD8 T-cell activation, their intracellular production of IFN-γ, IL-2, and TNF-α was assessed by flow cytometry. **p ≤ 0.01, ***p ≤ 0.005 compared to DSS-exposed mice
Fig. 5
Fig. 5
Naticol®Gut administration results in an intestinal eubiosis characterized by a limitation in the development of pathobiontic species for the benefit of probiotic species. A, B Intestinal mucosae-attached microbiota of DSS-unexposed mice treated or not (control) with Naticol®Gut and of DSS-exposed mice treated or not with Naticol®Gut (n = 6 per group). Values were normalized to total bacteria or total fungi and host β-actin. E. coli was normalized to total bacteria, Enterobacteria, and host β-actin. L. murinus and F. prausnitzii were normalized to total bacteria, Firmicutes, and host β-actin. C. albicans was normalized to total Fungi, Candida spp. and host β-actin. *p ≤ 0.05, **p ≤ 0.01 compared to control mice (DSS-unexposed mice). #p ≤ 0.05, ##p ≤ 0.01, ####p ≤ 0.001 DSS-exposed mice compared to DSS-exposed mice treated with Naticol®Gut. C In vitro culture of selected bacteria and yeasts on minimum broth medium with addition of several twofold dilutions of Naticol®Gut. After 36 h, the OD600nm was measured and reported to the calibration standard curve of the respective specie
Fig. 6
Fig. 6
The impact of Naticol®Gut administration on colonic inflammation and CD4 and CD8 T-cell activation depends on macrophages. A Representative flow cytometry dot plot of macrophages (CD45+, CD11b+, F4/80+) in the colon from DSS-exposed mice treated with Naticol®Gut injected or not with clodronate. B Macroscopic scores determined at 8 days on DSS-exposed mice treated or not with Naticol®Gut and injected or not with clodronate. *p ≤ 0.01 compared to the respective DSS-exposed mice. C TNF-α, IL-1β, and IL-10 protein levels in colon from DSS-exposed mice treated or not with Naticol®Gut and injected or not with clodronate. *p ≤ 0.01, **p ≤ 0.01 compared to the respective DSS-exposed mice. D Percentage of Th1 CD4 T cells and cytotoxic CD8 T cells in the colon from DSS-exposed mice treated or not with Naticol®Gut and injected or not with clodronate. To evaluate CD4 and CD8 T-cell activation, their intracellular production of IFN-γ, IL-2, and TNF-α was assessed by flow cytometry. *p ≤ 0.05, **p ≤ 0.01, ****p ≤ 0.001 compared to the respective DSS-exposed mice (n = 6 per group)
Fig. 7
Fig. 7
Naticol®Gut orients macrophage polarization through mannose receptor. A Body weight loss. B Macroscopic scores. *p ≤ 0.05, **p ≤ 0.01 as compared DSS-exposed mice compared to the relative DSS-exposed mice treated with Naticol®Gut. C TNF-α, IL-1β, IL-6, TGF-β, and IL-10 protein levels were determined at day 8 in the colons of DSS-exposed MR+/+ and MR−/− mice treated or not with Naticol®Gut. Results are represented as fold inductions of the protein levels in colon from DSS-exposed mice treated with Naticol®Gut in comparison to the protein levels in colon from DSS-exposed mice *p ≤ 0.05, **p ≤ 0.01, ***p ≤ 0.005, ****p ≤ 0.001. D Gene expression analysis of inflammatory and oxidative stress markers in bone marrow-derived macrophages (BMDM) from MR+/+ and MR−/− mice primed with LPS and stimulated or not with Naticol®Gut using qRT-PCR. Results represent relative mRNA levels. E TNF-α, IL-6, TGF-β, and IL-10 protein levels were determined from the supernatant of BMDM from MR+/+ and MR−/− mice primed with LPS and stimulated or not with Naticol®Gut *p ≤ 0.05, **p ≤ 0.01, ***p ≤ 0.005, ****p ≤ 0.001 compared to the respective LPS-primed BMDM (n = 6 per group)
Fig. 8
Fig. 8
Naticol®Gut stimulation promotes anti-inflammatory and anti-oxidant phenotype of human blood monocytes from IBD patients. A Gene expression analysis of Fgcr3a, Ccr2, Clec7a, Ptgs2, Mrc1, and Cd209 and in human blood monocytes from IBD subjects stimulated or not with Naticol®Gut (n = 14) using qRT-PCR. **p ≤ 0.01, ***p ≤ 0.005, ****p ≤ 0.001 compared to the untreated condition. B IFN-γ, TNF-α, IL-1β, IL-6, CXCL-10, TGF-β, IL-10, and Arginase-1 release by human blood monocytes from IBD subjects stimulated or not with Naticol®Gut using flow cytometry. *p ≤ 0.05, **p ≤ 0.01 compared to the untreated condition. C ROS production by human blood monocytes from IBD subjects stimulated or not with Naticol®Gut. ****p ≤ 0.001 compared to the untreated condition

References

    1. Actis GC, Pellicano R, Fagoonee S, Ribaldone DG. History of inflammatory bowel diseases. J Clin Med. 2019 doi: 10.3390/jcm8111970. - DOI - PMC - PubMed
    1. Kühl AA, Erben U, Kredel LI, Siegmund B. Diversity of intestinal macrophages in inflammatory bowel diseases. Front Immunol. 2015 doi: 10.3389/fimmu.2015.00613. - DOI - PMC - PubMed
    1. Kobayashi T, Matsuoka K, Sheikh SZ, et al. IL-10 regulates Il12b expression via histone deacetylation: implications for intestinal macrophage homeostasis. J Immunol. 2012;189:1792–1799. doi: 10.4049/jimmunol.1200042. - DOI - PMC - PubMed
    1. Kühn R, Löhler J, Rennick D, et al. Interleukin-10-deficient mice develop chronic enterocolitis. Cell. 1993;75:263–274. doi: 10.1016/0092-8674(93)80068-p. - DOI - PubMed
    1. Maheshwari A, Kelly DR, Nicola T, et al. TGF-β2 suppresses macrophage cytokine production and mucosal inflammatory responses in the developing intestine. Gastroenterology. 2011;140:242–253. doi: 10.1053/j.gastro.2010.09.043. - DOI - PMC - PubMed

Grants and funding