

Long COVID symptoms and duration in SARS-CoV-2 positive children - a nationwide cohort study
- PMID: 35000003
- PMCID: PMC8742700
- DOI: 10.1007/s00431-021-04345-z
Long COVID symptoms and duration in SARS-CoV-2 positive children - a nationwide cohort study
Abstract
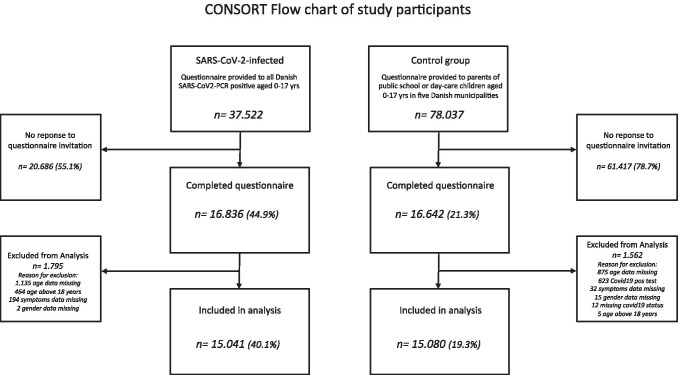
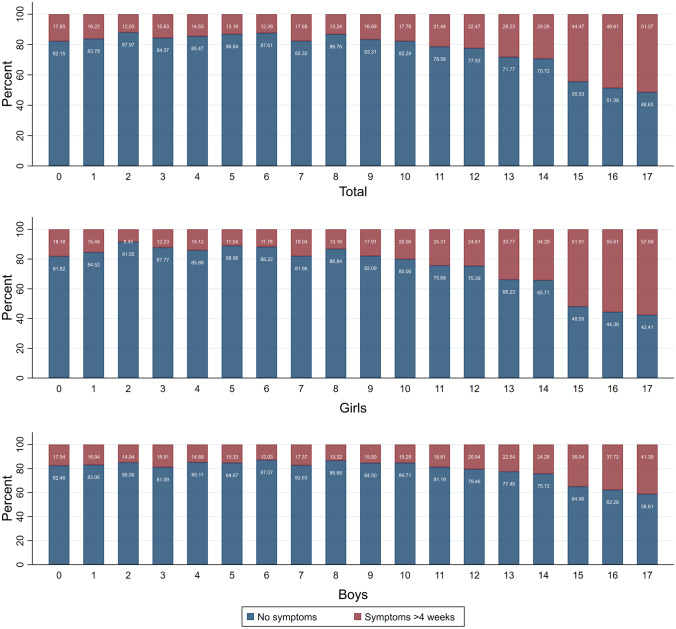
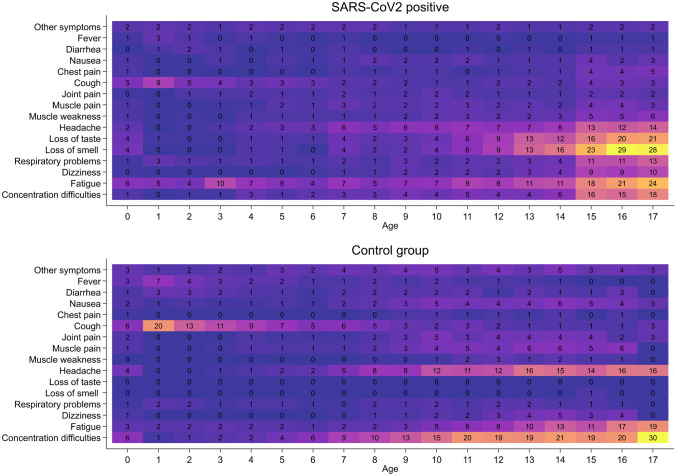
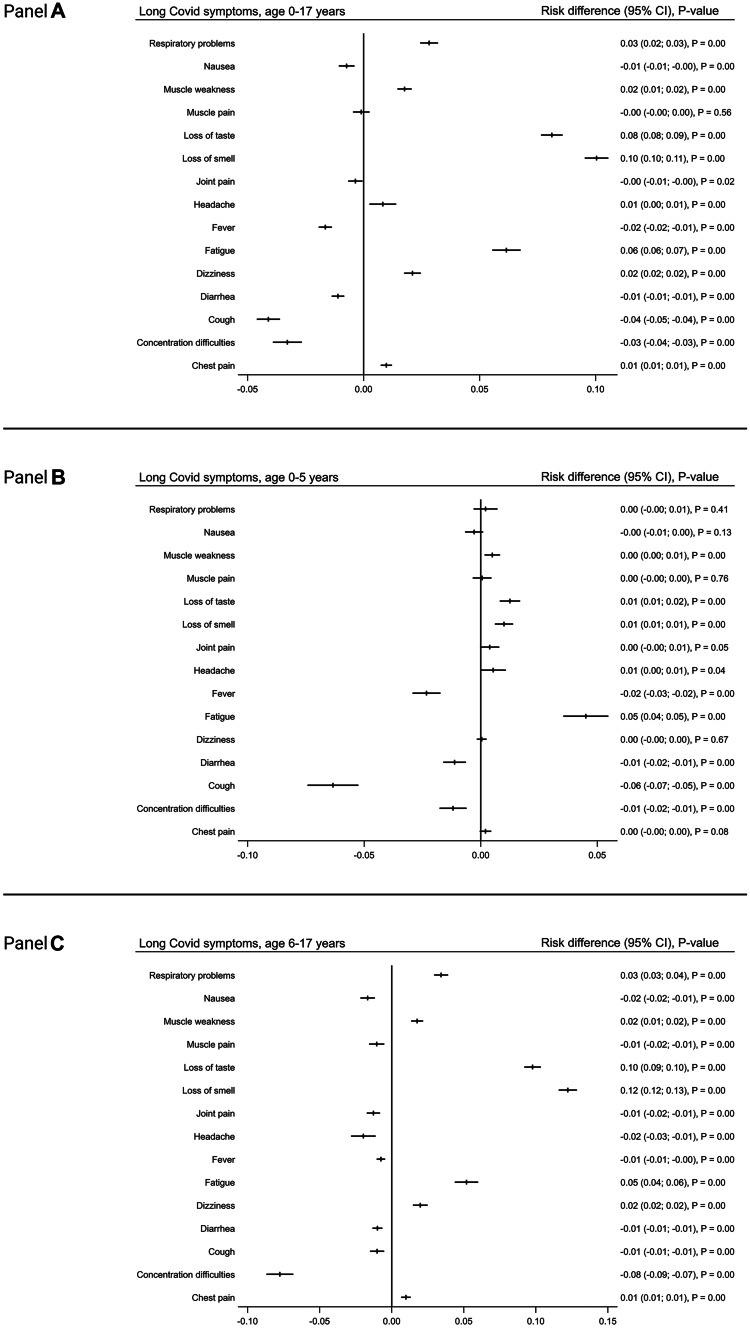
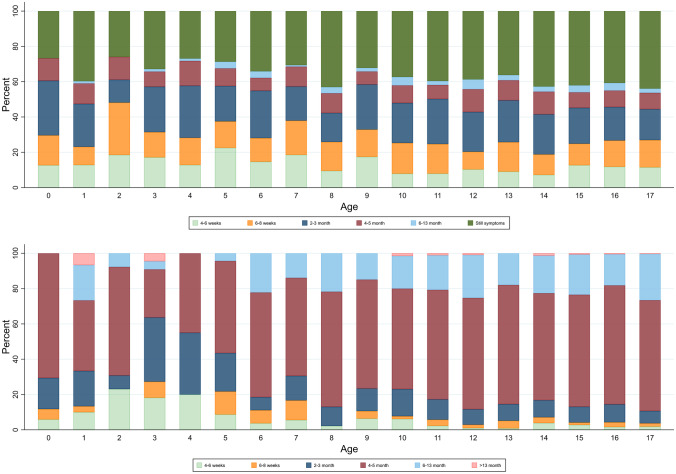
Most children have a mild course of acute COVID-19. Only few mainly non-controlled studies with small sample size have evaluated long-term recovery from SARS-CoV-2 infection in children. The aim of this study was to evaluate symptoms and duration of 'long COVID' in children. A nationwide cohort study of 37,522 children aged 0-17 years with RT-PCR verified SARS-CoV-2 infection (response rate 44.9%) and a control group of 78,037 children (response rate 21.3%). An electronic questionnaire was sent to all children from March 24th until May 9th, 2021. Symptoms lasting > 4 weeks were common among both SARS-CoV-2 children and controls. However, SARS-CoV-2 children aged 6-17 years reported symptoms more frequently than the control group (percent difference 0.8%). The most reported symptoms among pre-school children were fatigue Risk Difference (RD) 0.05 (CI 0.04-0.06), loss of smell RD 0.01 (CI 0.01-0.01), loss of taste RD 0.01 (CI 0.01-0.02) and muscle weakness RD 0.01 (CI 0.00-0.01). Among school children the most significant symptoms were loss of smell RD 0.12 (CI 0.12-0.13), loss of taste RD 0.10 (CI 0.09-0.10), fatigue RD 0.05 (CI 0.05-0.06), respiratory problems RD 0.03 (CI 0.03-0.04), dizziness RD 0.02 (CI 0.02-0.03), muscle weakness RD 0.02 (CI 0.01-0.02) and chest pain RD 0.01 (CI 0.01-0.01). Children in the control group experienced significantly more concentration difficulties, headache, muscle and joint pain, cough, nausea, diarrhea and fever than SARS-CoV-2 infected. In most children 'long COVID' symptoms resolved within 1-5 months.
Conclusions: Long COVID in children is rare and mainly of short duration.
What is known: • There are increasing reports on 'long COVID' in adults. • Only few studies have evaluated the long-term recovery from COVID-19 in children, and common for all studies is a small sample size (median number of children included 330), and most lack a control group.
What is new: • 0.8% of SARS-CoV-2 positive children reported symptoms lasting >4 weeks ('long COVID'), when compared to a control group. • The most common 'long COVID' symptoms were fatigue, loss of smell and loss of taste, dizziness, muscle weakness, chest pain and respiratory problems. • These 'long COVID' symptoms cannot be assigned to psychological sequelae of social restrictions. • Symptoms such as concentration difficulties, headache, muscle- and joint pain as well as nausea are not 'long COVID' symptoms. • In most cases 'long COVID' symptoms resolve within 1-5 months.
Keywords: COVID-19; Children; Long COVID; Long-term recovery; Sars-CoV-2.
© 2021. The Author(s).
Conflict of interest statement
The authors declare no competing interests.
Figures
References
-
- Ugentlige opgørelser med overvågningsdata. https://covid19.ssi.dk/overvagningsdata/ugentlige-opgorelser-med-overvaa.... Accessed 10 Apr 2021
-
- EpiCentro COVID-19 integrated surveillance data in Italy. https://www.epicentro.iss.it/en/coronavirus/sars-cov-2-dashboard. Accessed 10 Apr 2021
-
- CDC (2020) COVID data tracker. Cent Dis Control Prev. https://covid.cdc.gov/covid-data-tracker. Accessed 10 Apr 2021
MeSH terms
LinkOut - more resources
Full Text Sources
Medical
Miscellaneous
