. 2022 Mar;48(1):37-53.
doi: 10.1007/s10867-021-09596-3. Epub 2022 Jan 9.

Exploring the folding energy landscapes of heme proteins using a hybrid AWSEM-heme model

Affiliations

Exploring the folding energy landscapes of heme proteins using a hybrid AWSEM-heme model

Xun Chen et al. J Biol Phys. 2022 Mar.

Abstract

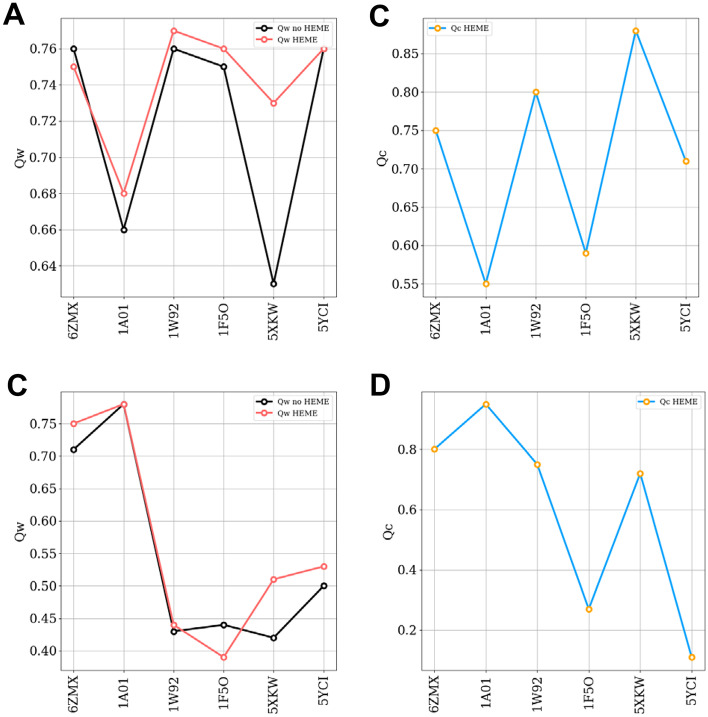
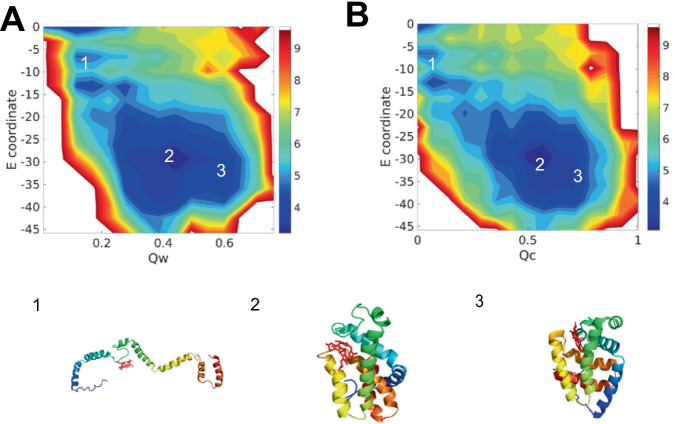
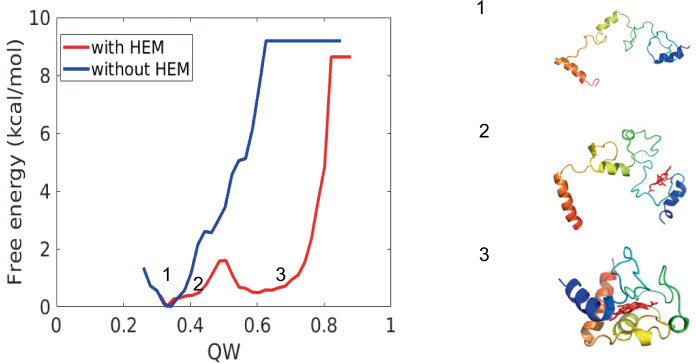
Heme is an active center in many proteins. Here we explore computationally the role of heme in protein folding and protein structure. We model heme proteins using a hybrid model employing the AWSEM Hamiltonian, a coarse-grained forcefield for the protein chain along with AMBER, an all-atom forcefield for the heme. We carefully designed transferable force fields that model the interactions between the protein and the heme. The types of protein-ligand interactions in the hybrid model include thioester covalent bonds, coordinated covalent bonds, hydrogen bonds, and electrostatics. We explore the influence of different types of hemes (heme b and heme c) on folding and structure prediction. Including both types of heme improves the quality of protein structure predictions. The free energy landscape shows that both types of heme can act as nucleation sites for protein folding and stabilize the protein folded state. In binding the heme, coordinated covalent bonds and thioester covalent bonds for heme c drive the heme toward the native pocket. The electrostatics also facilitates the search for the binding site.

Keywords: Forcefield; Heme; Nucleation mechanism; Prediction; Protein folding.


Conflict of interest statement

The authors declare no competing interests.

Figures

Fig. 1
Fig. 1
Summary of heme b protein predictions. A The Qw between best structure in prediction and experimental determined structure by different setups using single memory. Black: Apo form, Red: Holo form. The Qc between best structures in holo form predictions using single memory and experimentally determined structures. C The Qw between best structures in predictions and experimental determined structures by different setups using fragment memory. Black: Apo form, Red: Holo form. D The Qc between best structures in holo form predictions using fragment memory and experimentally determined structures
Fig. 2
Fig. 2
The free energy profile of 1F5O (hemoglobin) at temperature 300K. A the 2D free energy surface is plotted using the structural quality of protein Qw and the accuracy of protein–ligand position Qc as the two dimensions. The Q w is used to evaluate the similarity between simulated protein structure and experimentally determined protein structure. The Qc is used to measure the similarity between simulated protein-heme b pocket and crystal protein-heme b pocket. Represented structures are shown at the right panel, colored by a rainbow spectrum from red (N terminus) to blue (C terminus). B The best predicted structure is colored by RMSD, aligned to crystal structure from blue to red, from high RMSD values to low RMSD values. The regions of low RMSD values are circled
Fig. 3
Fig. 3
The free energy profile of 1F5O (hemoglobin) at temperature 300K. A the 2D free-energy surface is plotted using the accuracy of protein structure Qw and coordinated covalent bond energy as the two dimensions. B the 2D free-energy surface is plotted using the accuracy of protein–ligand position Qc and coordinated covalent bond energy as the two dimensions. Represented structures are shown at the bottom, colored by a rainbow spectrum from red (N terminus) to blue (C terminus)
Fig. 4
Fig. 4
Summary of heme c protein predictions. A The Qw between best structures in predictions and experimental determined structures by different setups using single memory. Black: Apo form, Red: Holo form. B The Qc between best structures in holo form predictions using single memory and experimental determined structures. C The Qw between best structures in predictions and experimental determined structures by different setups using fragment memory. Black: Apo form, Red: Holo form. D The Qc between best structures in holo form predictions using fragment memory and experimental determined structures
Fig. 5
Fig. 5
Grand canonical free energy profile of 1FI3 (cytochrome c) at temperature 300K. A the 2D free energy surface is plotted using the structural quality of protein Qw and the accuracy of protein–ligand position Qc as the two dimensions. The Qw is used to evaluate the similarity between simulated protein structure and experimentally determined protein structure. The Qc is used to measure the similarity between simulated protein-heme c pocket and crystal protein-heme c pocket. Represented structures are shown at the right panel, colored by a rainbow spectrum from red (N terminus)to blue (C terminus). B The best predicted structure is colored by RMSD, aligned to crystal structure from blue to red, from high RMSD values to low RMSD values. The regions of low RMSD values are circled
Fig. 6
Fig. 6
The free energy profile of 1FI3 (cytochrome c) at temperature 300K. A the 2D free energy surface is plotted using the accuracy of protein structure Qw and thioester covalent bond energy as the two dimensions. B the 2D free-energy surface is plotted using the accuracy of protein–ligand position Qc and thioester covalent bond energy as the two dimensions. The represented structures are shown at the bottom, colored by a rainbow spectrum from red (N terminus) to blue (C terminus)
Fig. 7
Fig. 7
The diagram shows the effect of heme c on the folding process. Free energy profiles are plotted as a function of reaction coordinated Qw of protein using different setups. Blue: without heme c, Red: with heme c

References

    1. Stokes, G.G. VIII: on the reduction and oxidation of the colouring matter of the blood. Proc. R. Soc. Lond. (13), 355–364 (1864)
    1. Wyman, J.: Allosteric effects in hemoglobin. In: Cold Spring Harbor Symposia on Quantitative Biology, vol. 28, pp. 483–489. Cold Spring Harbor Laboratory Press (1963)
    1. Austin R, Beeson K, Eisenstein L, Frauenfelder H, Gunsalus I, Marshall V. Dynamics of carbon monoxide binding by heme proteins. Science. 1973;181(4099):541–543. doi: 10.1126/science.181.4099.541. - DOI - PubMed
    1. Frauenfelder H, Sligar SG, Wolynes PG. The energy landscapes and motions of proteins. Science. 1991;254(5038):1598–1603. doi: 10.1126/science.1749933. - DOI - PubMed
    1. Englander SW, Mayne L. The case for defined protein folding pathways. Proc. Natl. Acad. Sci. U.S.A. 2017;114(31):8253–8258. doi: 10.1073/pnas.1706196114. - DOI - PMC - PubMed

Publication types

LinkOut - more resources