. 2022 Feb 28;377(1845):20200433.
doi: 10.1098/rstb.2020.0433. Epub 2022 Jan 10.

Quantifying the dynamics of nearly 100 years of dominance hierarchy research

Affiliations

Quantifying the dynamics of nearly 100 years of dominance hierarchy research

Elizabeth A Hobson. Philos Trans R Soc Lond B Biol Sci. .

Abstract

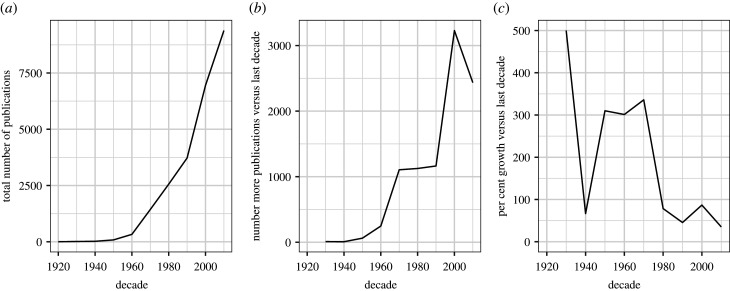
Dominance hierarchies have been studied for almost 100 years. The science of science approach used here provides high-level insight into how the dynamics of dominance hierarchy research have shifted over this long timescale. To summarize these patterns, I extracted publication metadata using a Google Scholar search for the phrase 'dominance hierarchy', resulting in over 26 000 publications. I used text mining approaches to assess patterns in three areas: (1) general patterns in publication frequency and rate, (2) dynamics of term usage and (3) term co-occurrence in publications across the history of the field. While the overall number of publications per decade continues to rise, the percent growth rate has fallen in recent years, demonstrating that although there is sustained interest in dominance hierarchies, the field is no longer experiencing the explosive growth it showed in earlier decades. Results from title term co-occurrence networks and community structure show that the different subfields of dominance hierarchy research were most strongly separated early in the field's history while modern research shows more evidence for cohesion and a lack of distinct term community boundaries. These methods provide a general view of the history of research on dominance hierarchies and can be applied to other fields or search terms to gain broad synthetic insight into patterns of interest, especially in fields with large bodies of literature. This article is part of the theme issue 'The centennial of the pecking order: current state and future prospects for the study of dominance hierarchies'.

Keywords: dominance hierarchy; science of science; text mining.


Figures

Figure 1.
Figure 1.
Publications by decade showing (a) total publications for each decade, (b) the number of publications in each decade compared to the previous decade, and (c) the per cent growth in number of publications compared to the previous decade.
Figure 2.
Figure 2.
Title term usage in titles by decade showing (a) Shannon diversity in title term use in each decade (with diversity calculated on total number of publications using each title term per decade), (b) the number of novel title terms introduced in each decade and (c) the per cent of title terms in the entire corpus that were used in titles in each decade.
Figure 3.
Figure 3.
Title term usage in publications showing ‘hotspots’ of similarity across decades: (a) similarity in the raw number of title terms present in both decades, (b) scaled similarity showing the per cent of title terms present in decades on the y-axis compared with the title terms present in decades on the x-axis and (c) relative similarity showing each decade’s similarity scaled by maximum similarity to decades on the y-axis, with maximum similarity shown in red.
Figure 4.
Figure 4.
Wordclouds showing title term community assignment across decades. Text size indicates each term’s eigenvector centrality in the title term co-occurrence network for that decade, with higher centrality terms printed in larger text. Text colour indicates each term’s assignment to a community in each decade; terms in the same colour within the same decade were assigned to the same title term co-occurrence community. To improve legibility, wordclouds show (at most) the top 10 most central terms per community per decade.
Figure 5.
Figure 5.
Title term use and co-occurrence community membership over time for the top three most-used title terms: ‘behavior’, ‘social’ and ‘domin’. Points show the proportion of titles containing each title term per decade; point colour indicates title term co-occurrence community membership.
Figure 6.
Figure 6.
Title term co-occurrence network summaries by decade: (a) modularity over time, (b) number of communities detected in each decade and (c) per cent of edges connecting a title term node in one community to a title term node in a different community.

References

    1. Shizuka D, McDonald DB. 2012. A social network perspective on measurements of dominance hierarchies. Anim. Behav. 83, 925-934. (10.1016/j.anbehav.2012.01.011) - DOI
    1. Shizuka D, McDonald DB. 2015. The network motif architecture of dominance hierarchies. J. R. Soc. Interface 12, 20150080. (10.1098/rsif.2015.0080) - DOI - PMC - PubMed
    1. Archie EA, Altmann J, Alberts SC. 2012. Social status predicts wound healing in wild baboons. Proc. Natl Acad. Sci. USA 109, 9017-9022. (10.1073/pnas.1206391109) - DOI - PMC - PubMed
    1. MacCormick HA, MacNulty DR, Bosacker AL, Lehman C, Bailey A, Anthony Collins D, Packer C. 2012. Male and female aggression: lessons from sex, rank, age, and injury in olive baboons. Behav. Ecol. 23, 684-691. (10.1093/beheco/ars021) - DOI
    1. Sapolsky RM. 2004. Social status and health in humans and other animals. Annu. Rev. Anthropol. 33, 393-418. (10.1146/annurev.anthro.33.070203.144000) - DOI

MeSH terms

LinkOut - more resources