

Premature mortality attributable to COVID-19: potential years of life lost in 17 countries around the world, January-August 2020
- PMID: 35000578
- PMCID: PMC8743065
- DOI: 10.1186/s12889-021-12377-1
Premature mortality attributable to COVID-19: potential years of life lost in 17 countries around the world, January-August 2020
Abstract
Background: Understanding the impact of the burden of COVID-19 is key to successfully navigating the COVID-19 pandemic. As part of a larger investigation on COVID-19 mortality impact, this study aims to estimate the Potential Years of Life Lost (PYLL) in 17 countries and territories across the world (Australia, Brazil, Cape Verde, Colombia, Cyprus, France, Georgia, Israel, Kazakhstan, Peru, Norway, England & Wales, Scotland, Slovenia, Sweden, Ukraine, and the United States [USA]).
Methods: Age- and sex-specific COVID-19 death numbers from primary national sources were collected by an international research consortium. The study period was established based on the availability of data from the inception of the pandemic to the end of August 2020. The PYLL for each country were computed using 80 years as the maximum life expectancy.
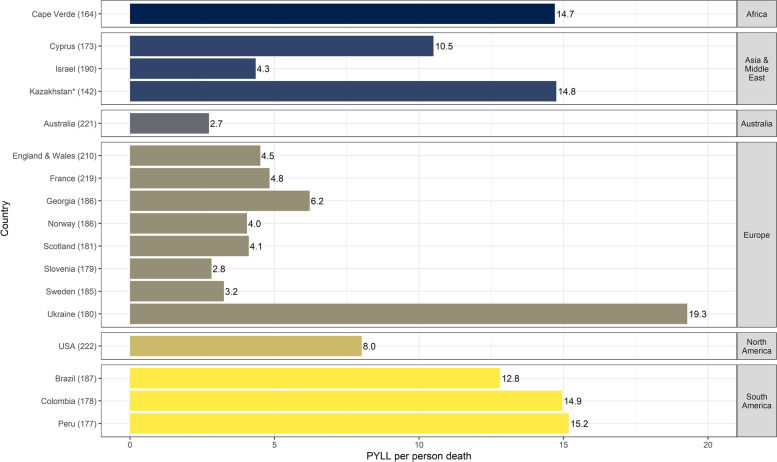
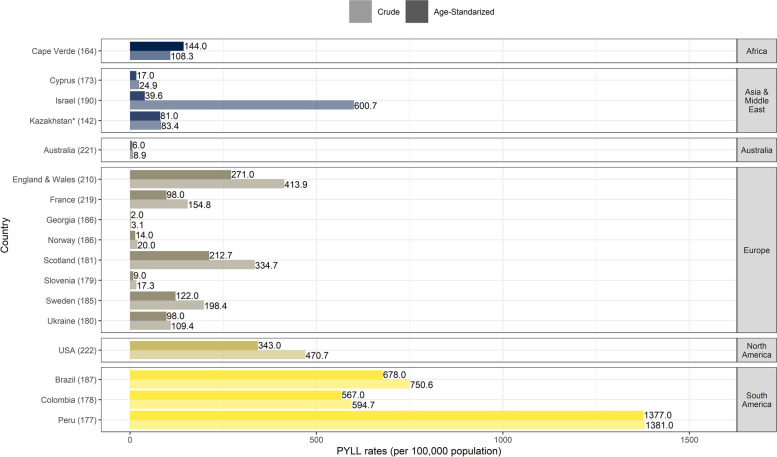
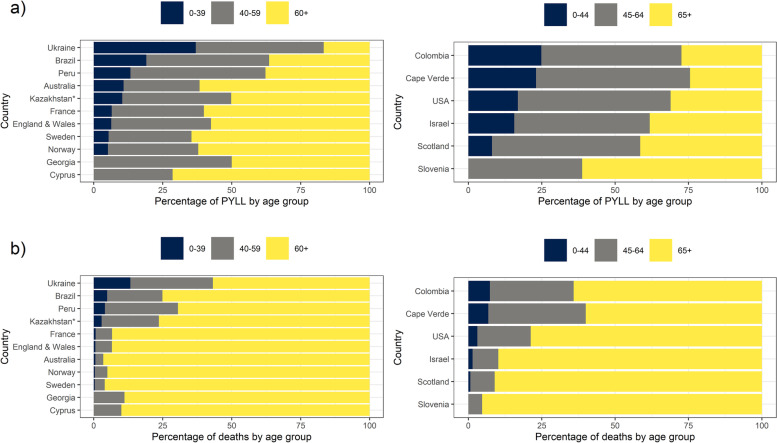
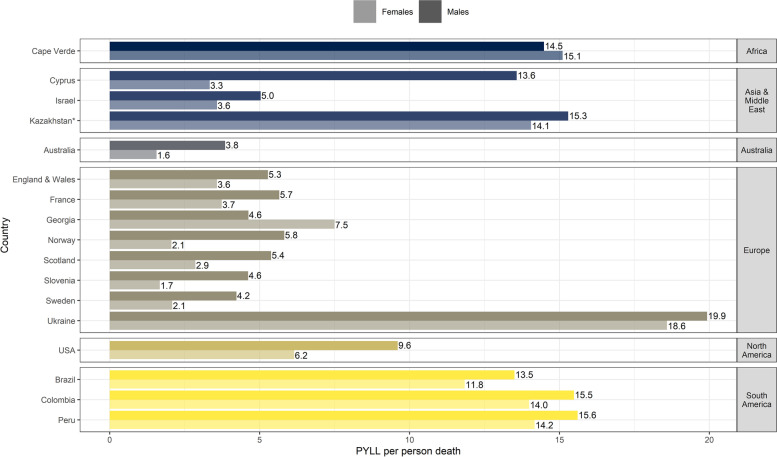
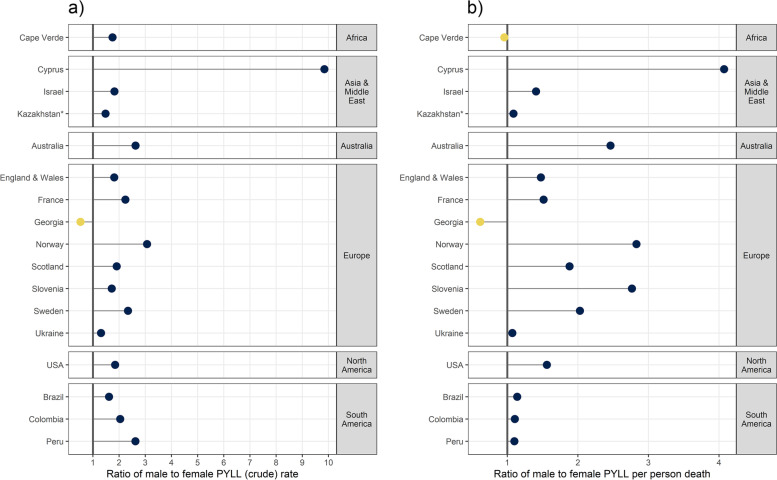
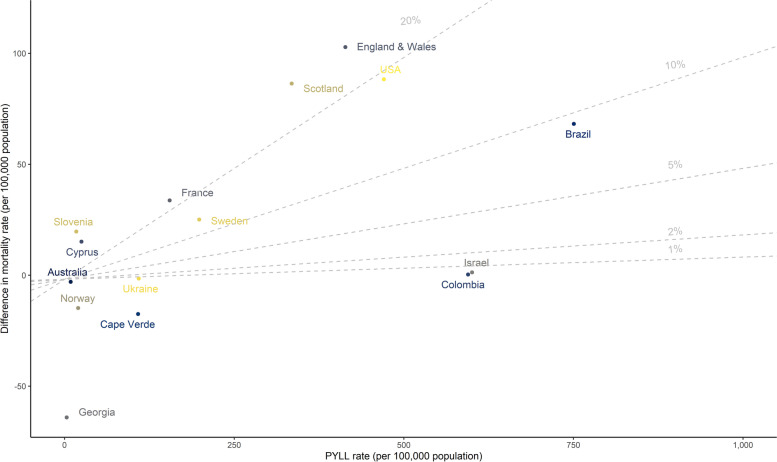
Results: As of August 2020, 442,677 (range: 18-185,083) deaths attributed to COVID-19 were recorded in 17 countries which translated to 4,210,654 (range: 112-1,554,225) PYLL. The average PYLL per death was 8.7 years, with substantial variation ranging from 2.7 years in Australia to 19.3 PYLL in Ukraine. North and South American countries as well as England & Wales, Scotland and Sweden experienced the highest PYLL per 100,000 population; whereas Australia, Slovenia and Georgia experienced the lowest. Overall, males experienced higher PYLL rate and higher PYLL per death than females. In most countries, most of the PYLL were observed for people aged over 60 or 65 years, irrespective of sex. Yet, Brazil, Cape Verde, Colombia, Israel, Peru, Scotland, Ukraine, and the USA concentrated most PYLL in younger age groups.
Conclusions: Our results highlight the role of PYLL as a tool to understand the impact of COVID-19 on demographic groups within and across countries, guiding preventive measures to protect these groups under the ongoing pandemic. Continuous monitoring of PYLL is therefore needed to better understand the burden of COVID-19 in terms of premature mortality.
Keywords: COVID-19; Disease burden; PYLL; Pandemic; Potential years of life lost; SARS-CoV-2.
© 2022. The Author(s).
Conflict of interest statement
The authors declare that they have no competing interest.
Figures
References
-
- COVID-19 situation update worldwide, as of week 52 2020 [Internet]. European Centre for Disease Prevention and Control. 2021 [cited 2021 Jan 3]. Available from: https://www.ecdc.europa.eu/en/geographical-distribution-2019-ncov-cases
-
- Verity R, Okell LC, Dorigatti I, Winskill P, Whittaker C, Imai N, et al. Estimates of the severity of coronavirus disease 2019: a model-based analysis. Lancet Infect Dis [Internet]. 2020 Apr 2;0(0). Available from: https://www.thelancet.com/journals/laninf/article/PIIS1473-3099(20)30243... - PMC - PubMed
-
- O’Driscoll M, Ribeiro Dos Santos G, Wang L, Cummings DAT, Azman AS, Paireau J, et al. Age-specific mortality and immunity patterns of SARS-CoV-2. Nature [Internet]. 2020 Jan 22;1–6. Available from: https://www.nature.com/articles/s41586-020-2918-0 - PubMed
-
- Marois G, Muttarak R, Scherbov S. Assessing the potential impact of COVID-19 on life expectancy. PLoS One [Internet]. 2020 Feb 9;15(9):e0238678. Available from: https://journals.plos.org/plosone/article?id=10.1371/journal.pone.0238678 - DOI - PMC - PubMed
-
- Gardner JW, Sanborn JS. Years of potential life lost (YPLL)—what does it measure? Epidemiology [Internet] 1990 Feb 9;1(4):322–329. Available from: https://journals.lww.com/epidem/Abstract/1990/07000/Years_of_Potential_L... - PubMed
Publication types
MeSH terms
LinkOut - more resources
Full Text Sources
Medical
Research Materials
Miscellaneous
