. 2022 May;16(5):1327-1336.
doi: 10.1038/s41396-021-01159-7. Epub 2022 Jan 10.

Forest tree growth is linked to mycorrhizal fungal composition and function across Europe

Affiliations

Forest tree growth is linked to mycorrhizal fungal composition and function across Europe

Mark A Anthony et al. ISME J. 2022 May.

Abstract

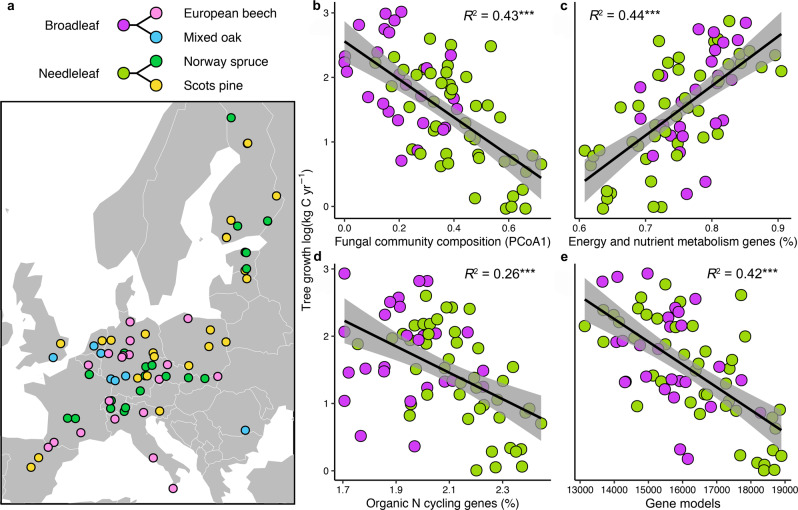
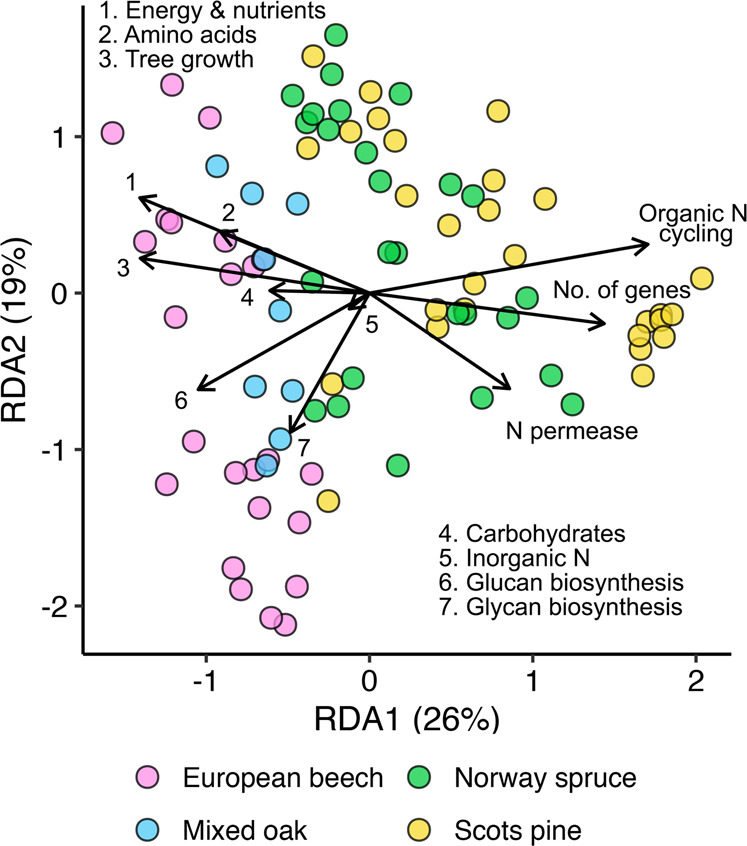
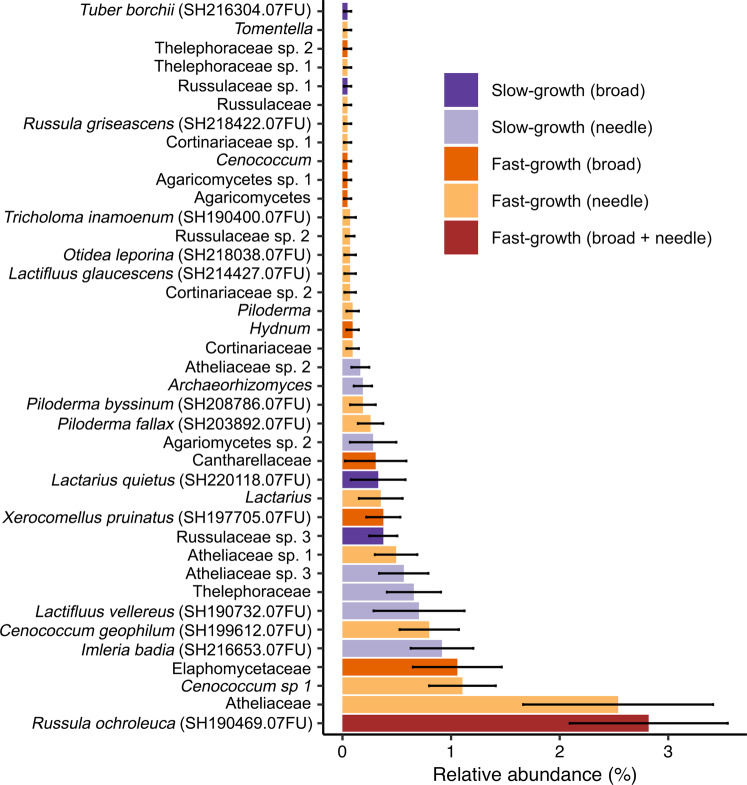
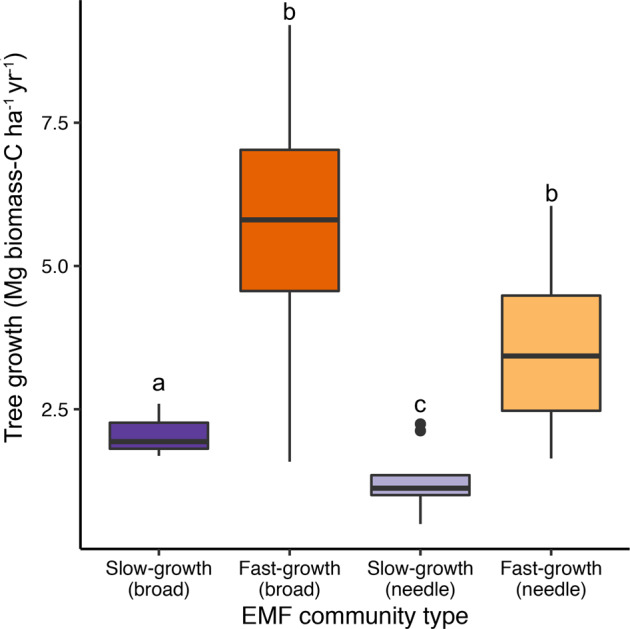
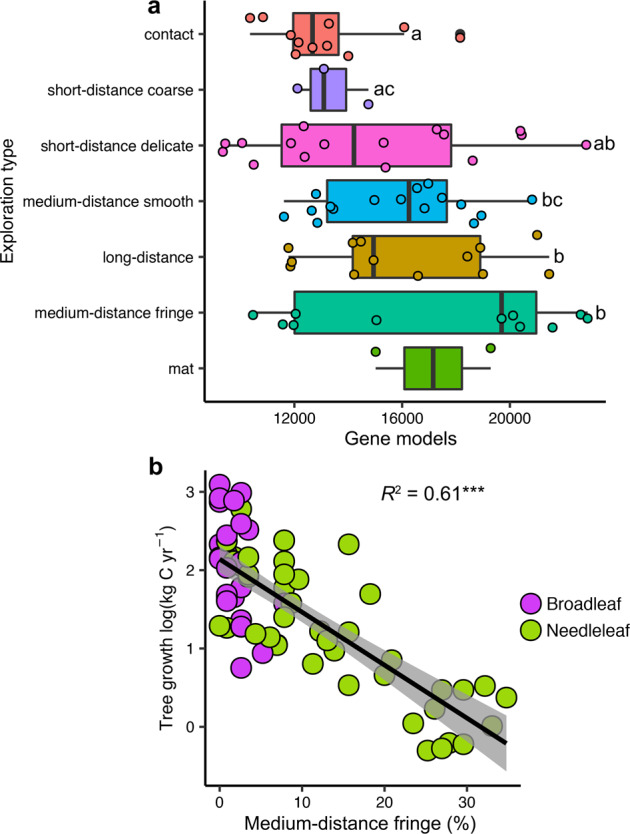
Most trees form symbioses with ectomycorrhizal fungi (EMF) which influence access to growth-limiting soil resources. Mesocosm experiments repeatedly show that EMF species differentially affect plant development, yet whether these effects ripple up to influence the growth of entire forests remains unknown. Here we tested the effects of EMF composition and functional genes relative to variation in well-known drivers of tree growth by combining paired molecular EMF surveys with high-resolution forest inventory data across 15 European countries. We show that EMF composition was linked to a three-fold difference in tree growth rate even when controlling for the primary abiotic drivers of tree growth. Fast tree growth was associated with EMF communities harboring high inorganic but low organic nitrogen acquisition gene proportions and EMF which form contact versus medium-distance fringe exploration types. These findings suggest that EMF composition is a strong bio-indicator of underlying drivers of tree growth and/or that variation of forest EMF communities causes differences in tree growth. While it may be too early to assign causality or directionality, our study is one of the first to link fine-scale variation within a key component of the forest microbiome to ecosystem functioning at a continental scale.


Conflict of interest statement

The authors declare no competing interests.

Figures

Fig. 1
Fig. 1. Correlations between the ectomycorrhizal fungal community and tree growth rate across Europe.
Map showing the ICP Forests level II study plots with functional tree groups (broadleaf and needleleaf) and dominant tree species (>50% cover) separated by color (a). Correlation between tree growth and fungal community composition represented using principle coordinates analysis axis 1 (PCoA1; b; see functional tree group colors from panel a), fungal energy and nutrient metabolism genes (c), fungal organic N cycling genes (i.e. genes encoding for enzymes that EMF produce to access organic N, including peroxidases, multicopper oxidases, peptidases, and proteases (d), and the number of gene models identified in the fungal genome as an indicator of metabolic activity (e). Fungal energy and nutrient metabolism genes (i.e. ATP production, inorganic N metabolism) are a predefined KEGG metabolic pathway (Pathway 1.2) while organic N cycling genes were aggregated using PFAMs annotations. Gene proportions were calculated as the number of specific gene sequences relative to total gene numbers assigned to operational taxonomic units (OTUs; 97% sequence similarity) weighted based on relative taxon abundance (community weighted mean; CWM). Number of gene models was also calculated as a CWM trait value. Values show predicted tree growth while controlling for the influence of other covariates in the full statistical model (see Materials and Methods). Linear lines, confidence intervals (95%), and R2 values are displayed, and asterisks indicate significance (p ≤ 0.0001).
Fig. 2
Fig. 2. Fungal composition depicting community types and genomic functional gene potentials associated with tree growth rate.
Distance-based redundancy analysis (RDA) performed using fungal relative abundances converted to Bray–Curtis dissimilarities and fungal functional gene community weighted mean proportions and tree growth rate as explanatory variables. Note the configuration of fungal communities associated with fast tree growth corresponds with higher proportions of energy and nutrient metabolism, amino acid metabolism (AA), carbohydrate metabolism, and to a lesser extent, inorganic N metabolism genes, glucan biosynthesis (Glucan), and glycan biosynthesis (Glycan) genes. Fungal communities associated with slow tree growth correspond with organic N cycling (peptidases, proteases, multicopper oxidases, peroxidases), N permease gene proportions, and number of gene models in the genome (No. of genes).
Fig. 3
Fig. 3. Fungal taxonomic indicator species representative of the slow- and fast-tree growth associated EMF community clusters in needleleaf (Scots pine and Norway spruce) and broadleaf (European beech and mixed oak) forests.
The relative abundance of significant fungal indicator taxa identified to the highest taxonomic level and organized for visual purposes by rank abundance. Each species-level taxon is annotated with a reference species hypothesis identifiable by the internal transcribed spacer region DNA sequence aligned at ≥97% sequence similarity to references in the UNITE database. Bars show the mean relative abundance of taxa across all plots where taxa occurred, and error bars show the standard error.
Fig. 4
Fig. 4. Annual aboveground forest tree growth aggregated at the stand level comparing forests classified as part of the slow- and fast-tree growth associated ectomycorrhizal fungal community types in needleleaf (Scots pine and Norway spruce) and broadleaf (European beech and mixed oak) forests.
Values show predicted tree growth rates at sites classified as part of the slow vs. fast tree growth associated EMF communities while controlling for the influence of other covariates. Significantly different values were evaluated using heteroscedastic t-tests. Different lowercase letters indicate significant differences (p ≤ 0.05).
Fig. 5
Fig. 5. The relationship between ectomycorrhizal fungal exploration type, number of gene models, and tree growth rate.
Number of gene models was summarized by ectomycorrhizal exploration types based on species and genera identified in this study (a). Examples of genera with particular exploration types in the study are included in parentheses. Significant differences were tested using heteroscedastic t-tests to account for unequal sample numbers and differences are indicated using different lower-case letters (p ≤ 0.05). No comparisons were made against the mat-forming type as there were too few species with sequenced genomes identified in our study. The correlation between tree growth rate and the relative abundance of medium-distance fringe type EMF (b). Values show predicted tree growth while controlling for the influence of other covariates in the full statistical model. Linear lines, confidence intervals (95%), and R2 values are displayed (*** = p ≤ 0.0001). Note that this correlation was significant for both broad- (R2 = 0.18, p = 0.03) and needleleaf (R2 = 0.66, p < 0.0001) forests when examined individually.

Similar articles

Cited by

References

    1. Vittadini C. Monographia lycoperdineorum. Augustae Taurinorum, Torino, 1842.
    1. Frank B. On the nutrition of certain trees by underground fungi based on root symbiosis. Plant Biol. 1885;3:128–45.
    1. Gadgil RL, Gadgil P. Mycorrhiza and litter decomposition. Nature. 1971;233:133–133. doi: 10.1038/233133a0. - DOI - PubMed
    1. Harley J. Problems of mycotrophy. London: Academic Press; 1975.
    1. Clemmensen KE, Finlay RD, Dahlberg A, Stenlid J, Wardle DA, Lindahl BD. Carbon sequestration is related to mycorrhizal fungal community shifts during long‐term succession in boreal forests. N. Phytol. 2015;205:1525–36. doi: 10.1111/nph.13208. - DOI - PubMed

Publication types