. 2022 May;87(5):2536-2550.
doi: 10.1002/mrm.29148. Epub 2022 Jan 9.

Estimation of the capillary level input function for dynamic contrast-enhanced MRI of the breast using a deep learning approach

Affiliations

Estimation of the capillary level input function for dynamic contrast-enhanced MRI of the breast using a deep learning approach

Jonghyun Bae et al. Magn Reson Med. 2022 May.

Abstract

Purpose: To develop a deep learning approach to estimate the local capillary-level input function (CIF) for pharmacokinetic model analysis of DCE-MRI.

Methods: A deep convolutional network was trained with numerically simulated data to estimate the CIF. The trained network was tested using simulated lesion data and used to estimate voxel-wise CIF for pharmacokinetic model analysis of breast DCE-MRI data using an abbreviated protocol from women with malignant (n = 25) and benign (n = 28) lesions. The estimated parameters were used to build a logistic regression model to detect the malignancy.

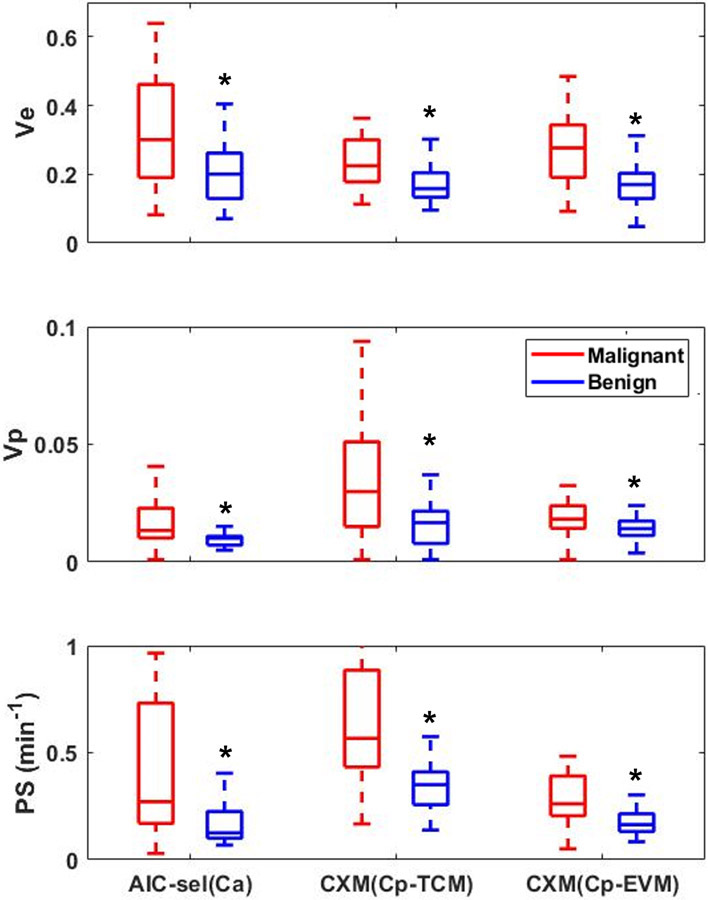
Result: The pharmacokinetic parameters estimated using the network-predicted CIF from our breast DCE data showed significant differences between the malignant and benign groups for all parameters. Testing the diagnostic performance with the estimated parameters, the conventional approach with arterial input function (AIF) showed an area under the curve (AUC) between 0.76 and 0.87, and the proposed approach with CIF demonstrated similar performance with an AUC between 0.79 and 0.81.

Conclusion: This study shows the feasibility of estimating voxel-wise CIF using a deep neural network. The proposed approach could eliminate the need to measure AIF manually without compromising the diagnostic performance to detect the malignancy in the clinical setting.

Keywords: arterial input function; breast cancer; capillary input function; deep learning; dynamic contrast enhanced MRI.


Figures

Figure 1.
Figure 1.
Pharmacokinetic models used in this study. The extended Tofts model (eTofts) with an arterial input function instantly mixes in the capillary bed (left) and Two-compartment exchange model (TCM) and the extended vascular-tree model (EVM) that models the transport and the dispersion of the arterial input function to the capillary bed (middle) and the Capillary Exchange Model (CXM) with a capillary input function predicted by the trained network as the input (right). The estimated kinetic parameters from each model are ve, volume fraction of extracellular-extravascular space (EES); vp, volume fraction of the blood plasma compartment; Fp, the blood flow from the artery to the capillary bed; PS, the bidirectional endothelial permeability-surface product; t0, the time it takes for a contrast agent to pass through each branch of vessel in the arterial tree.
Figure 2.
Figure 2.
(a)An example of a drawn ROI at the aorta for acquiring the case-specific AIF. An example of a drawn ROI for (b) a malignant lesion and for (c) a benign lesion. (d)An example of a case-specific AIF acquired from aorta and the AIF-model fitted function used in this study (top) and an example of a contrast concentration-time curve for a malignant and a benign lesion (bottom) An example of the capillary-level input function modelled with TCM and EVM calculated from the estimated kinetic parameters for (e) a malignant (top) and a benign lesion (bottom).
Figure 3.
Figure 3.
(a) A small patch with a 3-by-3 pixel window of DCE data is re-aligned as the 2-dimensional matrix YRM,T, where M is 9 with a 3 × 3 patch, and T is 22 temporal frames in our study (b) Schematic diagram for the proposed deep neural network structure. Total of 12 convolutional layers are connected series with the skip connections in the middle layers. The network receives a patch of DCE data and estimates the capillary level input function for the center voxel of the patch.
Figure 4.
Figure 4.
(a) Fraction of selected model among the extended Tofts (eTofts), the extended vascular-tree model (EVM) and the two-compartment exchange model (TCM) for each voxel in malignant (top) or benign (bottom) cases. The model selection is performed using Akaike information criterion (AIC), based on the number of parameters in each model and the fitting residue between the acquired signal and the estimated contrast dynamics. (b) Summary of the Pharmacokinetic (PK) model analysis using the case-specific AIF acquired from the aorta. The box-whisker plot displays the median values of each estimated PK parameters in each subject. Asterisks (*) indicates the significant difference between the malignant and the benign group, tested using the Wilcoxon rank sum test at the 5% significance level. ve, volume fraction of extracellular-extravascular space (EES); vp, volume fraction of the blood plasma compartment; Fp, the blood flow from the artery to the capillary bed; PS, the bidirectional endothelial permeability-surface product; t0, the time it takes for a contrast agent to pass through each branch of vessel in the arterial tree.
Figure 5.
Figure 5.
Summary of the pharmacokinetic model analysis on the test set of 1,000 simulated patches for the deep neural network trained with the simulated patches generated using the TCM (left) and the EVM (right). The pharmacokinetic model analysis was performed using the same AIF used for patch generation (Ca) with respective models and the network-predicted CIF (Cp) with the Capillary Exchange Model (CXM). Same set of analysis was also repeated on the test dataset after mixing a Gaussian noise with a variance of 5% of base-line signal to both real and imaginary channel. The magnitude images were used for the analysis, introducing the Rician noise to the simulated patches. The pair-wise error rate was calculated from each estimated kinetic parameter against the ground-truth parameter used for the data generation.
Figure 6.
Figure 6.
Example of the estimated pharmacokinetic parameter maps using the case-specific AIF (Ca) with Two Compartment exchange Model (TCM), the extended vascular-tree model (EVM) or the extended Tofts model (eTofts). Among these three models, the model selection was performed using the Akaike information criterion (AIC). The capillary-level input function was estimated from both deep neural network trained with TCM patches (CXM (Cp-TCM)) and with the EVM patches (CXM (Cp-EVM)). Similar pharmacokinetic model analysis was conducted using the network-predicted CIF using the Capillary Exchange Model (CXM). The lesions were marked by our radiologist. Each row shows the estimated parameter maps: ve, volume fraction of extracellular-extravascular space (EES); vp, volume fraction of the blood plasma compartment; and PS, the bidirectional endothelial permeability-surface product.
Figure 7.
Figure 7.
The median values of the estimated pharmacokinetic parameters, ve, vp, and PS. The parameters estimated with the case-specific arterial input function (AIF) using 3 models (TCM, EVM and eTofts) and model selection was performed using AIC (AIC-sel(Ca)). The capillary-level input function (CIF) was estimated using either the network trained with TCM patches (CXM (Cp-TCM)) or with EVM patches (CXM (Cp-EVM)). Asterisks (*) indicates the significant difference between the malignant and the benign group, tested using the Wilcoxon rank sum test at the 5% significance level. The estimated parameters from each model are: ve, volume fraction of extracellular-extravascular space (EES); vp, volume fraction of the blood plasma compartment; and PS, the bidirectional endothelial permeability-surface product.
Figure 8.
Figure 8.
Receiver Operating Characteristic (ROC) curve for the logistic regression models using the parameters estimated with the case-specific AIF using Two Compartment exchange Model (TCM), the Extended Vascular-tree Model (EVM), the extended Tofts model (eTofts) and AIC-selected parameters among these 3 models (AIC-sel). Similar analysis was performed with the paramteres estimated with the network-predicted CIF from the network trained with either TCM patches (CXM (Cp-TCM)) or the EVM patches (CXM (Cp-EVM)). With the network-predicted CIF, the Capillary Exchange Model (CXM) was used for estimating parameters.

Similar articles

Cited by

References

    1. O'Connor JP, Jackson A, Parker GJ, Jayson GC. DCE-MRI biomarkers in the clinical evaluation of antiangiogenic and vascular disrupting agents. Br J Cancer. 2007;96(2):189–95. - PMC - PubMed
    1. Kim SG, Freed M, Leite APK, Zhang J, Seuss C, Moy L. Separation of benign and malignant breast lesions using dynamic contrast enhanced MRI in a biopsy cohort. Journal of Magnetic Resonance Imaging. 2017;45(5):1385–93. - PMC - PubMed
    1. Greer MD, Shih JH, Lay N, Barrett T, Kayat Bittencourt L, Borofsky S, et al. Validation of the dominant sequence paradigm and role of dynamic contrast-enhanced imaging in PI-RADS version 2. Radiology. 2017;285(3):859–69. - PMC - PubMed
    1. Abdullah SS, Pialat JB, Wiart M, Duboeuf F, Mabrut JY, Bancel B, et al. Characterization of hepatocellular carcinoma and colorectal liver metastasis by means of perfusion MRI. Journal of Magnetic Resonance Imaging: An Official Journal of the International Society for Magnetic Resonance in Medicine. 2008;28(2):390–5. - PubMed
    1. Taouli B, Johnson RS, Hajdu CH, Oei MT, Merad M, Yee H, et al. Hepatocellular carcinoma: perfusion quantification with dynamic contrast-enhanced MRI. American Journal of Roentgenology. 2013;201(4):795–800. - PMC - PubMed

Publication types