. 2022 Feb;26(4):1128-1143.
doi: 10.1111/jcmm.17166. Epub 2022 Jan 9.

The role of E2A in ATPR-induced cell differentiation and cycle arrest in acute myeloid leukaemia cells

Affiliations

The role of E2A in ATPR-induced cell differentiation and cycle arrest in acute myeloid leukaemia cells

Meiju Zhang et al. J Cell Mol Med. 2022 Feb.

Abstract

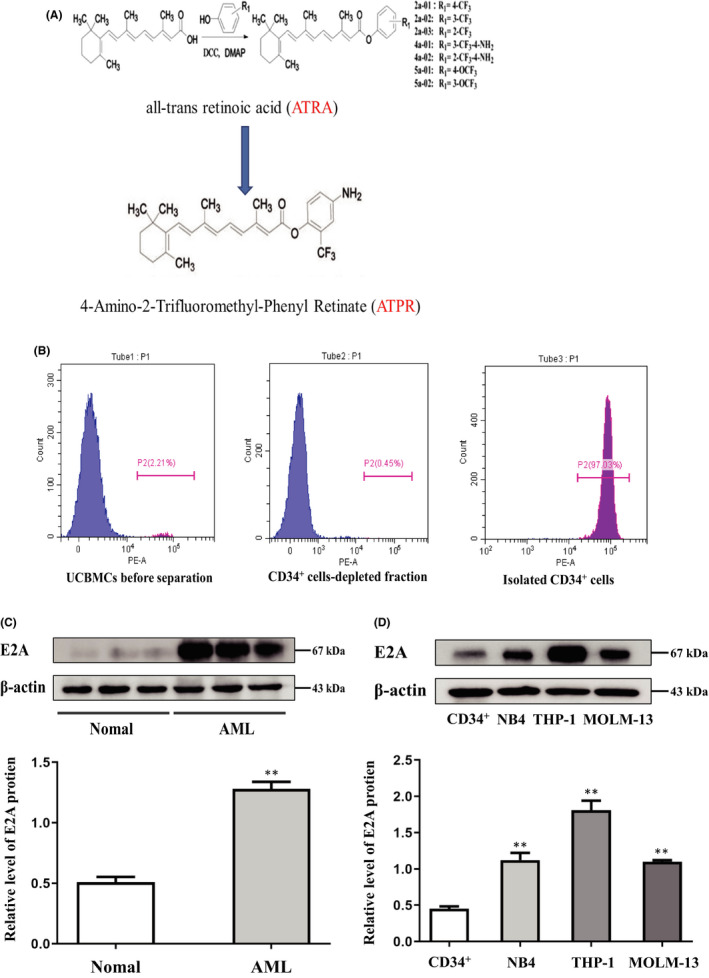
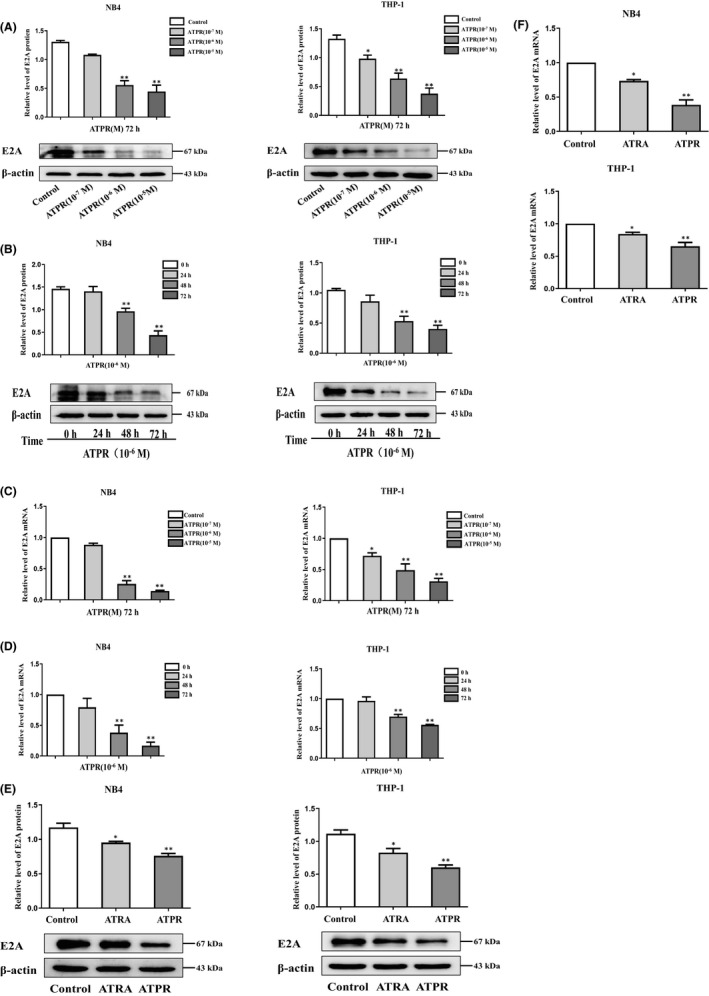
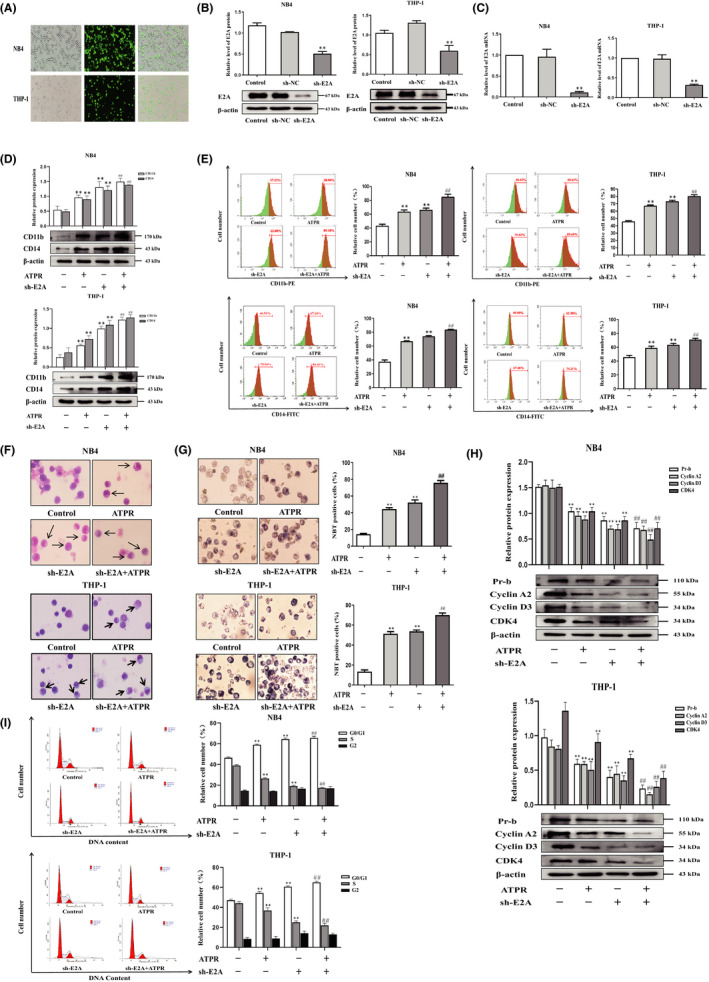
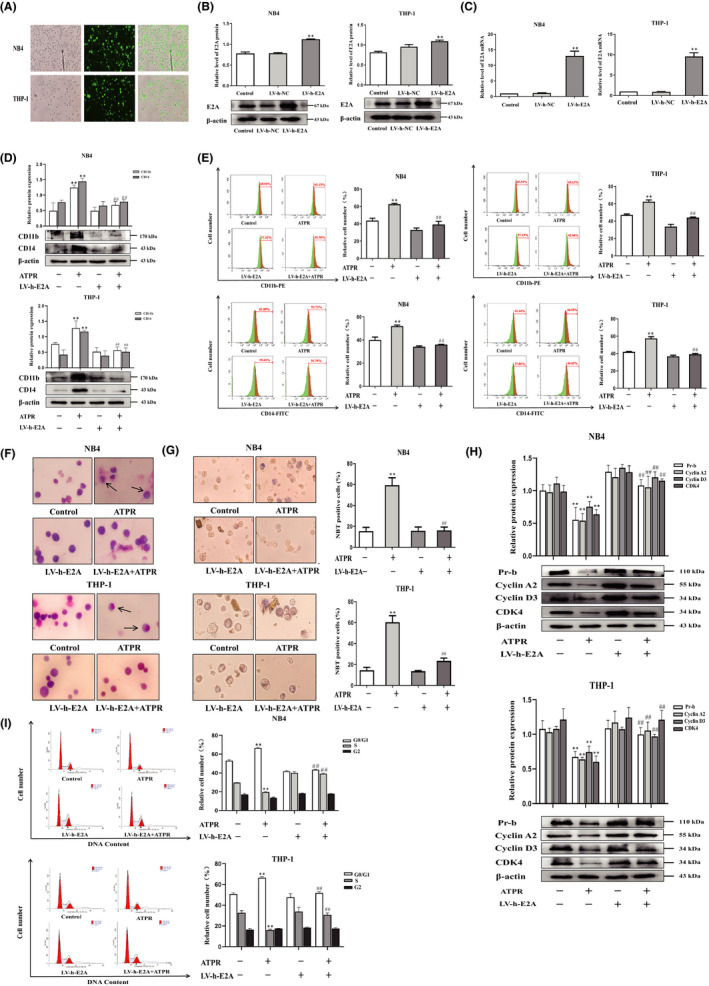
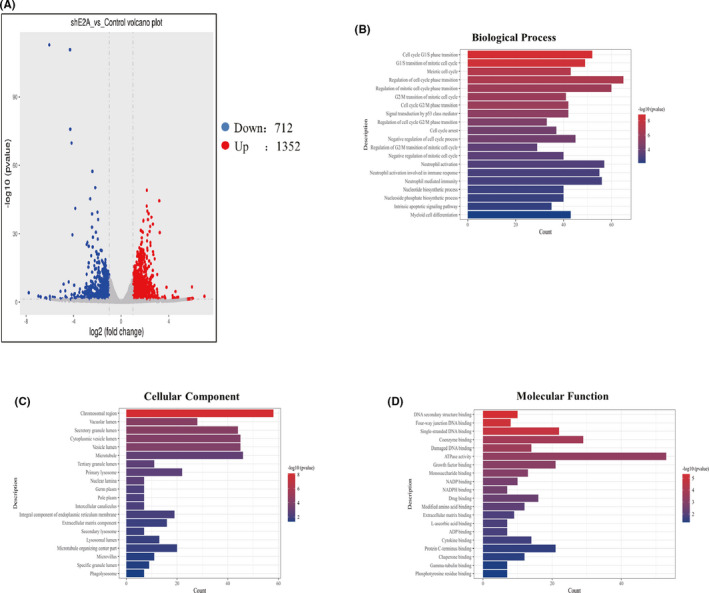
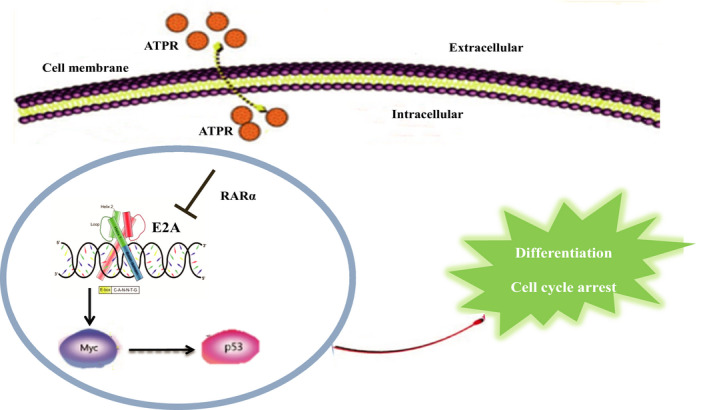
Acute myeloid leukaemia (AML) is a biologically heterogeneous disease with an overall poor prognosis; thus, novel therapeutic approaches are needed. Our previous studies showed that 4-amino-2-trifluoromethyl-phenyl retinate (ATPR), a new derivative of all-trans retinoic acid (ATRA), could induce AML cell differentiation and cycle arrest. The current study aimed to determine the potential pharmacological mechanisms of ATPR therapies against AML. Our findings showed that E2A was overexpressed in AML specimens and cell lines, and mediate AML development by inactivating the P53 pathway. The findings indicated that E2A expression and activity decreased with ATPR treatment. Furthermore, we determined that E2A inhibition could enhance the effect of ATPR-induced AML cell differentiation and cycle arrest, whereas E2A overexpression could reverse this effect, suggesting that the E2A gene plays a crucial role in AML. We identified P53 and c-Myc were downstream pathways and targets for silencing E2A cells using RNA sequencing, which are involved in the progression of AML. Taken together, these results confirmed that ATPR inhibited the expression of E2A/c-Myc, which led to the activation of the P53 pathway, and induced cell differentiation and cycle arrest in AML.

Keywords: E2A; P53 pathway; acute myeloid leukaemia; c-Myc; cycle arrest; differentiation.


Conflict of interest statement

The authors have no conflicts of interest to disclose.

Figures

FIGURE 1
FIGURE 1
High E2A expression in AML cell lines and patient samples. (A) Structure of new derivative 4‐amino‐2‐trifloromethyl‐phenyl retinate (ATPR) of all‐trans retinoic acid (ATRA) (B) CD34+ cells was purified from cord blood and identified by CytoFLEX. (C) Western blotting analysis of E2A expression in AML specimens and normal control. (D) Western blotting analysis of E2A expression in AML cell lines (NB4, THP‐1 and MOML‐13) and CD34+ cells. Values were presented as mean ± SD of three independent experiments. *p < .05, **p < .01 versus control group
FIGURE 2
FIGURE 2
E2A expression in AML cells was inhibited by ATPR treatment. (A) NB4/THP‐1 cells were treated with an ATPR concentration gradient (10−5 to 10−7 M) for 72 h. (B) NB4/THP‐1 cells were treated with ATPR (10−6 M) at different time points (0, 24, 48 and 72 h). Then, the protein expression of E2A was assessed by western blot. β‐Actin was used as the loading control. (C) NB4/THP‐1 cells were treated with ATPR in different the mRNA expression of E2A were analysed by qPCR. (D) NB4/THP‐1 cells were treated with ATPR in different times, and the mRNA expression of E2A was analysed by qPCR. (E) NB4/THP‐1 cells were treated with ATRA and ATPR (10−6 M, 72 h), and the protein expression of E2A was assessed by western blotting. (F) NB4/THP‐1 cells were treated with ATRA and ATPR (10−6 M, 72 h), the mRNA expression of E2A was analysed by qPCR. All the data are expressed in mean ± SD of three independent experiments. *p < 0.05, **p < 0.01, vs. control group
FIGURE 3
FIGURE 3
ATPR‐induced AML cell differentiation and cycle arrest were enhanced in the absence of E2A. NB4/THP‐1 cells were transfected with lentivirus containing E2A shRNA to downregulated E2A expression. After cells were exposed to ATPR (10−6 M) for another 72 h, a series of independent experiments were conducted as follows. (A) The stable control and sh‐E2A‐transfected NB4/THP‐1 cells were observed by an inversed fluorescent microscope. (B) After treatment with sh‐E2A for 3 days, the protein expression of E2A was assessed by western blotting. (C) After treatment with sh‐E2A for 3 days, the mRNA expression of E2A was assessed by qPCR. (D) After E2A was silenced, cell surface differentiation antigens CD11b and CD14 levels were assessed by western blotting. (E) After E2A was silenced, cell differentiation status was further measured using flow cytometry analysis. (F) After E2A was silenced, cell morphological assays were assessed by Wright–Giemsa staining. Arrows indicate cells with matured morphology, which exhibit kidney‐shaped nucleus and decreased nuclear/cytoplasm ratio. (G) After E2A was silenced, the inversed fluorescent microscope was used to observe the positive cell by NBT reduction experiment. (H) The protein expression of Pr‐b, cyclin D3, cyclin A2 and CDK4 was determined by western blotting analysis. (I) The distribution of cell cycle was analysed by flow cytometer. Data are represented as the mean ± SD. of three independent experiments. *p < 0.05, **p < 0.01 versus negative control group. #p < 0.05, ##p < 0.01 vs. ATPR group
FIGURE 4
FIGURE 4
Overexpression of E2A reversed ATPR‐induced differentiation and cycle arrest of AML cells. NB4/THP‐1 cells were transfected with lentivirus containing E2A LV‐h‐RNA to upregulated E2A expression. After cells were exposed to ATPR (10−6 M) for another 72 h, a series of independent experiments were conducted as follows. (A) The stable control and LV‐h‐E2A‐transfected NB4/THP‐1 cells were observed by an inversed fluorescent microscope. (B) After treatment with LV‐h‐E2A for 3 days, the protein expression of E2A was assessed by western blotting. (C) After treatment with LV‐h‐E2A for 3 days, the mRNA expression of E2A was assessed by qPCR. (D) After E2A was overexpressed, cell surface differentiation antigens CD11b and CD14 levels were assessed by western blotting. (E) After E2A was overexpressed, cell differentiation status was further measured using flow cytometry analysis. (F) After E2A was overexpressed, cell morphological assays were assessed by Wright–Giemsa staining. Arrows indicate cells with matured morphology, which exhibit kidney‐shaped nucleus and decreased nuclear/cytoplasm ratio. (G) After E2A was overexpressed, and the inversed fluorescent microscope was used to observe the positive cell by NBT reduction experiment. (H) The protein expression of Pr‐b, cyclin D3, cyclin A2 and CDK4 was determined by western blotting analysis. (I) The distribution of cell cycle was analysed by flow cytometer. Data are represented as the mean ± SD. of three independent experiments. *p < 0.05, **p < 0.01 vs. negative control group. #p < 0.05, ##p < 0.01 versus ATPR group
FIGURE 5
FIGURE 5
Identification of E2A response genes. (A) Volcano plots of differentially expressed E2A relative to the control group. (B) Top 20 upregulated BP terms during E2A silence in AML cells were ranked by enrichment score. (C) Top 20 upregulated CC terms during E2A silence in AML cells were ranked by enrichment score. (D) Top 20 upregulated MF terms during E2A silence in AML cells were ranked by enrichment score
FIGURE 6
FIGURE 6
E2A drives AML by upregulating c‐Myc and inhibiting the P53 signalling pathway, and ATPR could suppress the E2A/c‐Myc axis. (A) Western blotting analysis of P53/ P‐P53 and c‐Myc protein levels in AML and normal samples. (B) Western blotting analysis of P53/P‐P53 and c‐Myc expression in AML cell lines (NB4, THP‐1 and MOML‐13) and CD34+ cells. (C) The binding of E2A and c‐Myc in immunoprecipitation complex was validated by western blotting. (D) E2A and c‐Myc colocalized in the cytoplasm. (E) KEGG analysis of upregulated pathway genes when E2A was knockout. (F) After E2A was silenced, P53/P‐P53 and c‐Myc expression in AML cells was measured using western blotting analysis. (G) After E2A was overexpression, P53/P‐P53 and c‐Myc expression in AML cells measured using analysis. (H) The OE‐Myc plasmid‐transfected NB4/THP‐1 cells were observed by an inversed fluorescent microscope. (I) The protein levels of p53 were confirmed by western blot in E2A knockdown cells and in plasmid‐infected cells overexpressing c‐Myc. (J) NB4/THP‐1 cells were treated with ATRA and ATPR (10−6 M, 72 h), the expression of P53/P‐P53 and c‐Myc was analysed by western blotting. Data are represented as the mean ± SD. of three independent experiments. *p < 0.05, **p < 0.01 vs. negative control group. #p < 0.05, ##< 0.01 vs. ATPR group
FIGURE 7
FIGURE 7
Loss of E2A inhibits tumorigenesis in vivo. 24 NSG mice were randomly divided into four groups (n = 6). NB4/THP‐1 cells (5 × 106) transfected with sh‐NC and sh‐E2A were injected subcutaneously in the right shoulder. (A) Tumour images of the xenograft mice were taken at the end of the experiment (n = 6 mice per group). (B and C) The tumour volume and weight of xenograft mice were measured during the observation period. (D) Two representative tumour tissues from each group were fixed, and immunohistochemistry staining was performed on E2A, c‐Myc, CD11b, cyclin A2 and CDK4. (E) Western blotting analysis of CD11b, CD14, Pr‐b and cyclin D3 in tumour tissues of sh‐NC and sh‐E2A groups. (F) Western blotting analysis of P‐P53/p53 and c‐Myc in tumour tissues of sh‐NC and sh‐E2A groups. β‐Actin was used as an internal control. Bar graphs (mean ± SD) and representative images are shown. *p < 0.05, **p < 0.01, compared with the NC group
FIGURE 8
FIGURE 8
The schematic diagram illustrates ATPR‐induced acute myeloid leukaemia cells differentiation and cycle arrest by blockade of E2A/c‐Myc/P53 pathway. ATPR induces cell differentiation and cycle arrest in vitro and in vivo by inhibiting the expression of E2A/c‐Myc and activating the P53 pathway

Similar articles

References

    1. Aanei C, Veyrat‐Masson R, Rigollet L, et al. Advanced flow cytometry analysis algorithms for optimizing the detection of "different from normal" immunophenotypes in acute myeloid blasts. Front Cell Dev Biol. 2021;9:735518. - PMC - PubMed
    1. Lehrnbecher T, Varwig D, Kaiser J, Reinhardt D, Klingebiel T, Creutzig U. Infectious complications in pediatric acute myeloid leukemia: analysis of the prospective multi‐institutional clinical trial AML‐BFM 93. Leukemia. 2004;18(1):72‐77. - PubMed
    1. Just Vinholt P, Højrup Knudsen G, Sperling S, Frederiksen H, Nielsen C. Platelet function tests predict bleeding in patients with acute myeloid leukemia and thrombocytopenia. Am J Hematol. 2019;94(8):891‐901. - PubMed
    1. Siegel R, Miller K, Fuchs H, Jemal A. Cancer Statistics, 2021. CA Cancer J Clin. 2021;71(1):7‐33. - PubMed
    1. Yilmaz M, Kantarjian H, Ravandi F. Acute promyelocytic leukemia current treatment algorithms. Blood Cancer J. 2021;11(6):123. - PMC - PubMed

Publication types