Review
. 2022 Oct 1;102(4):1757-1836.
doi: 10.1152/physrev.00004.2021. Epub 2022 Jan 10.

Physiology and pathophysiology of human airway mucus

Affiliations
Review

Physiology and pathophysiology of human airway mucus

David B Hill et al. Physiol Rev. .

Abstract

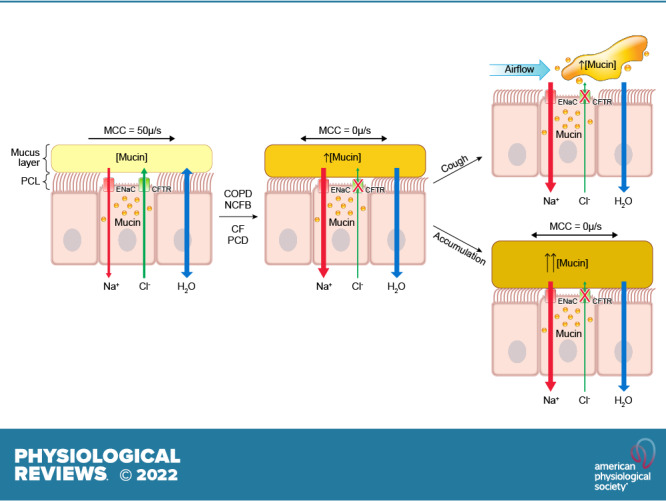
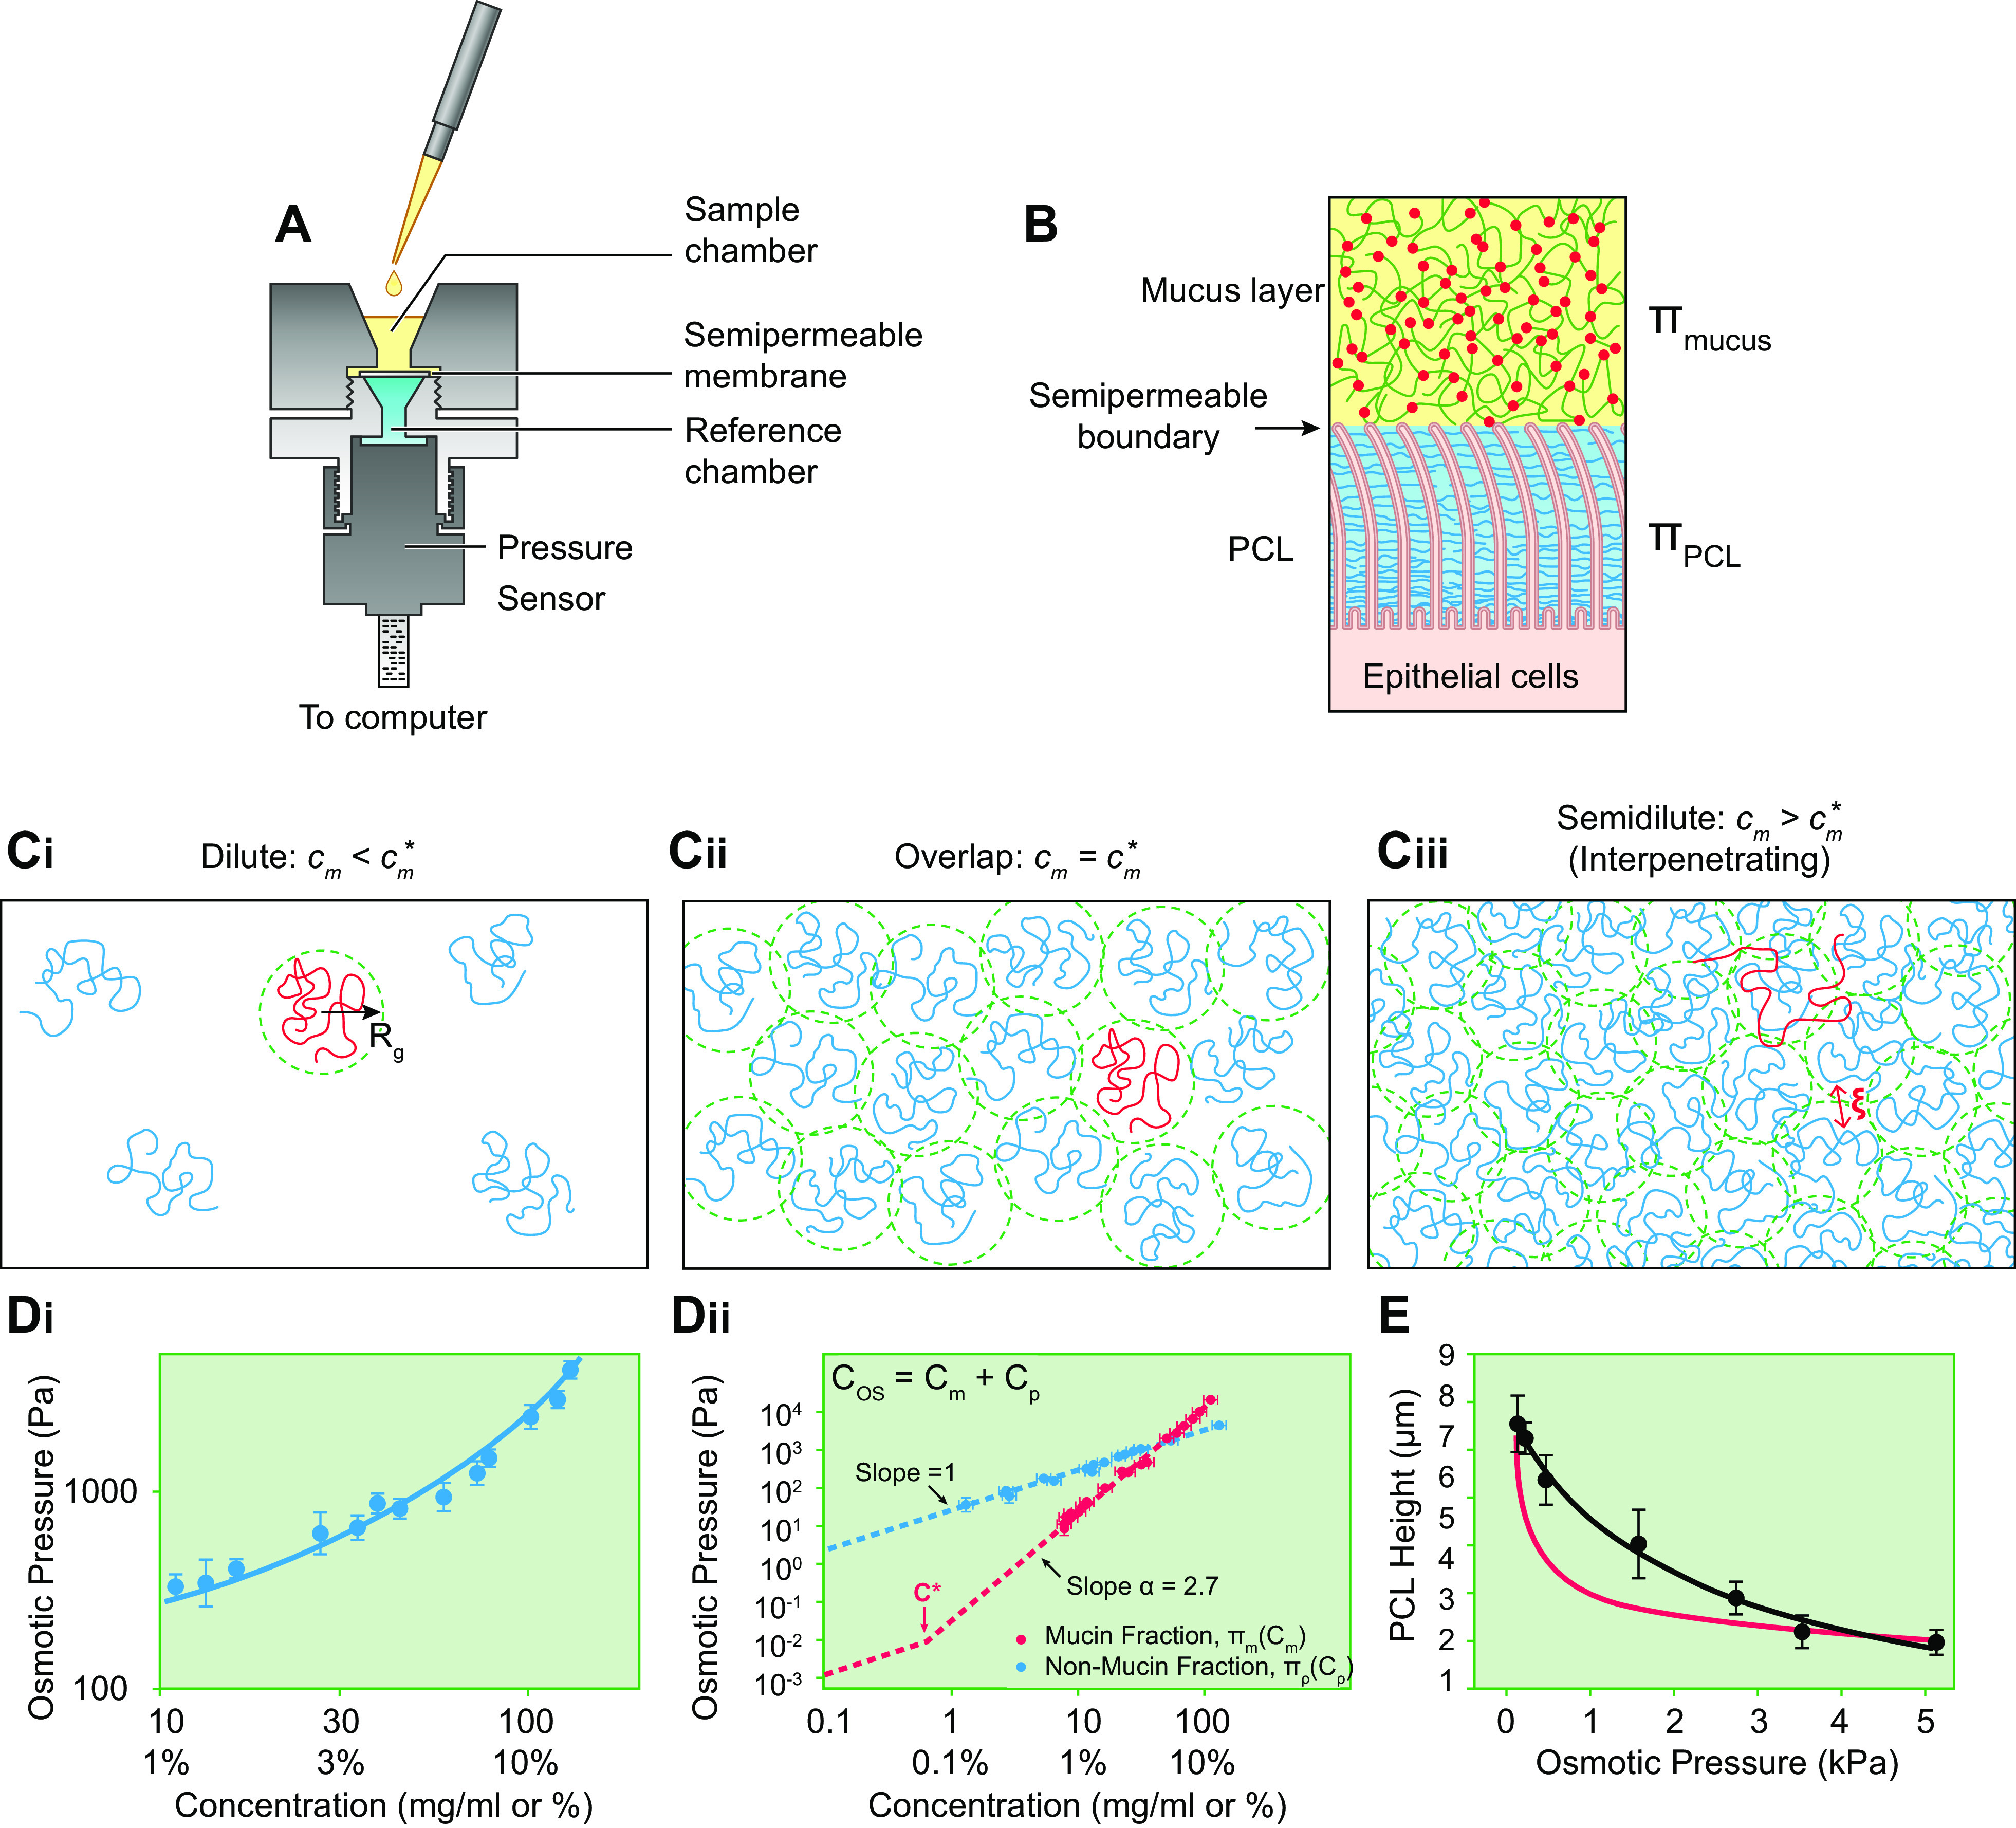
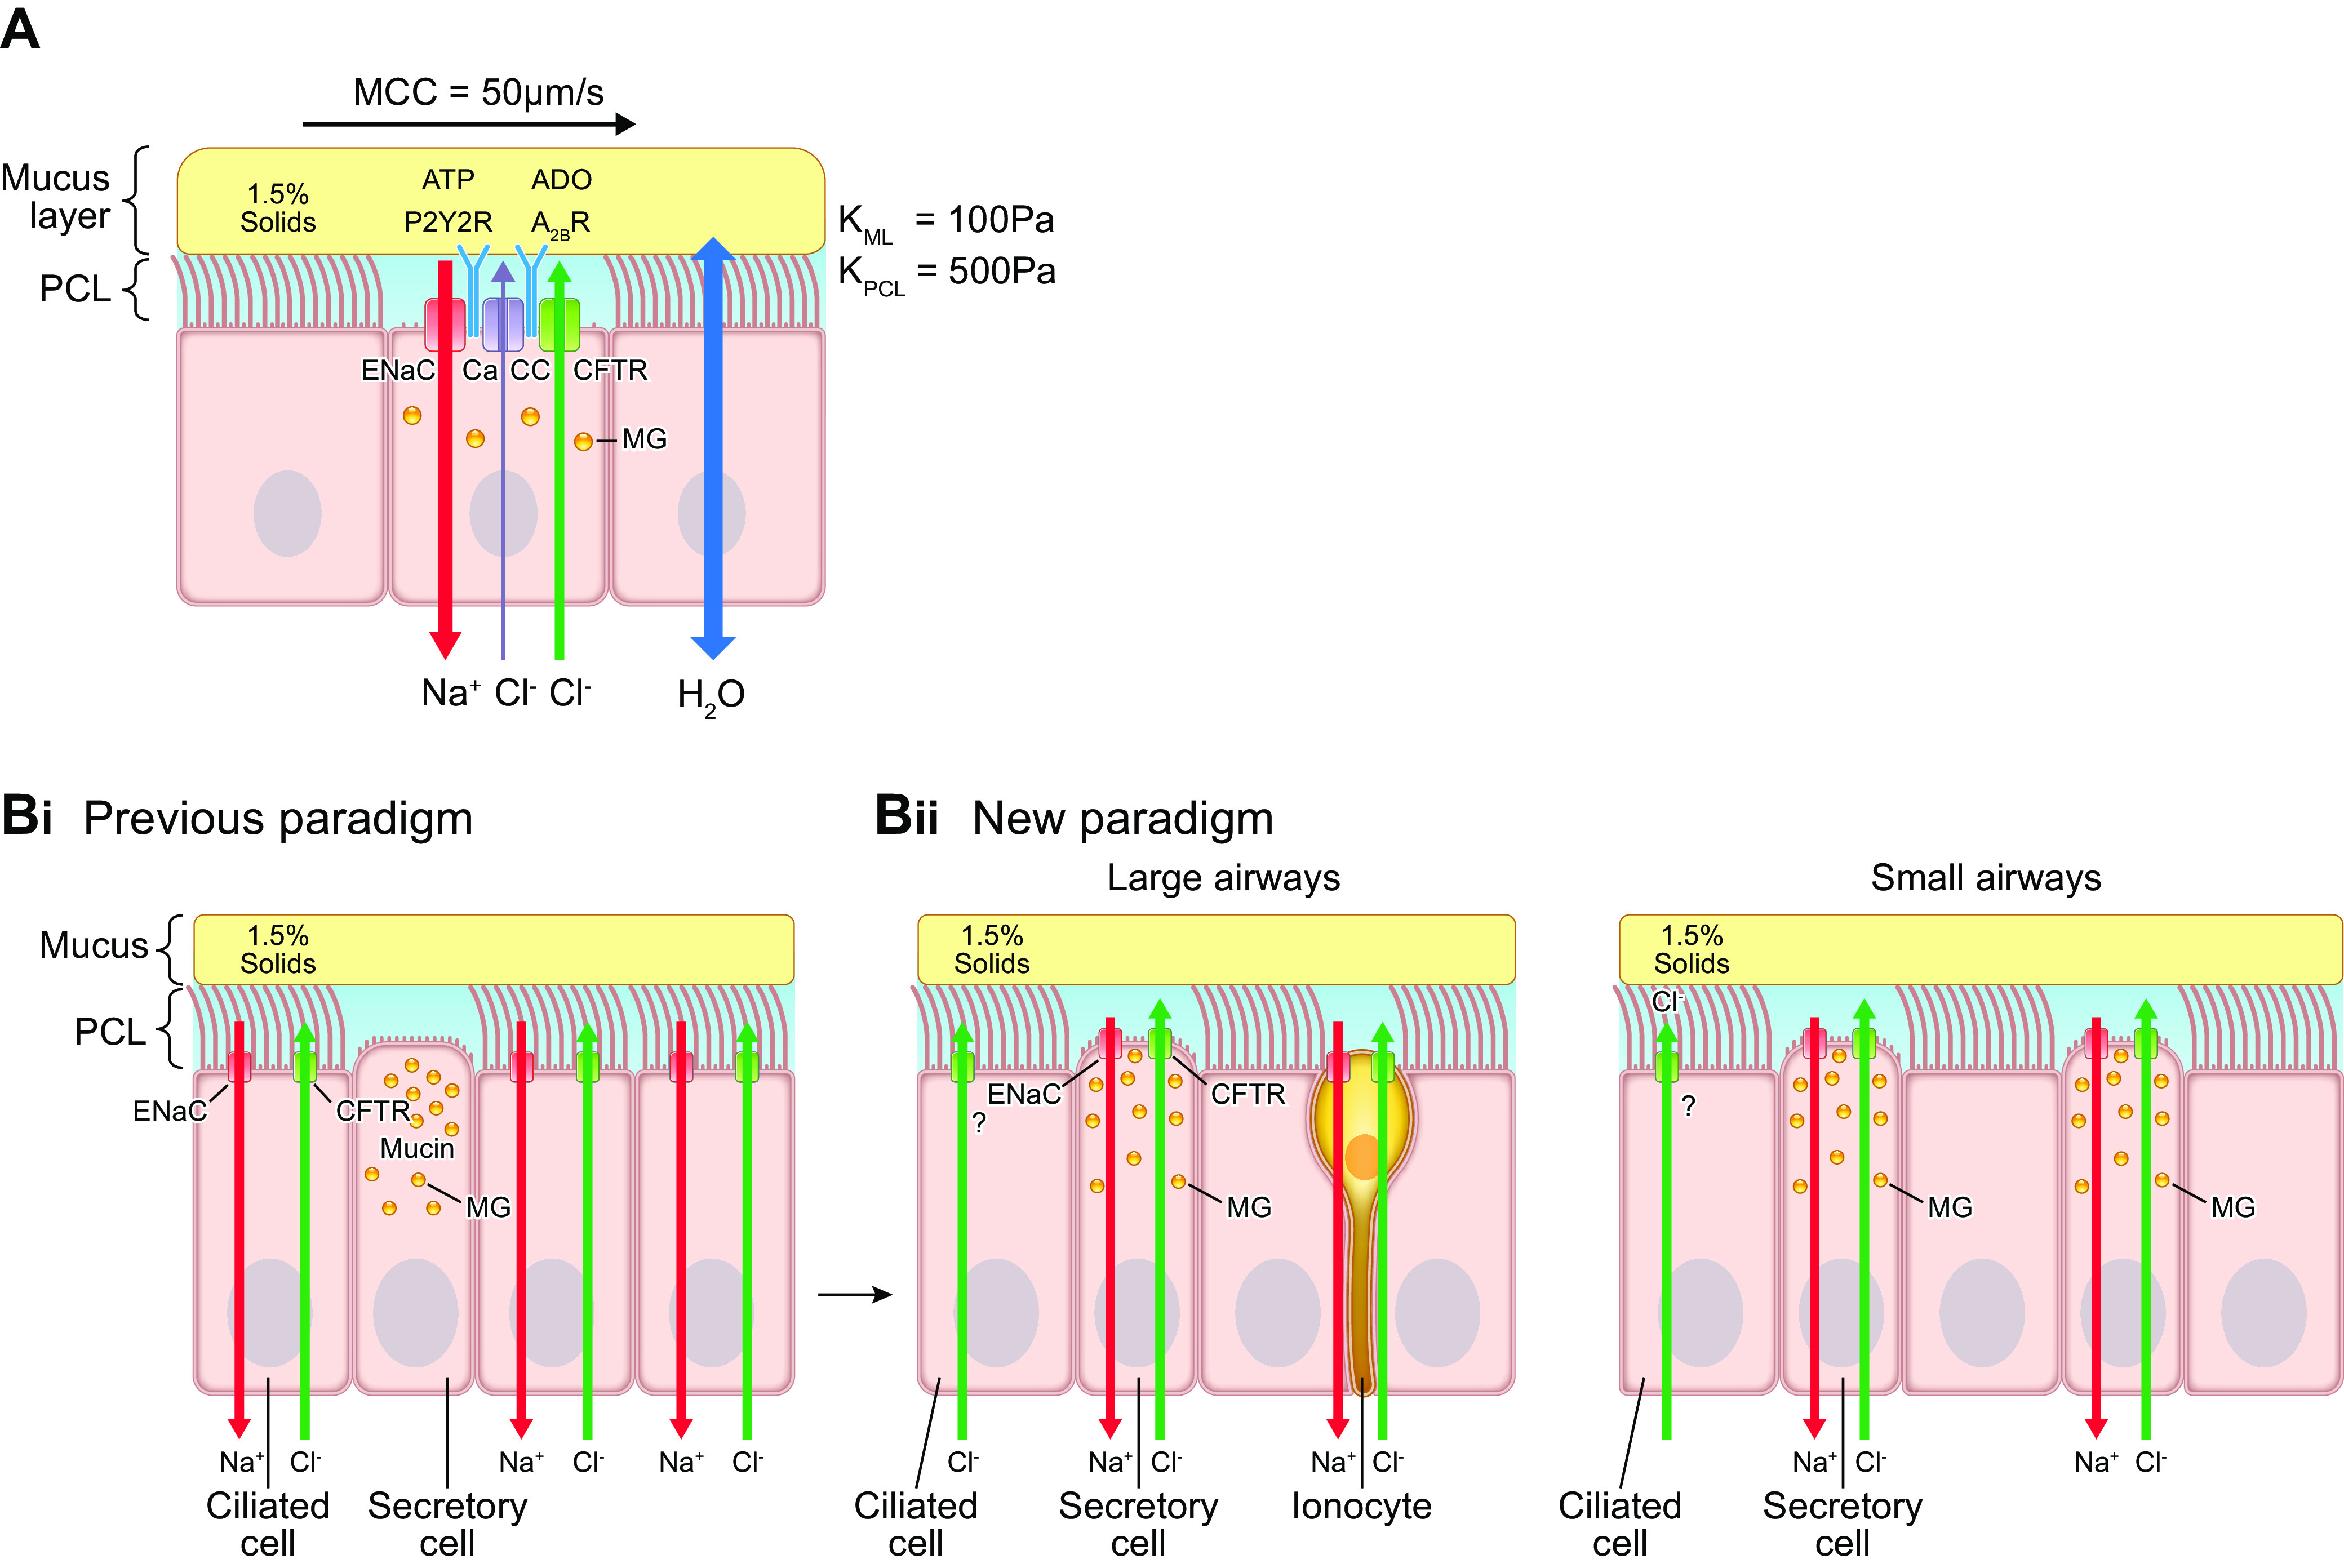
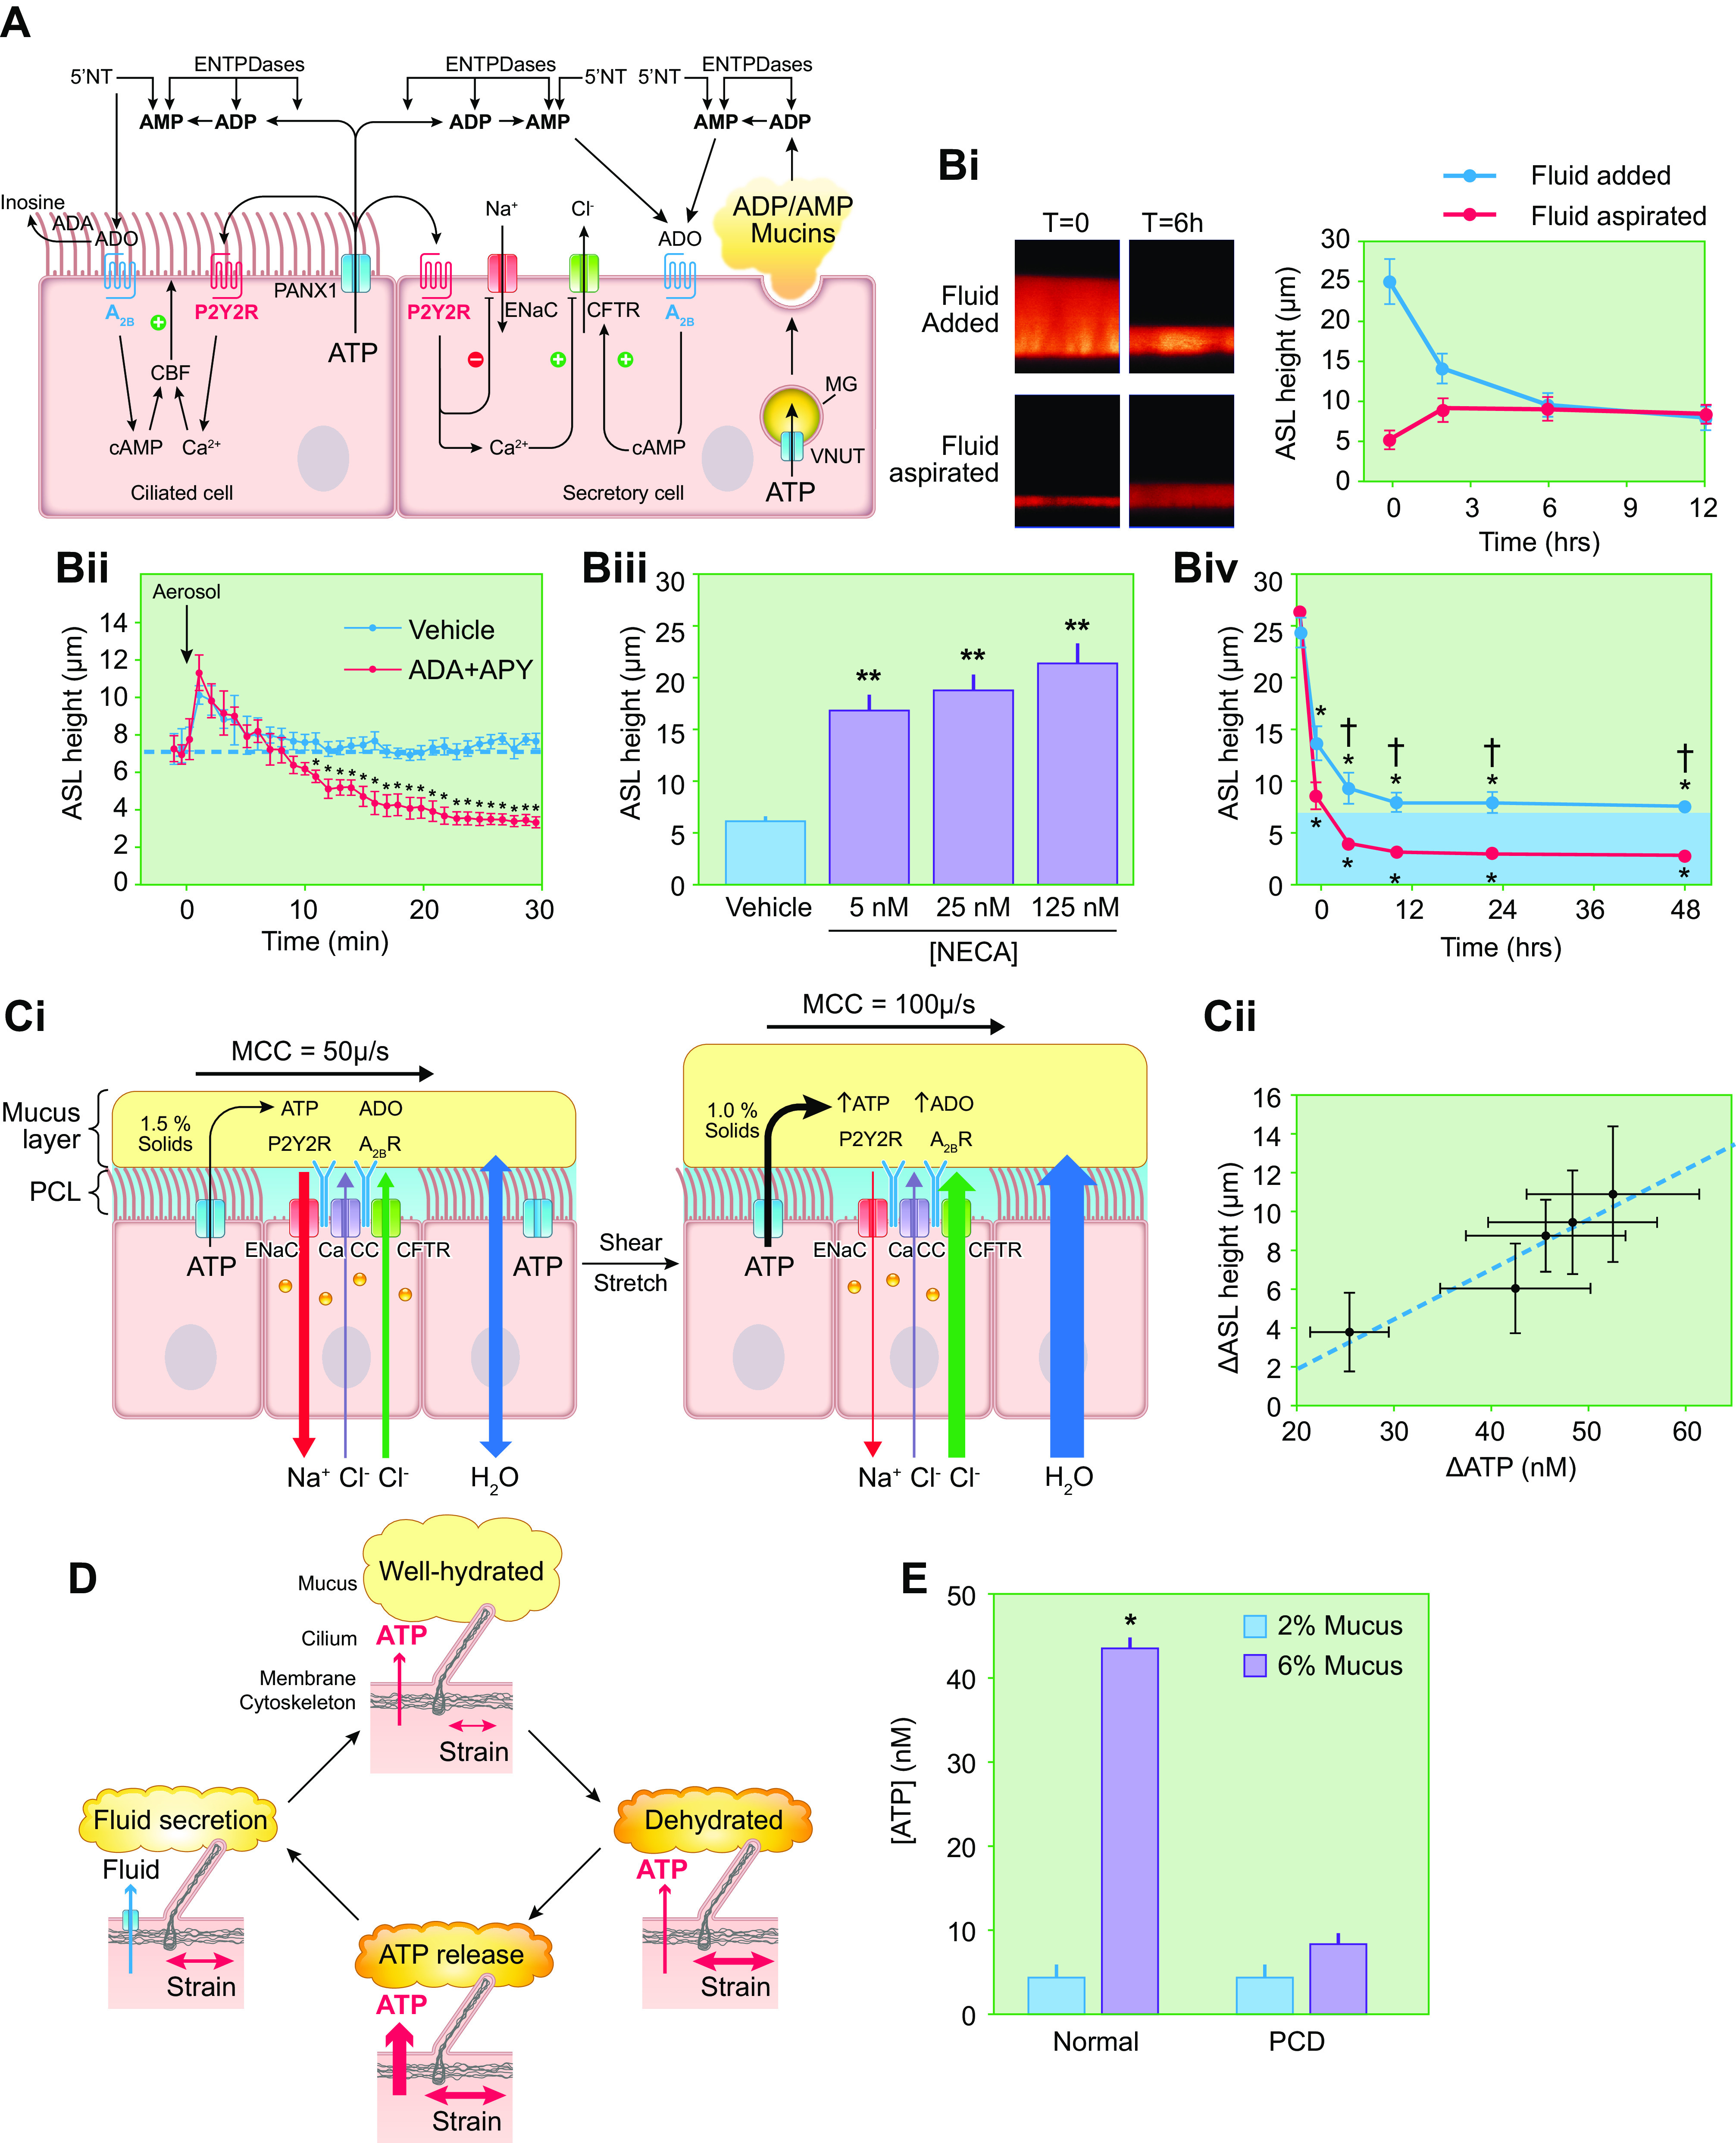
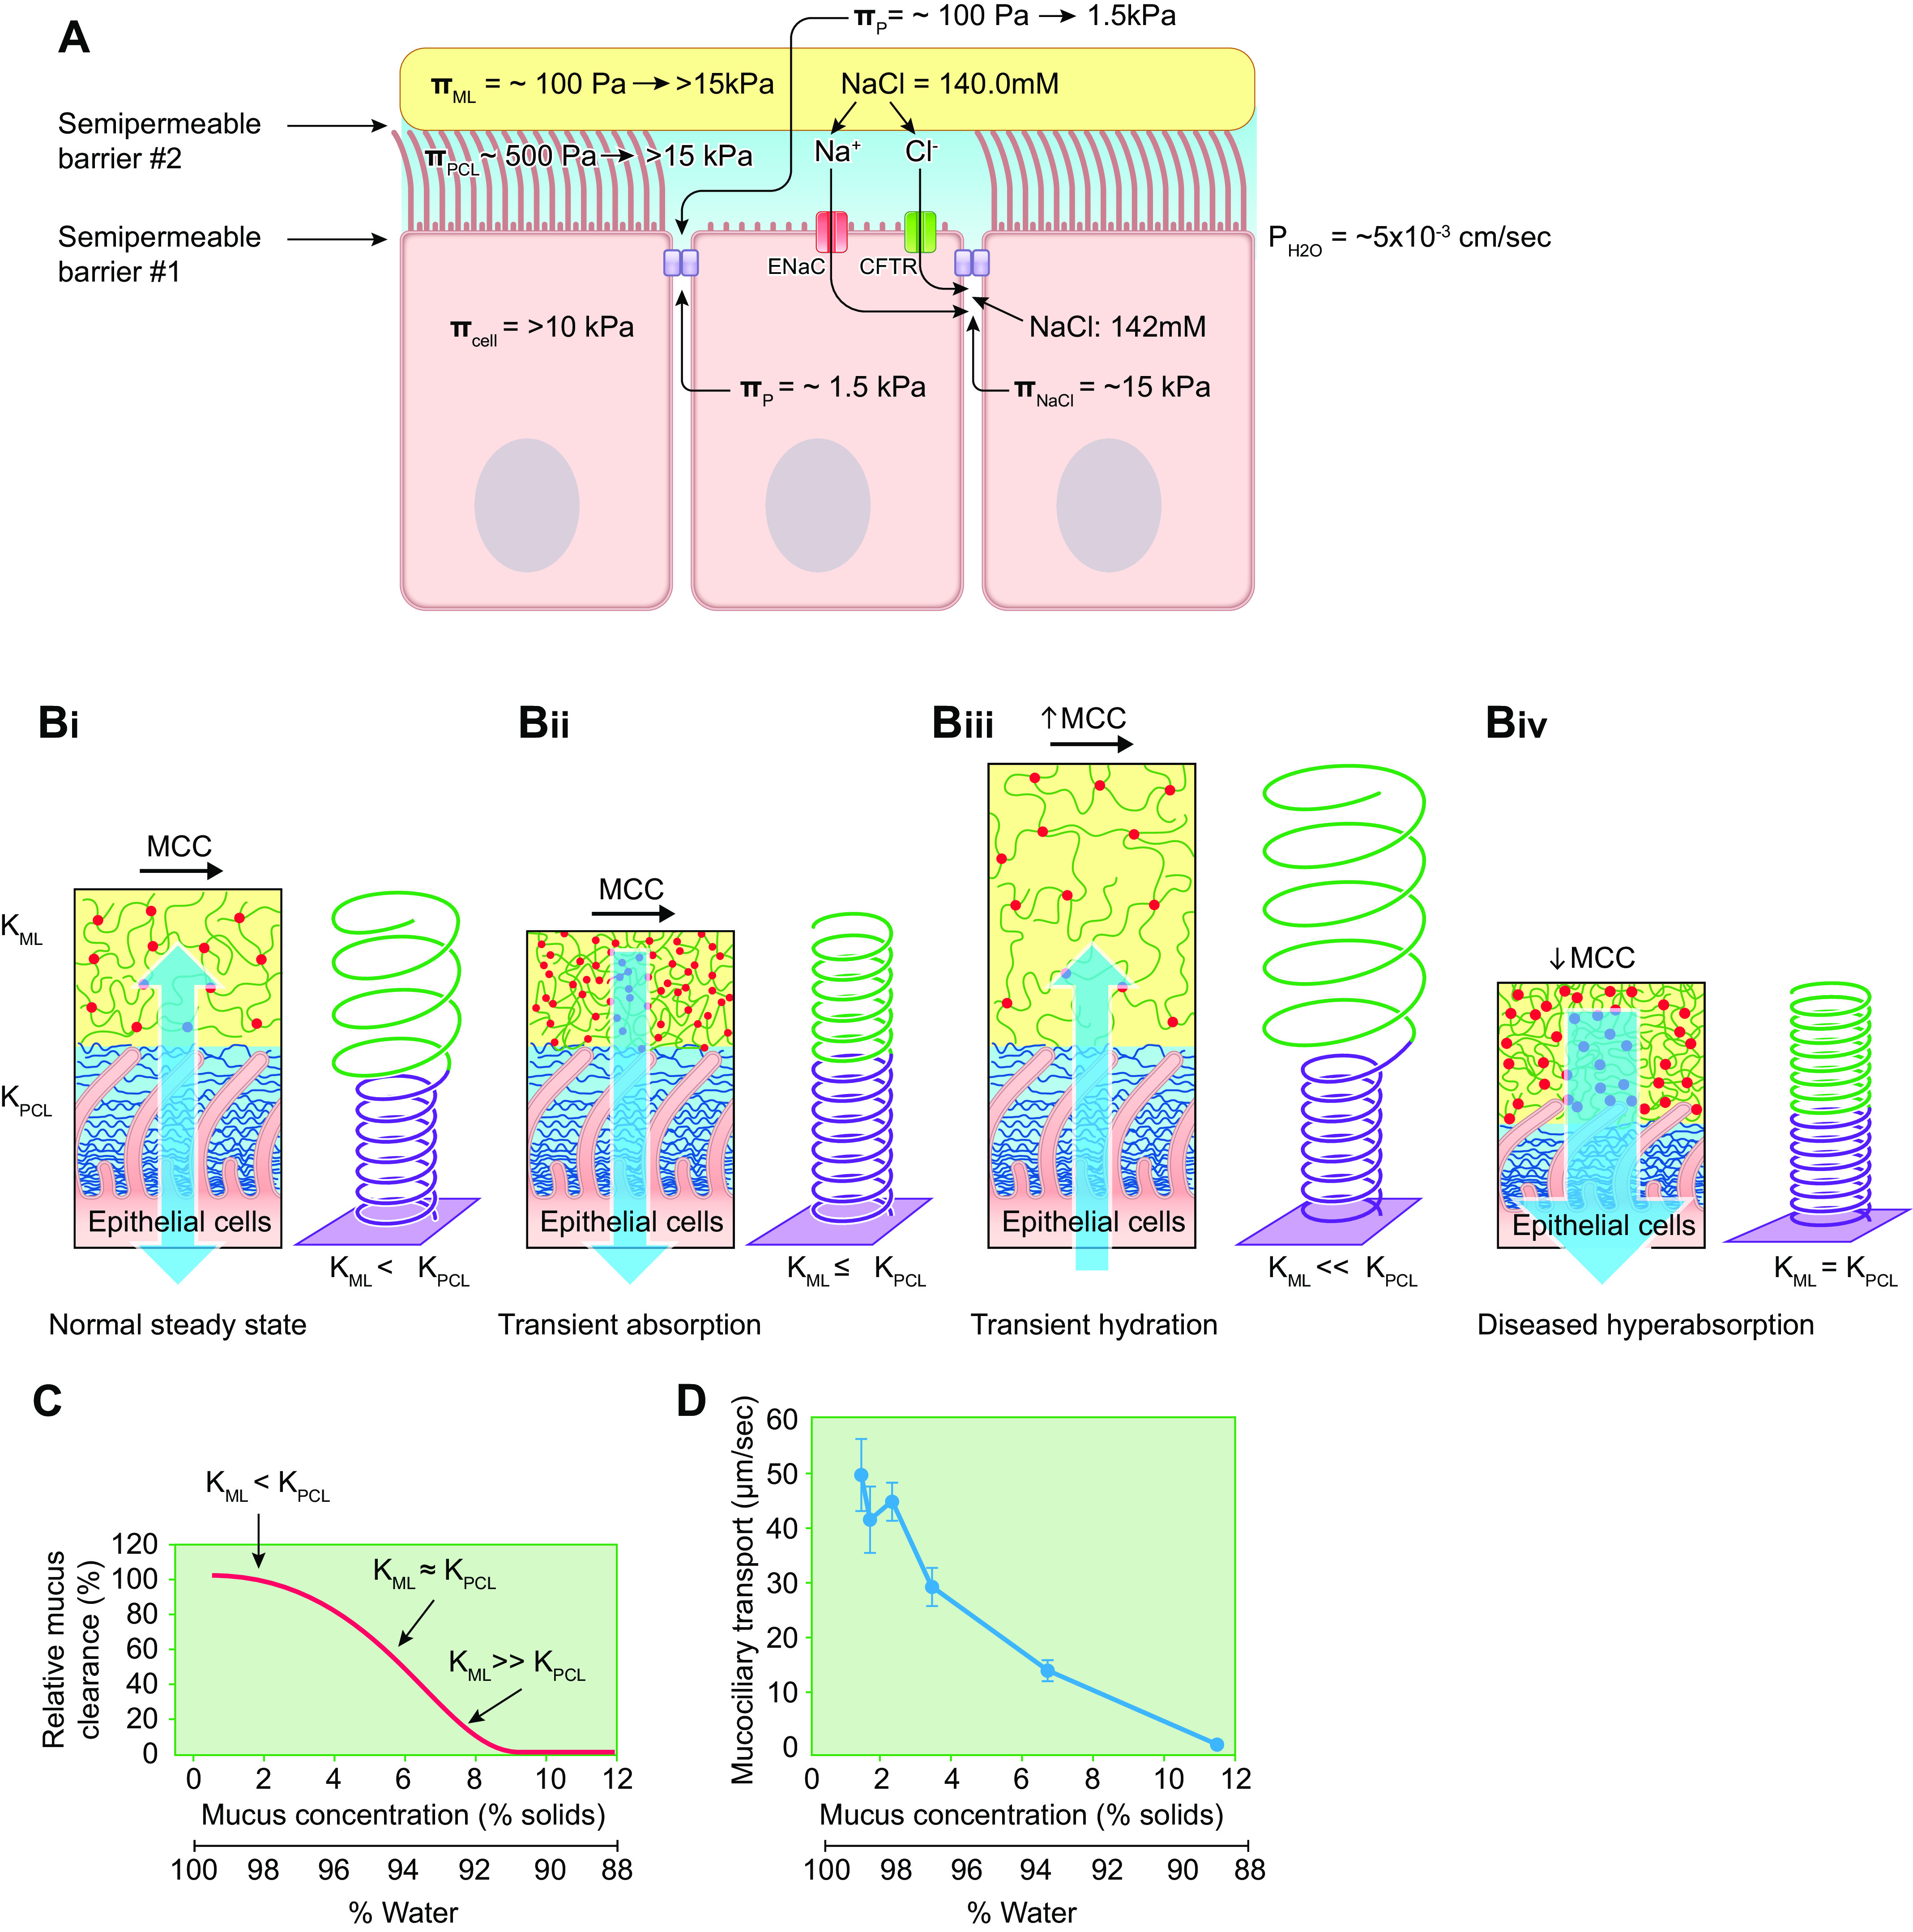
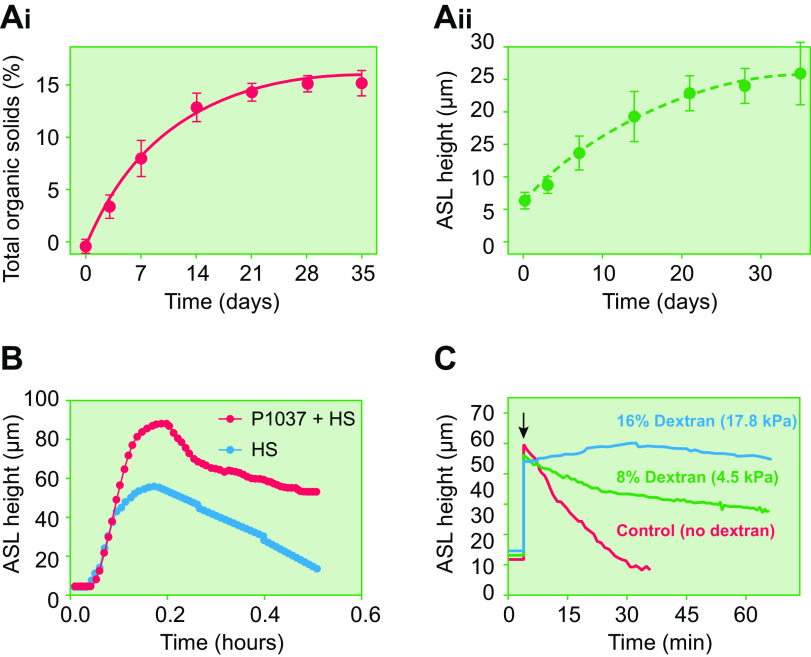
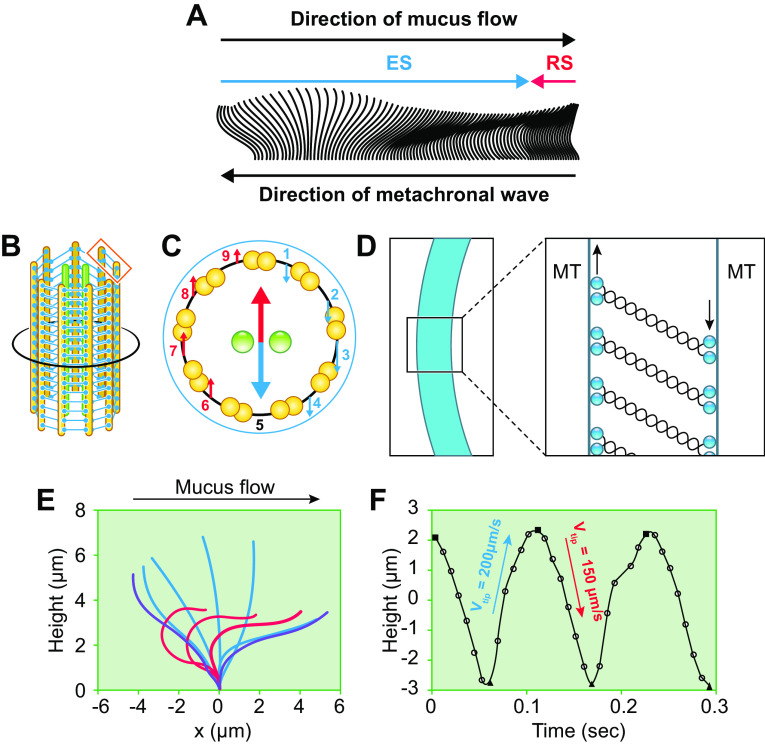
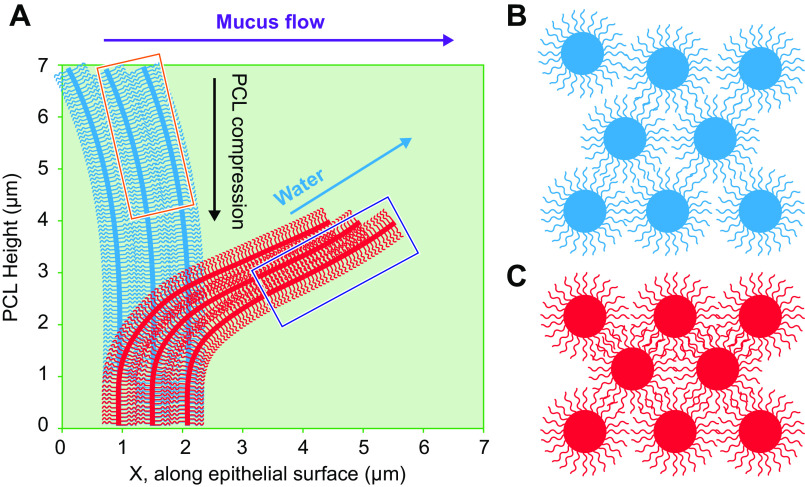
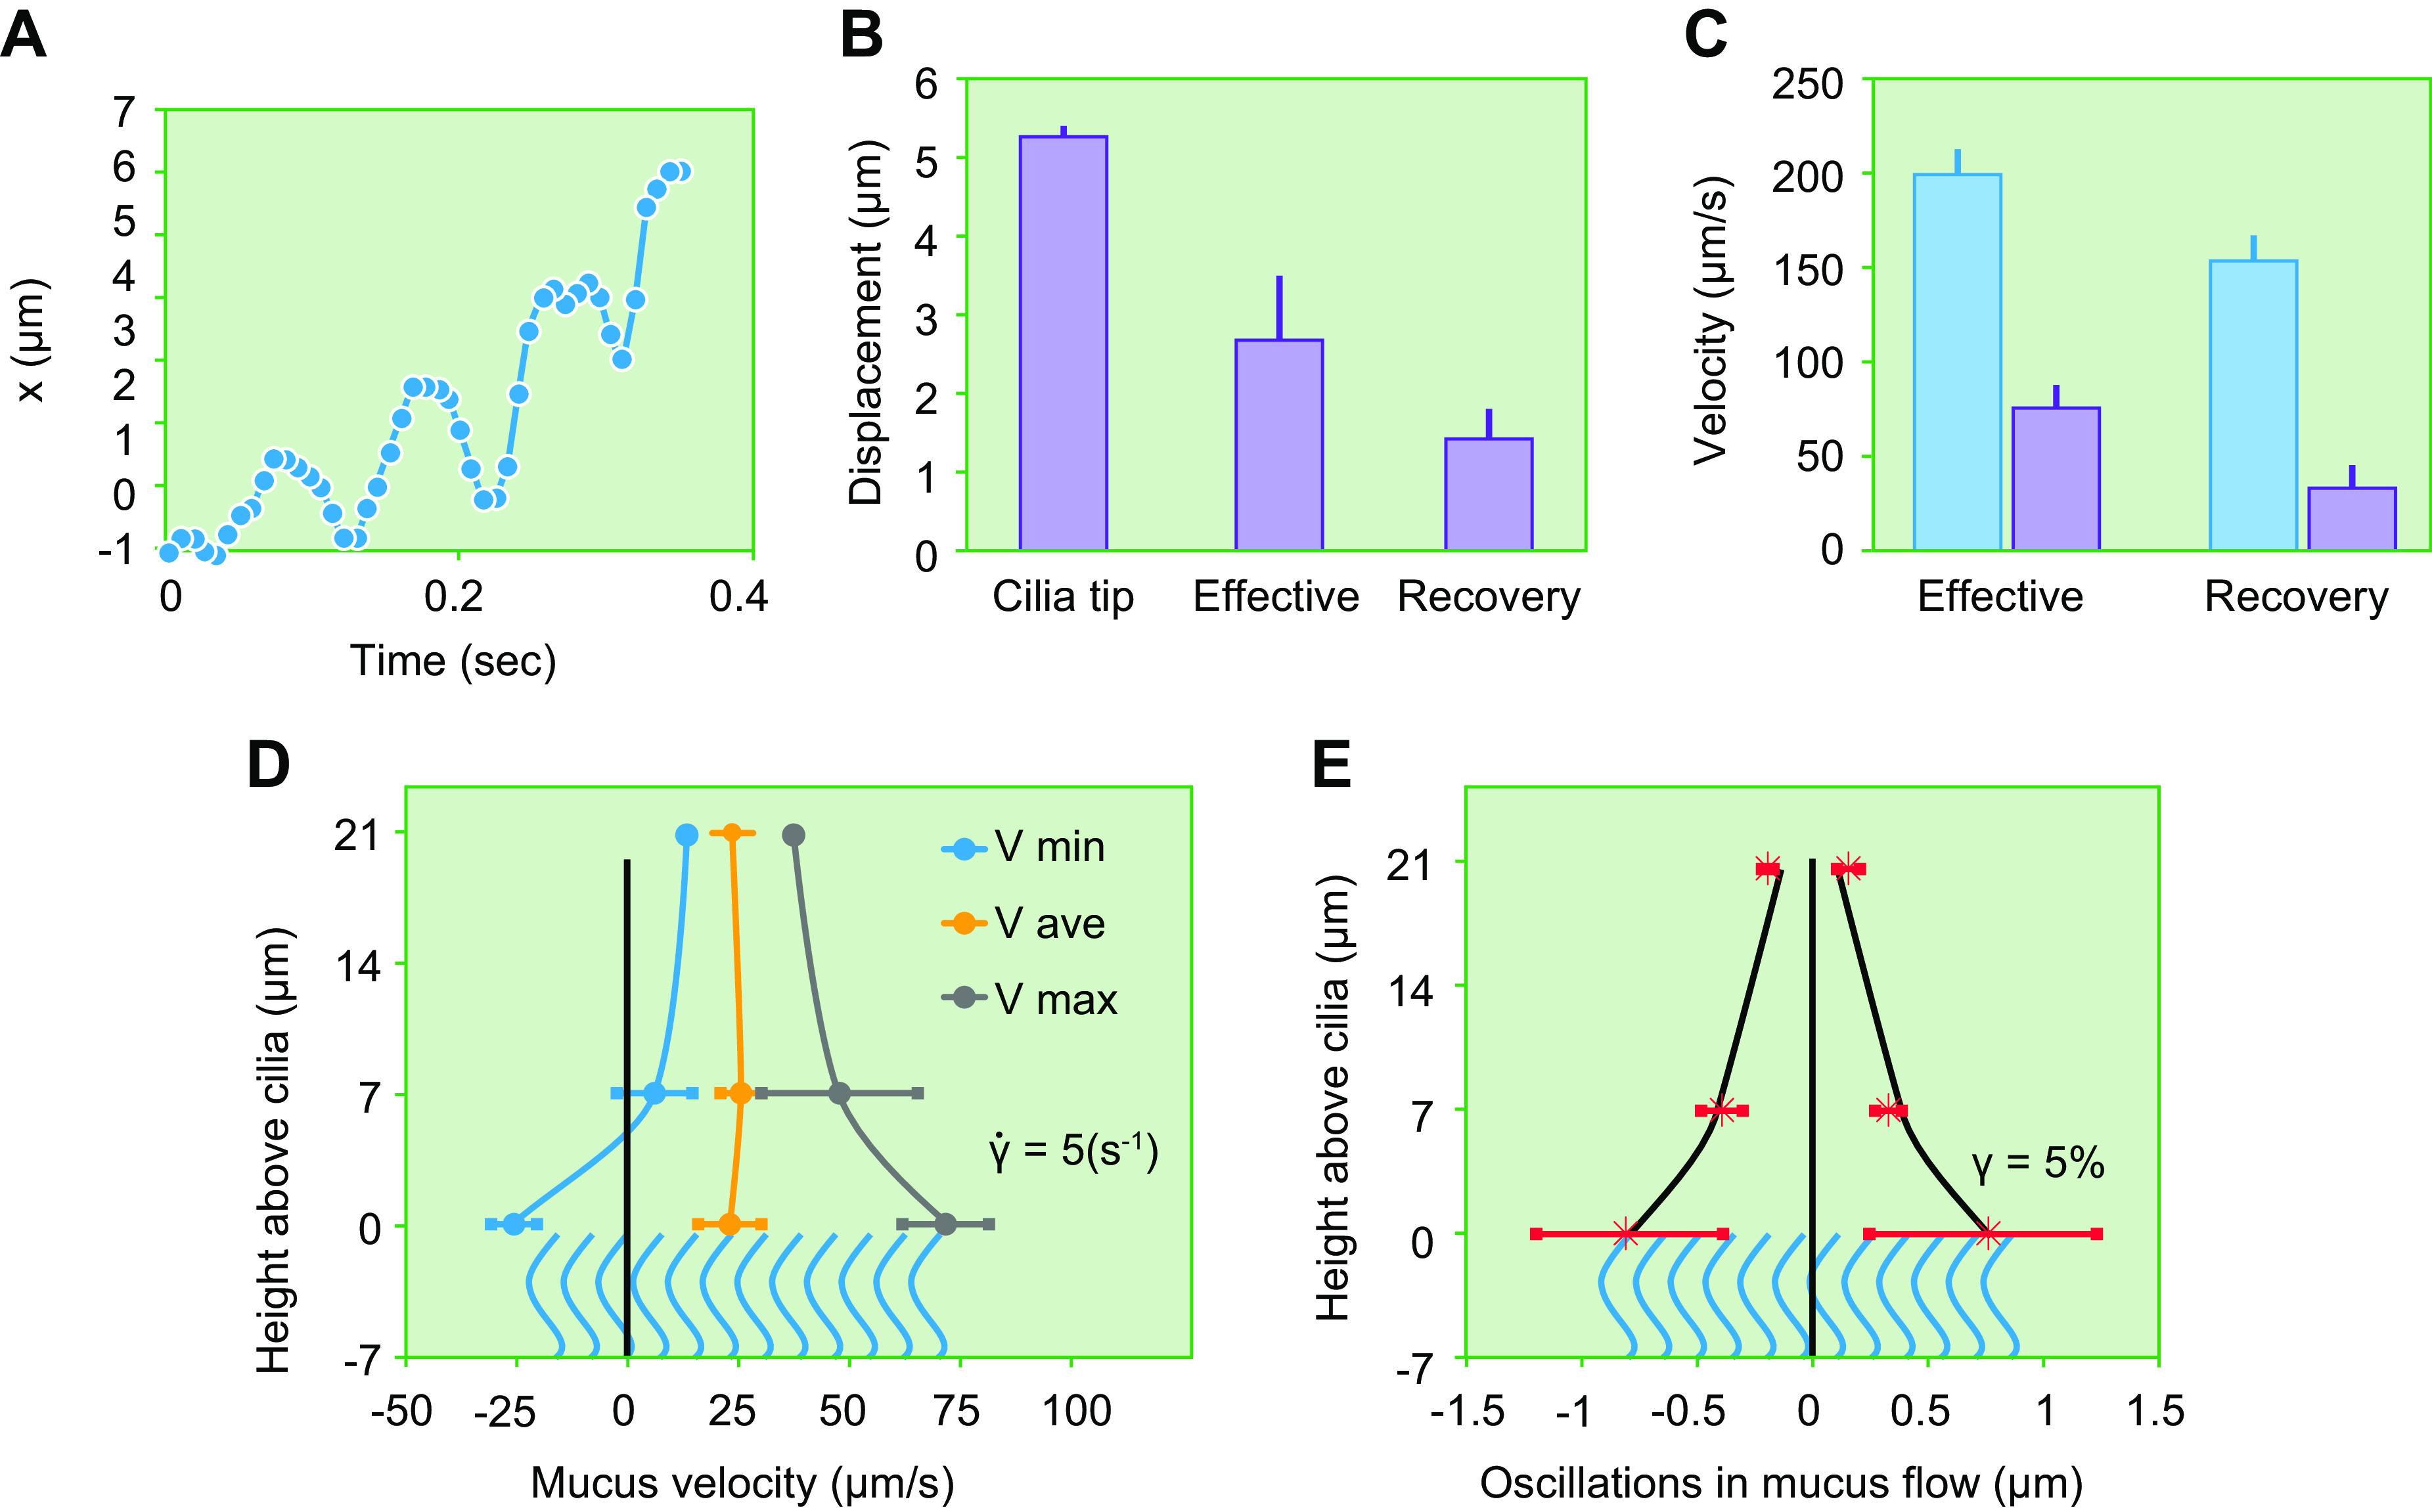
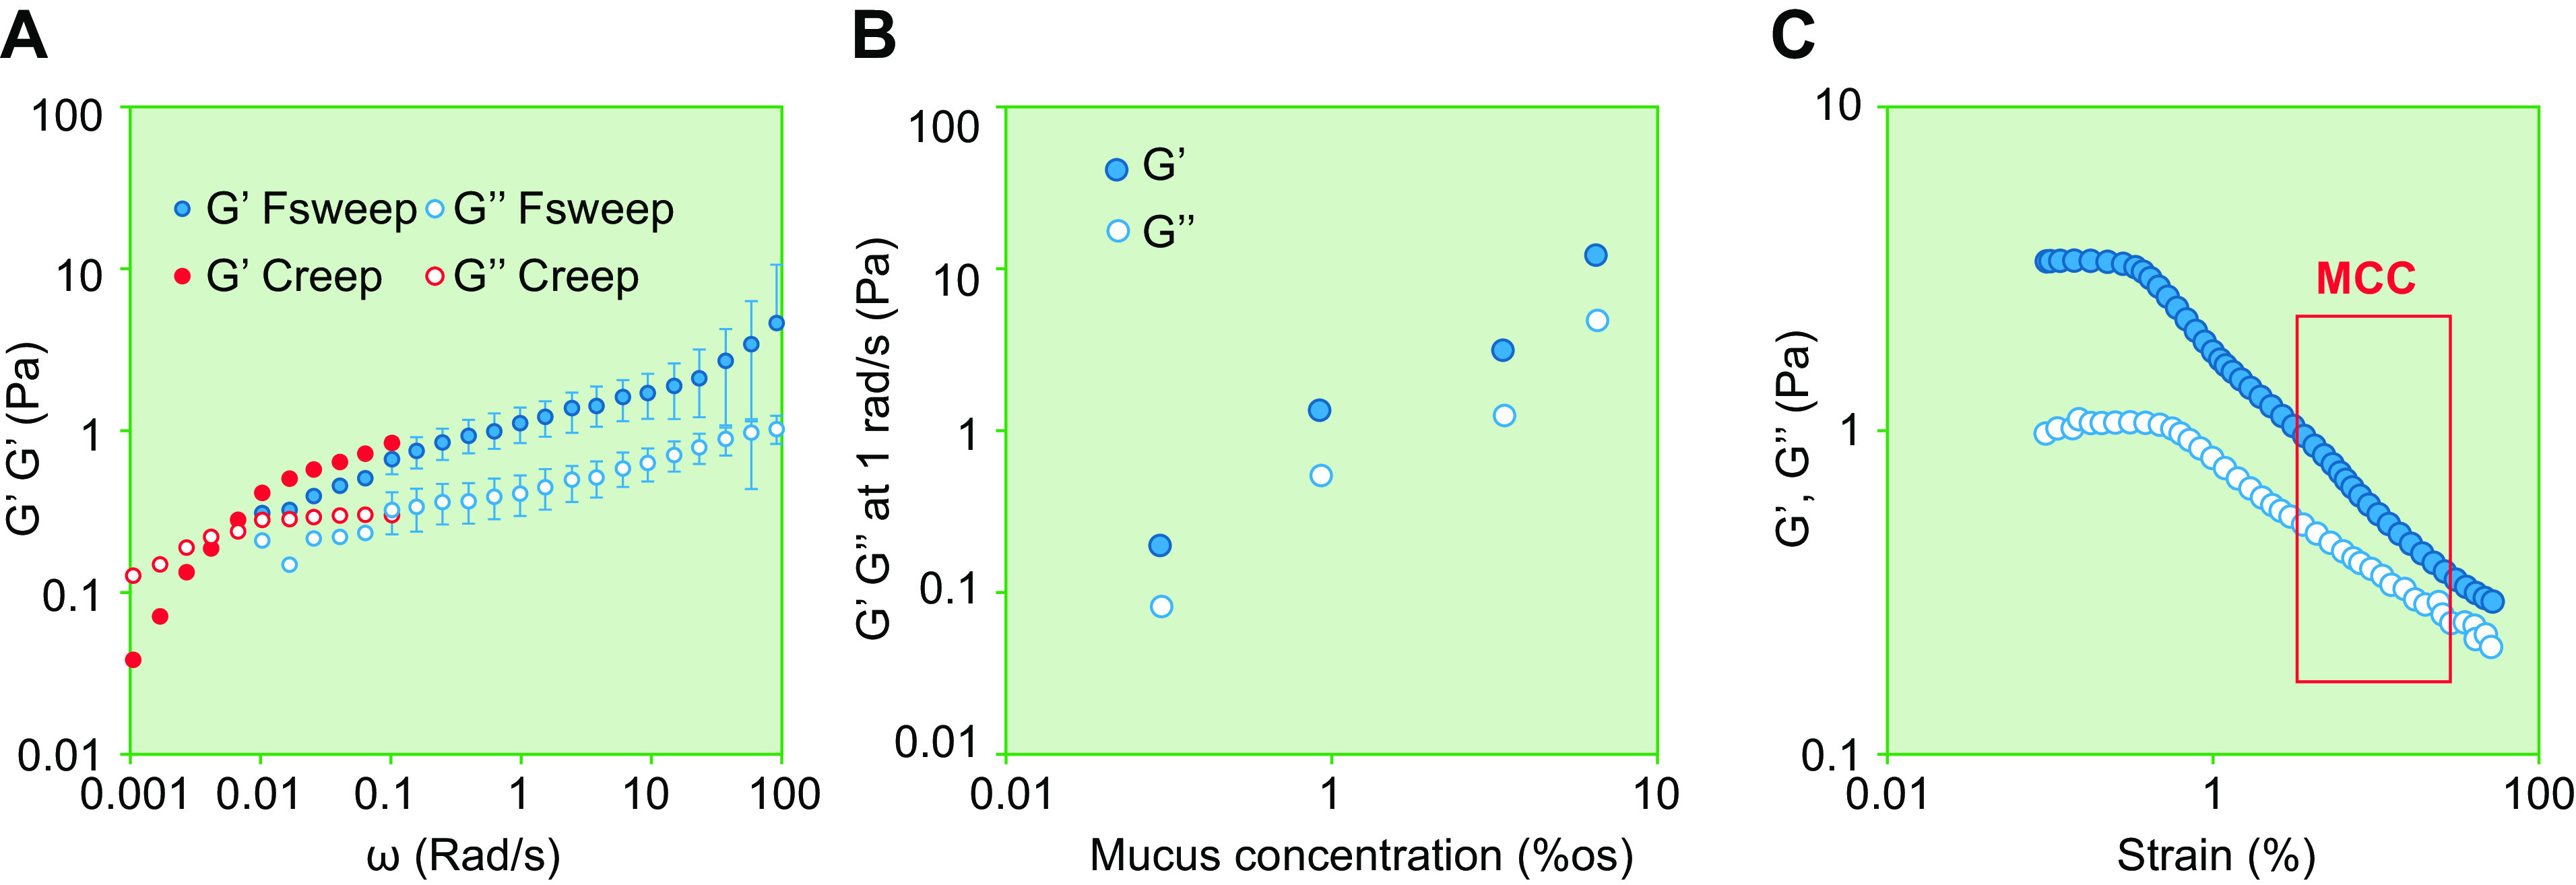
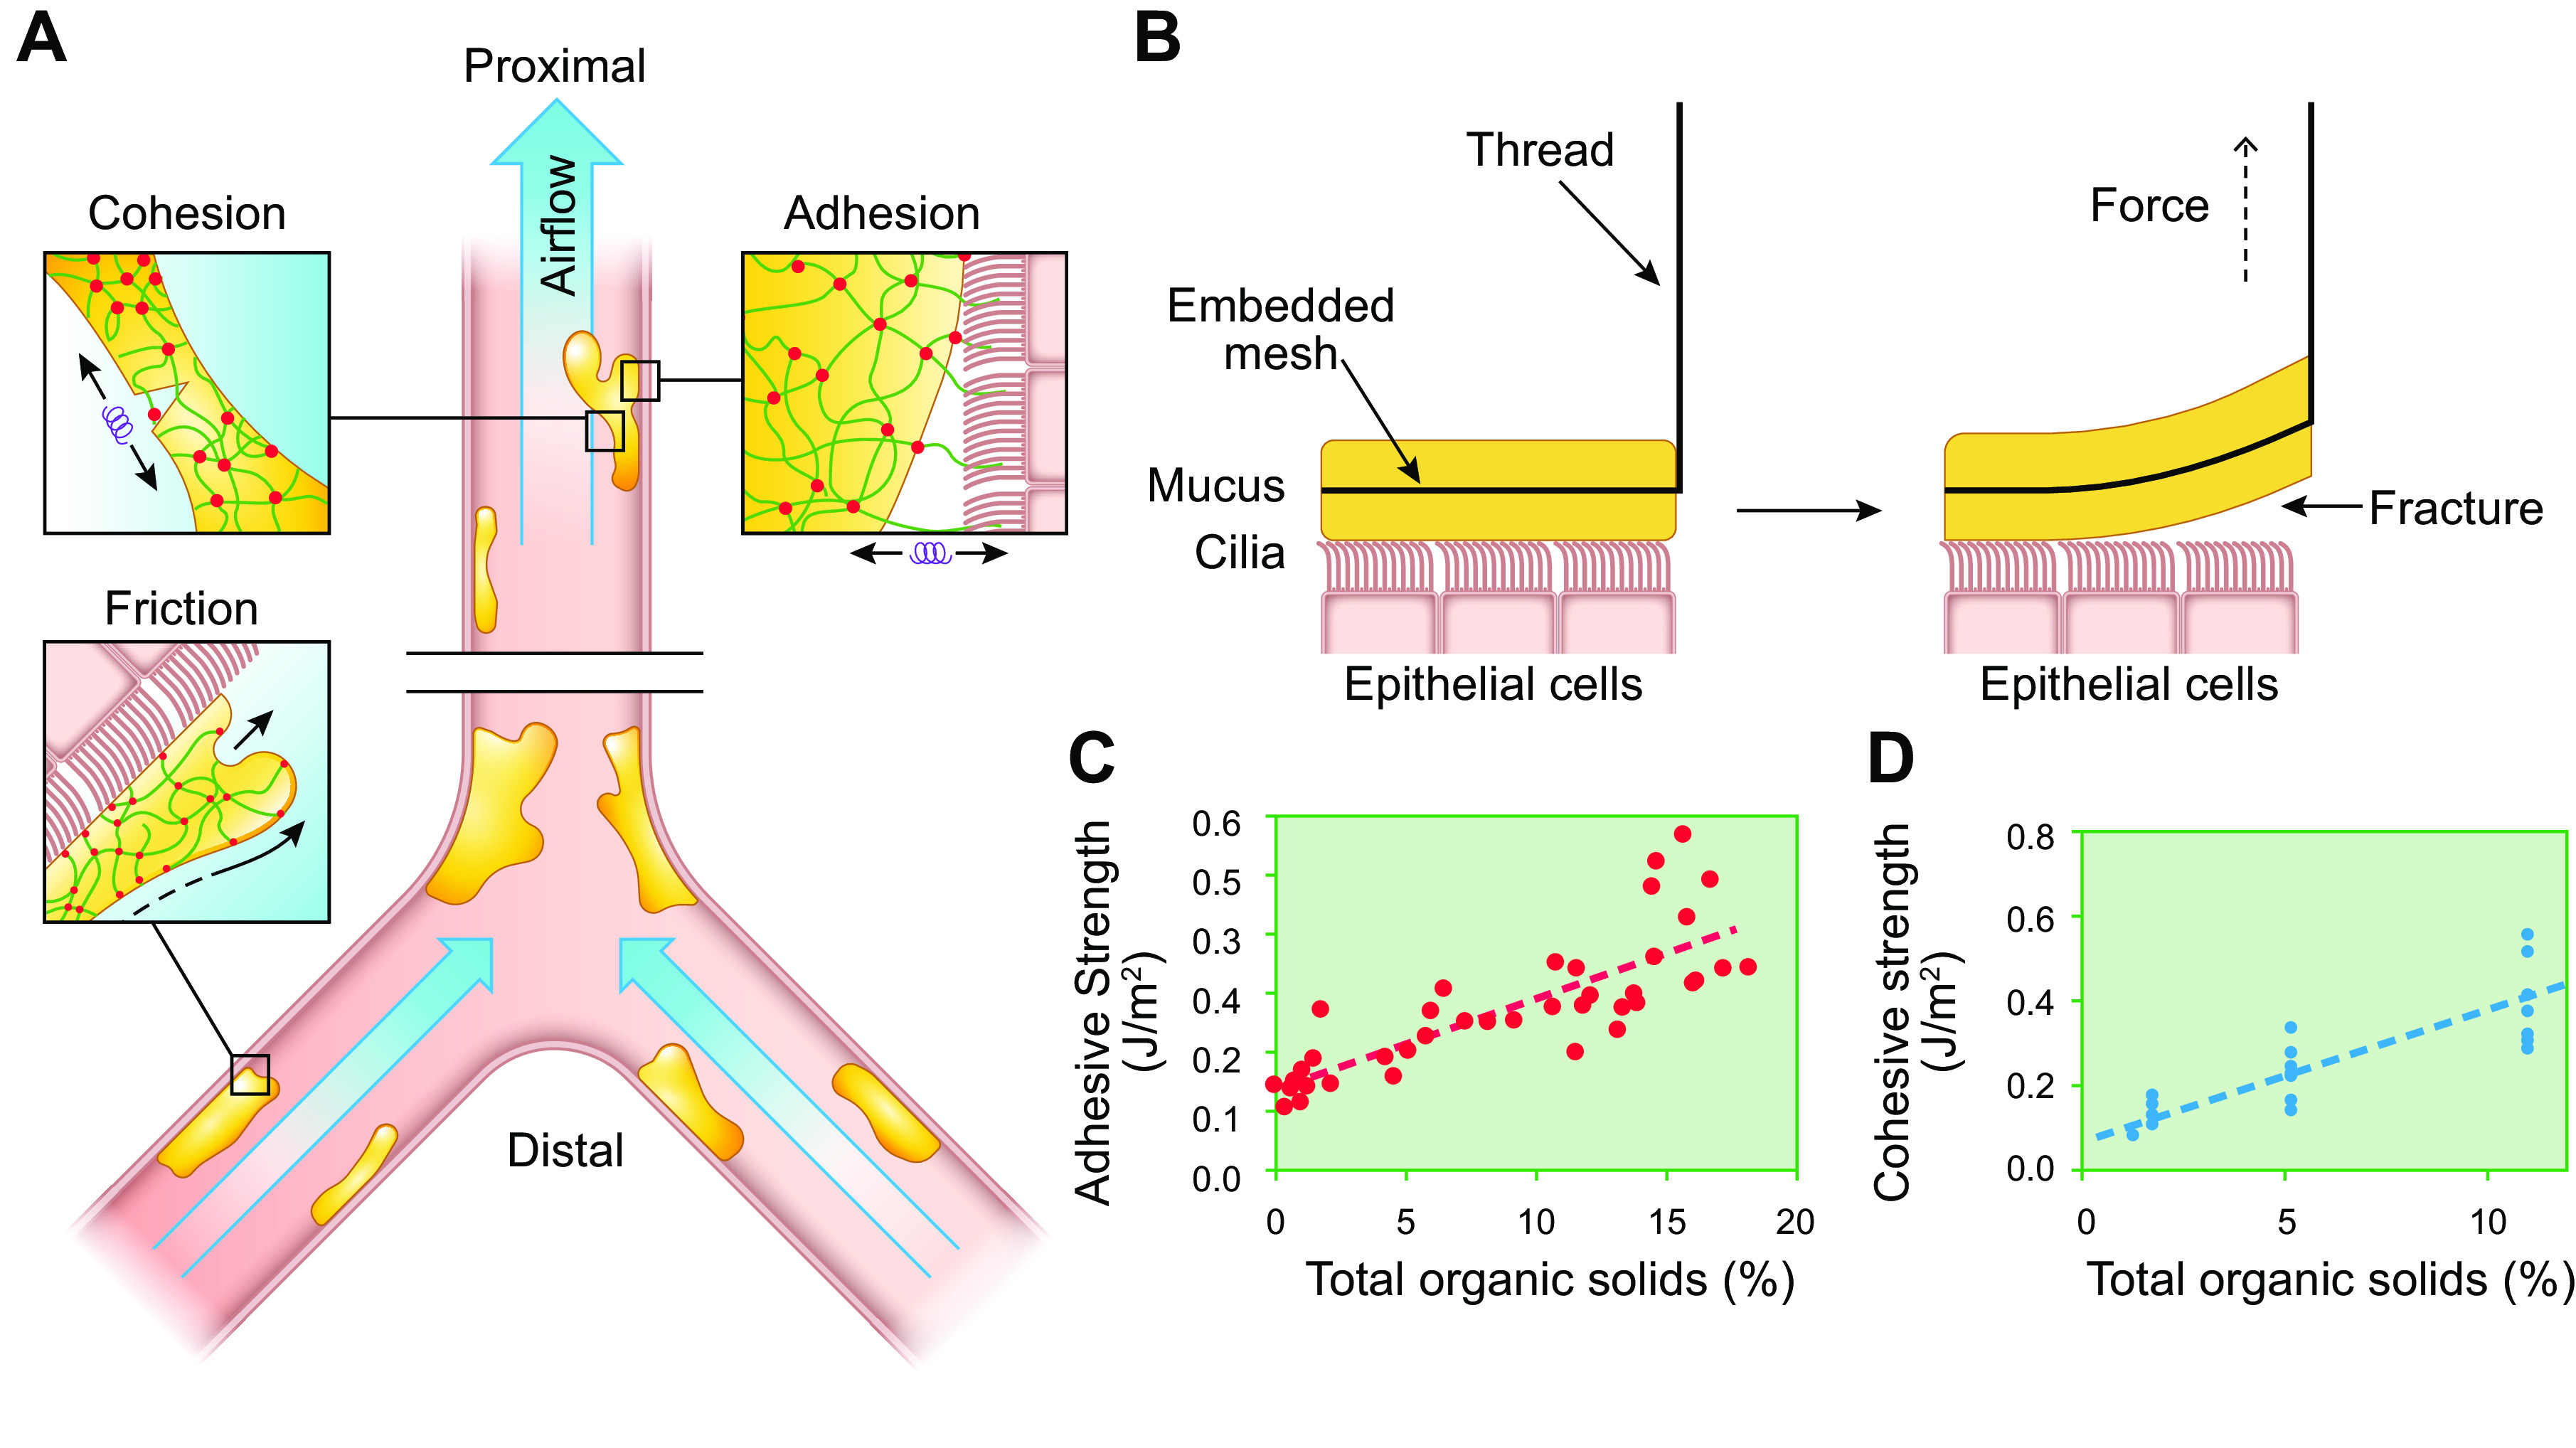
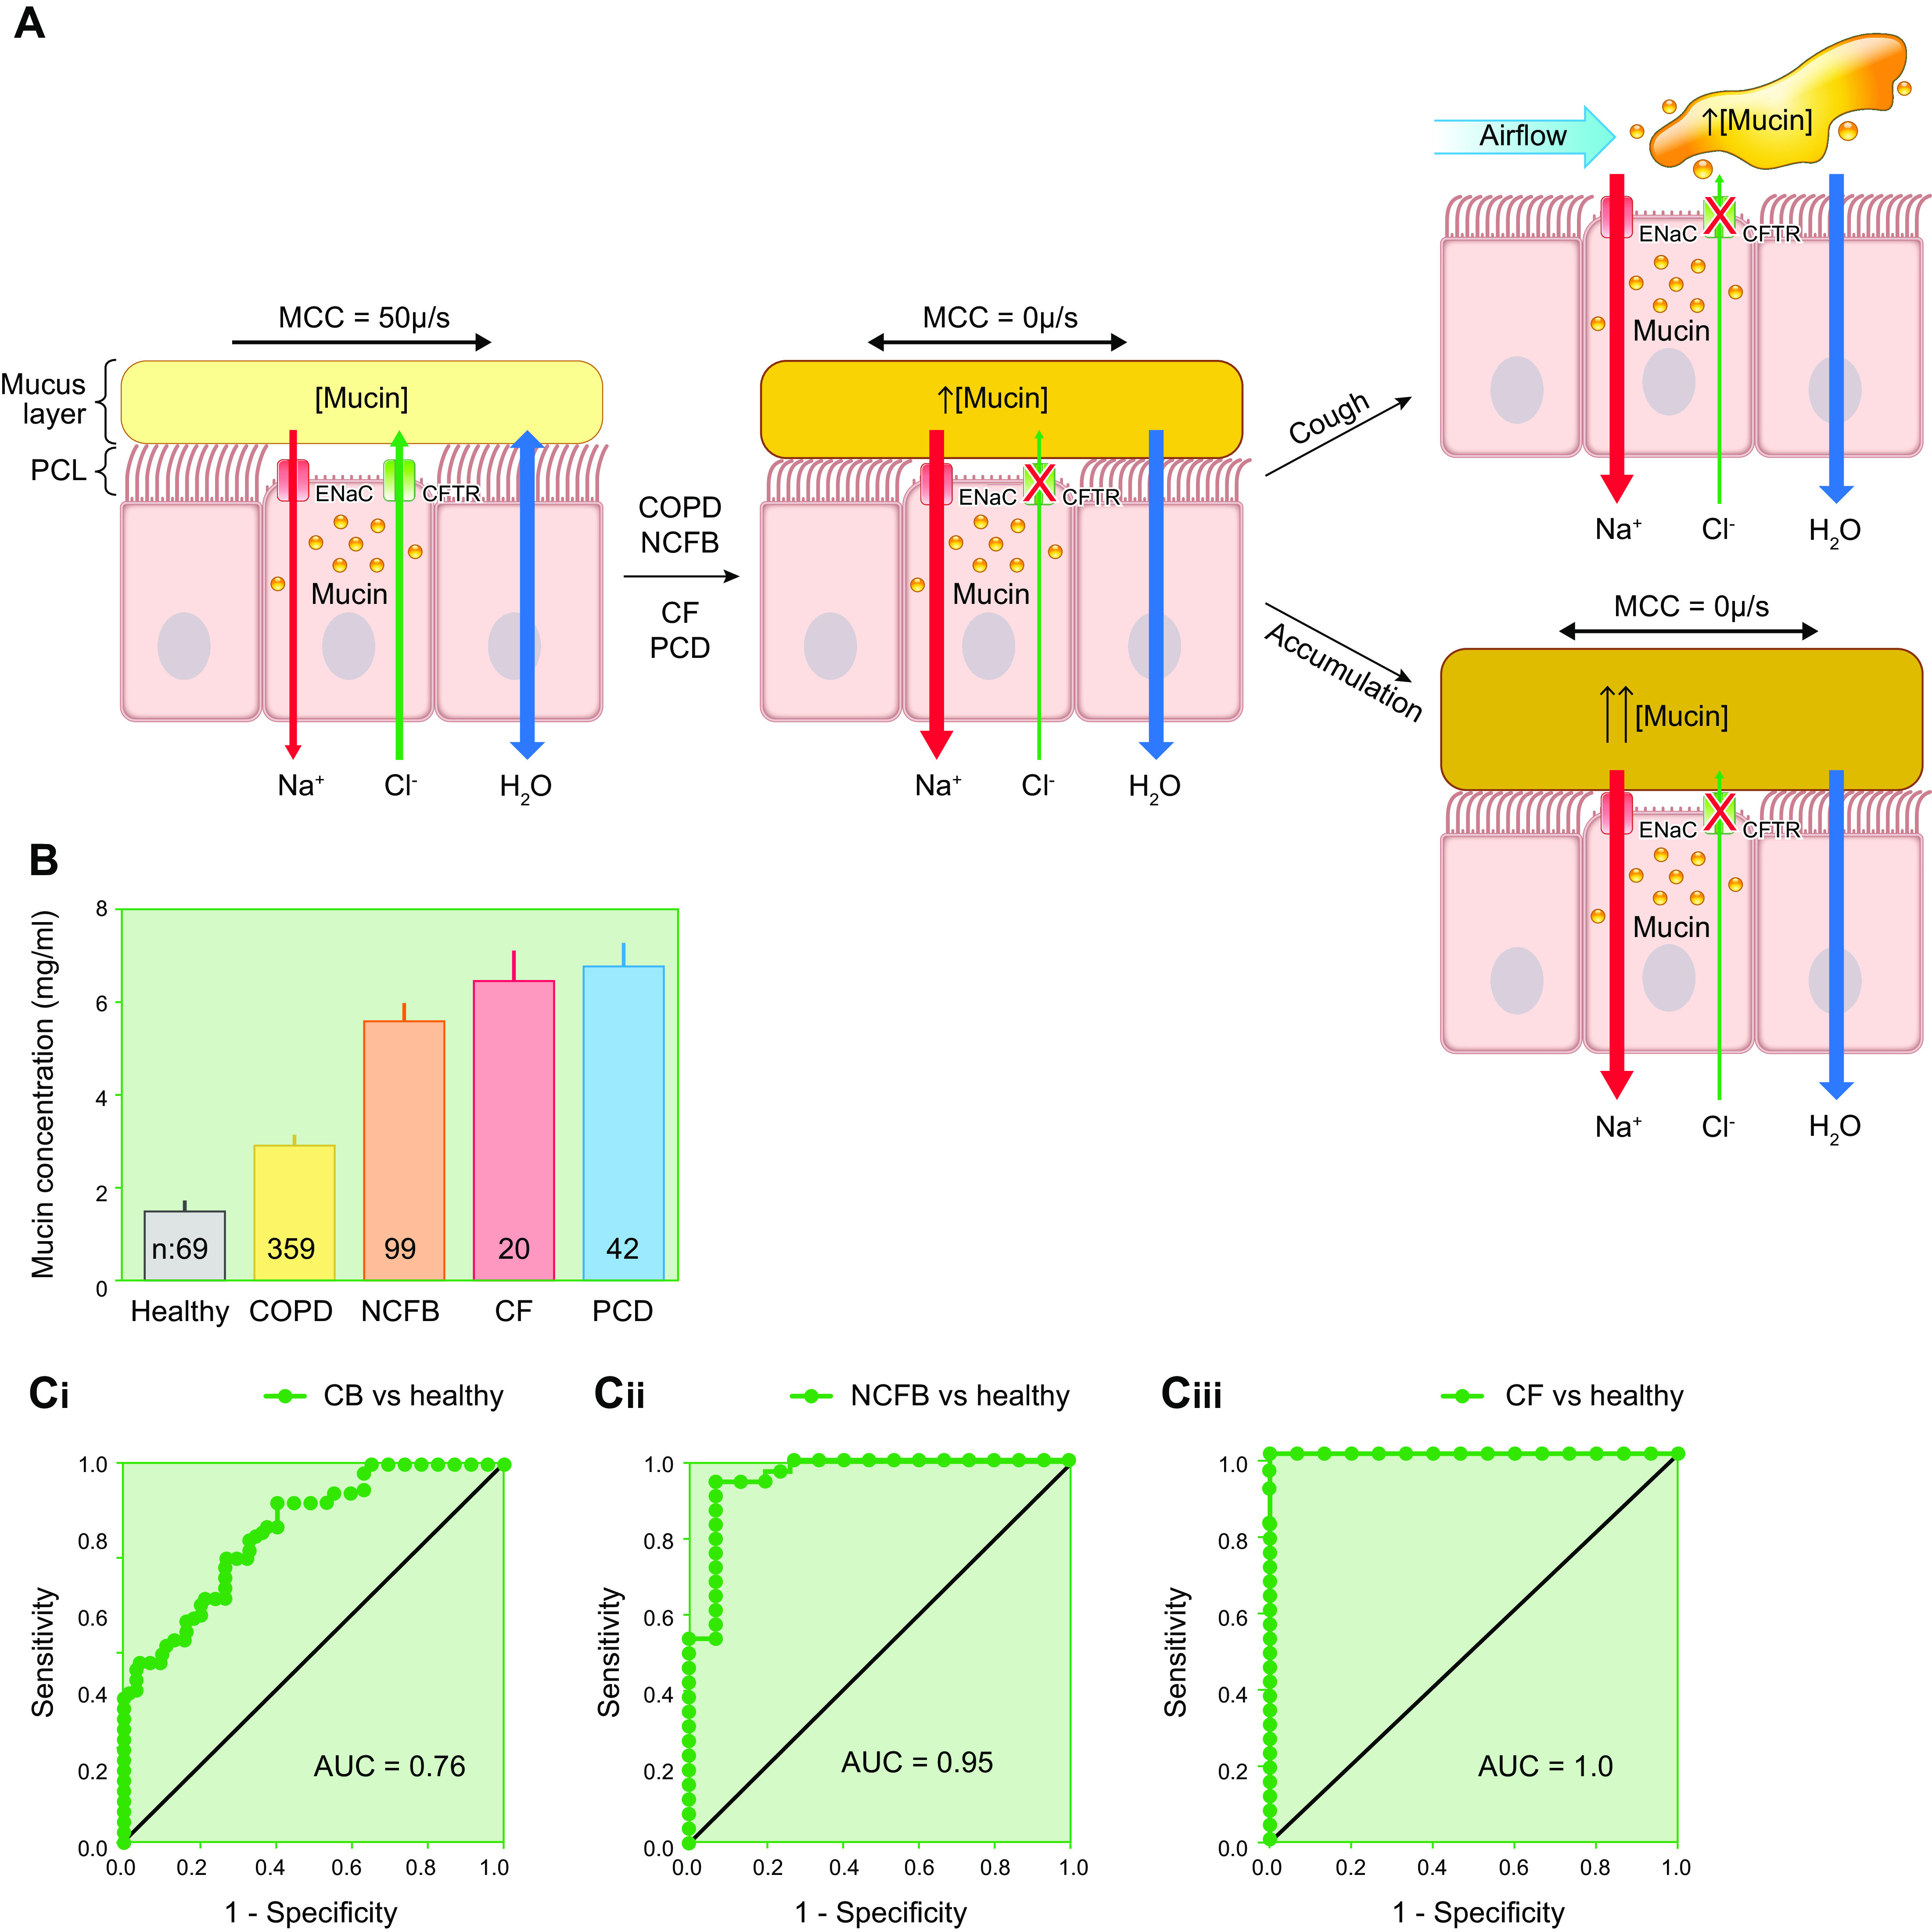
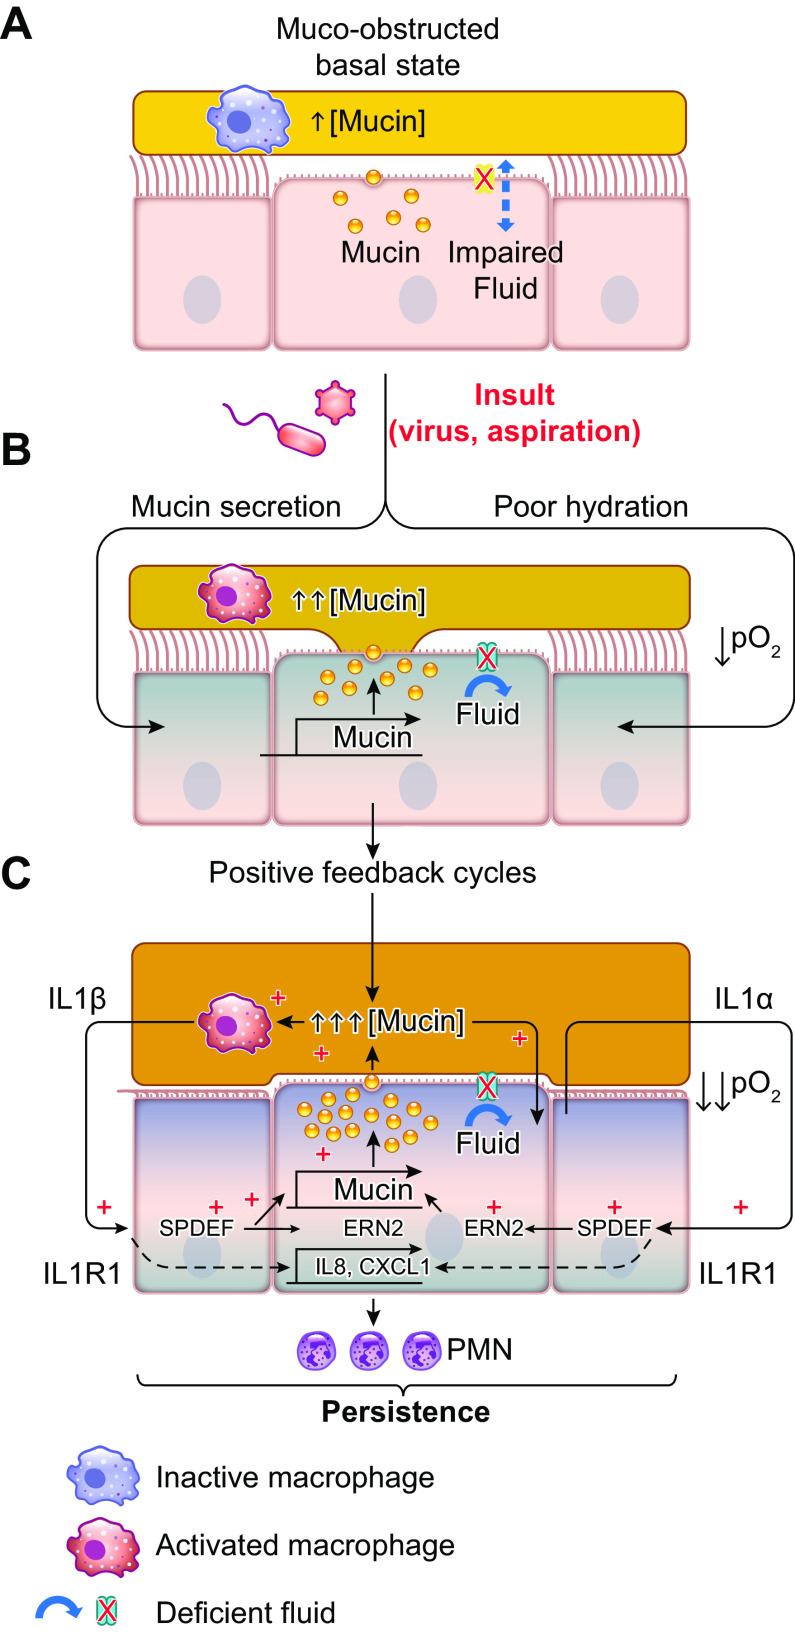
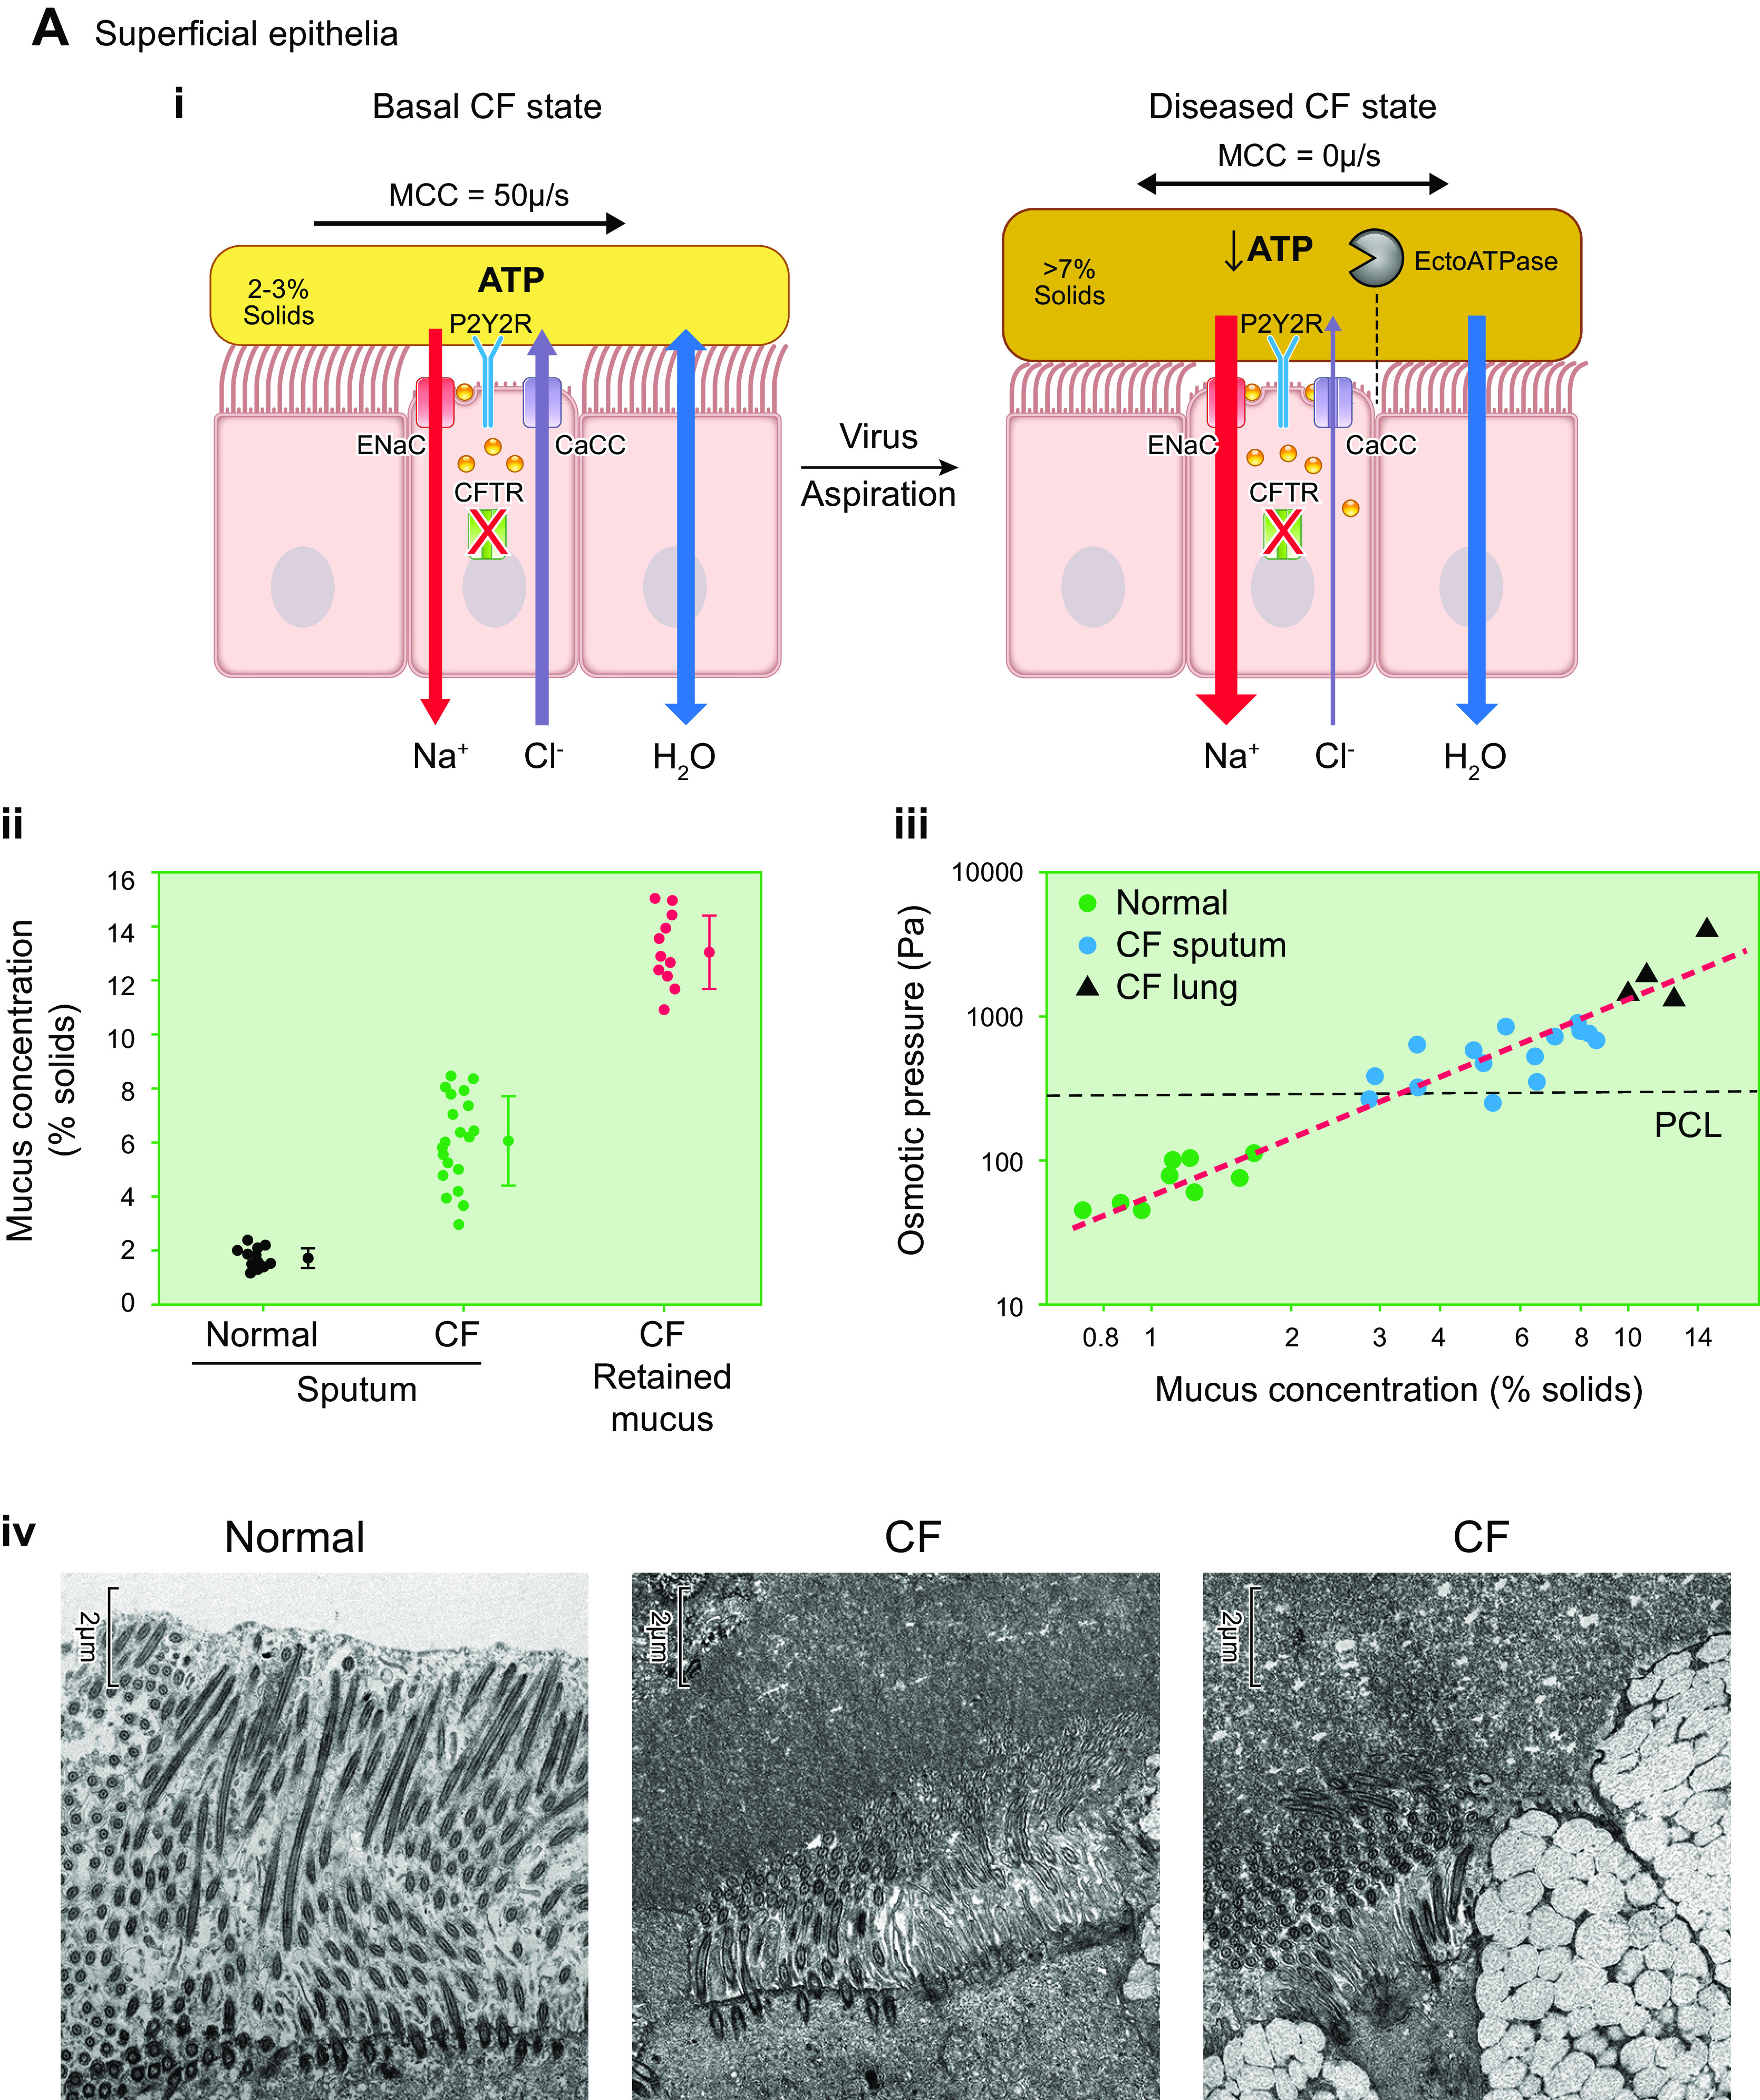
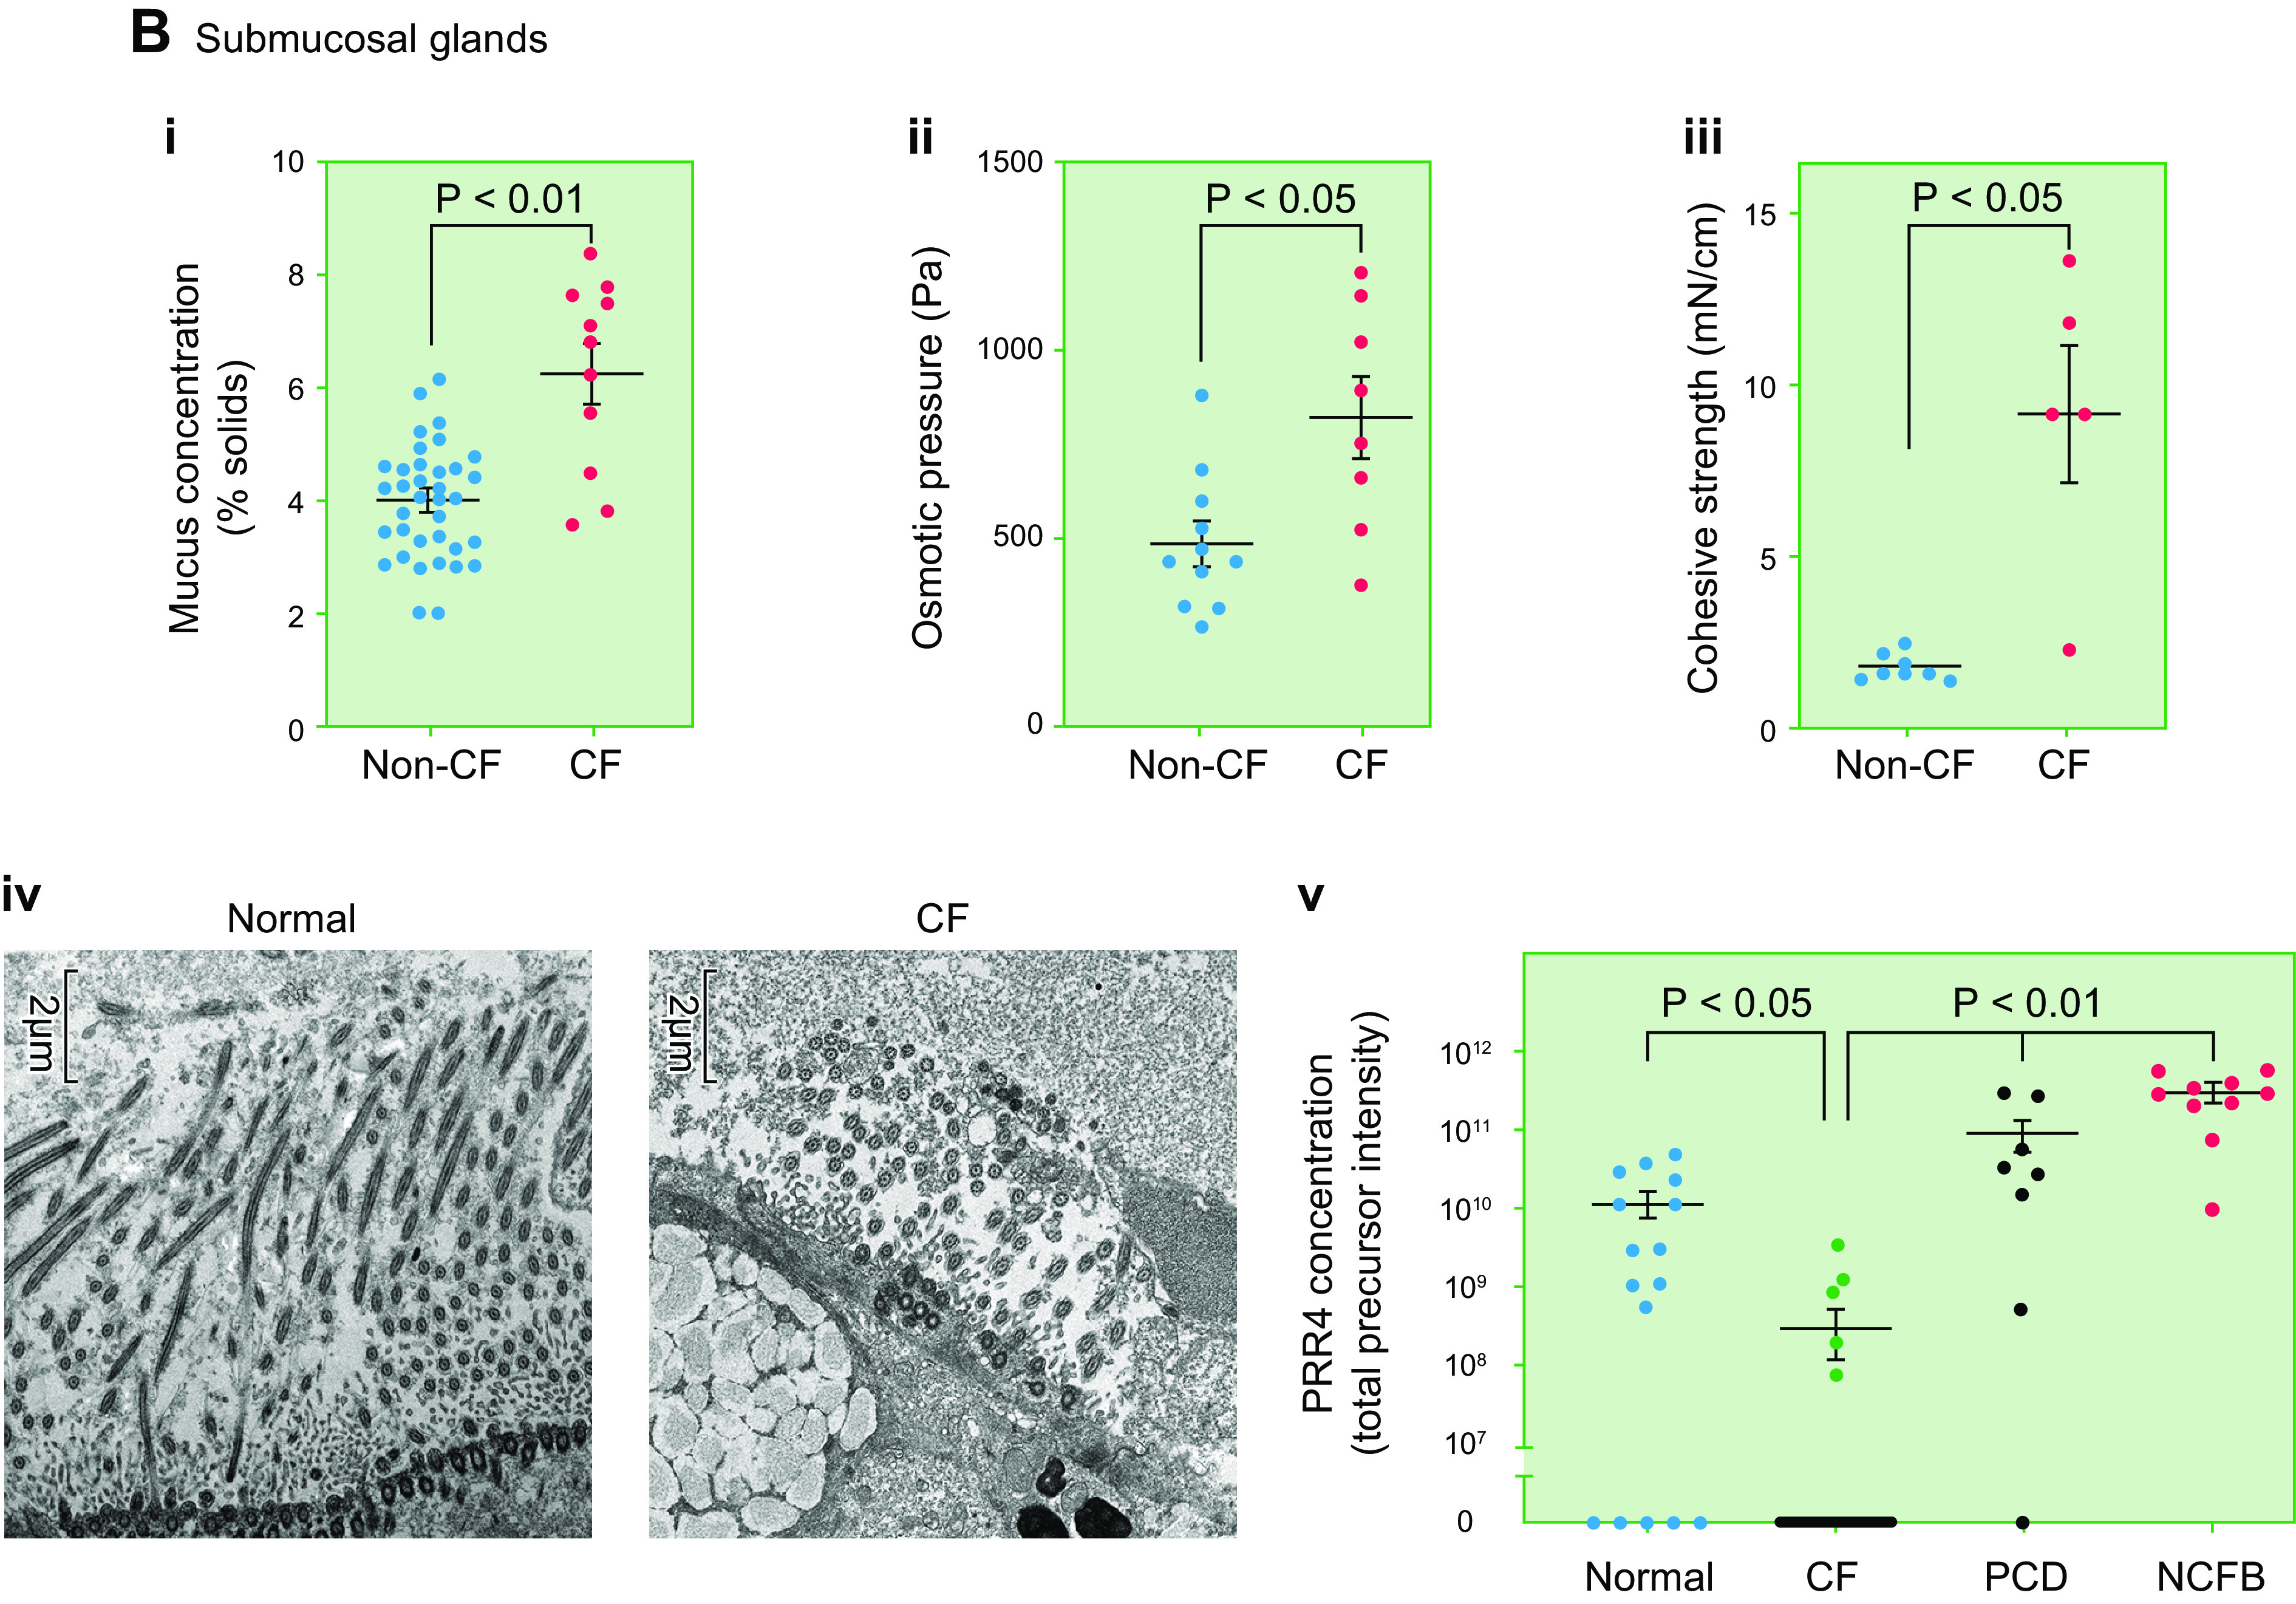
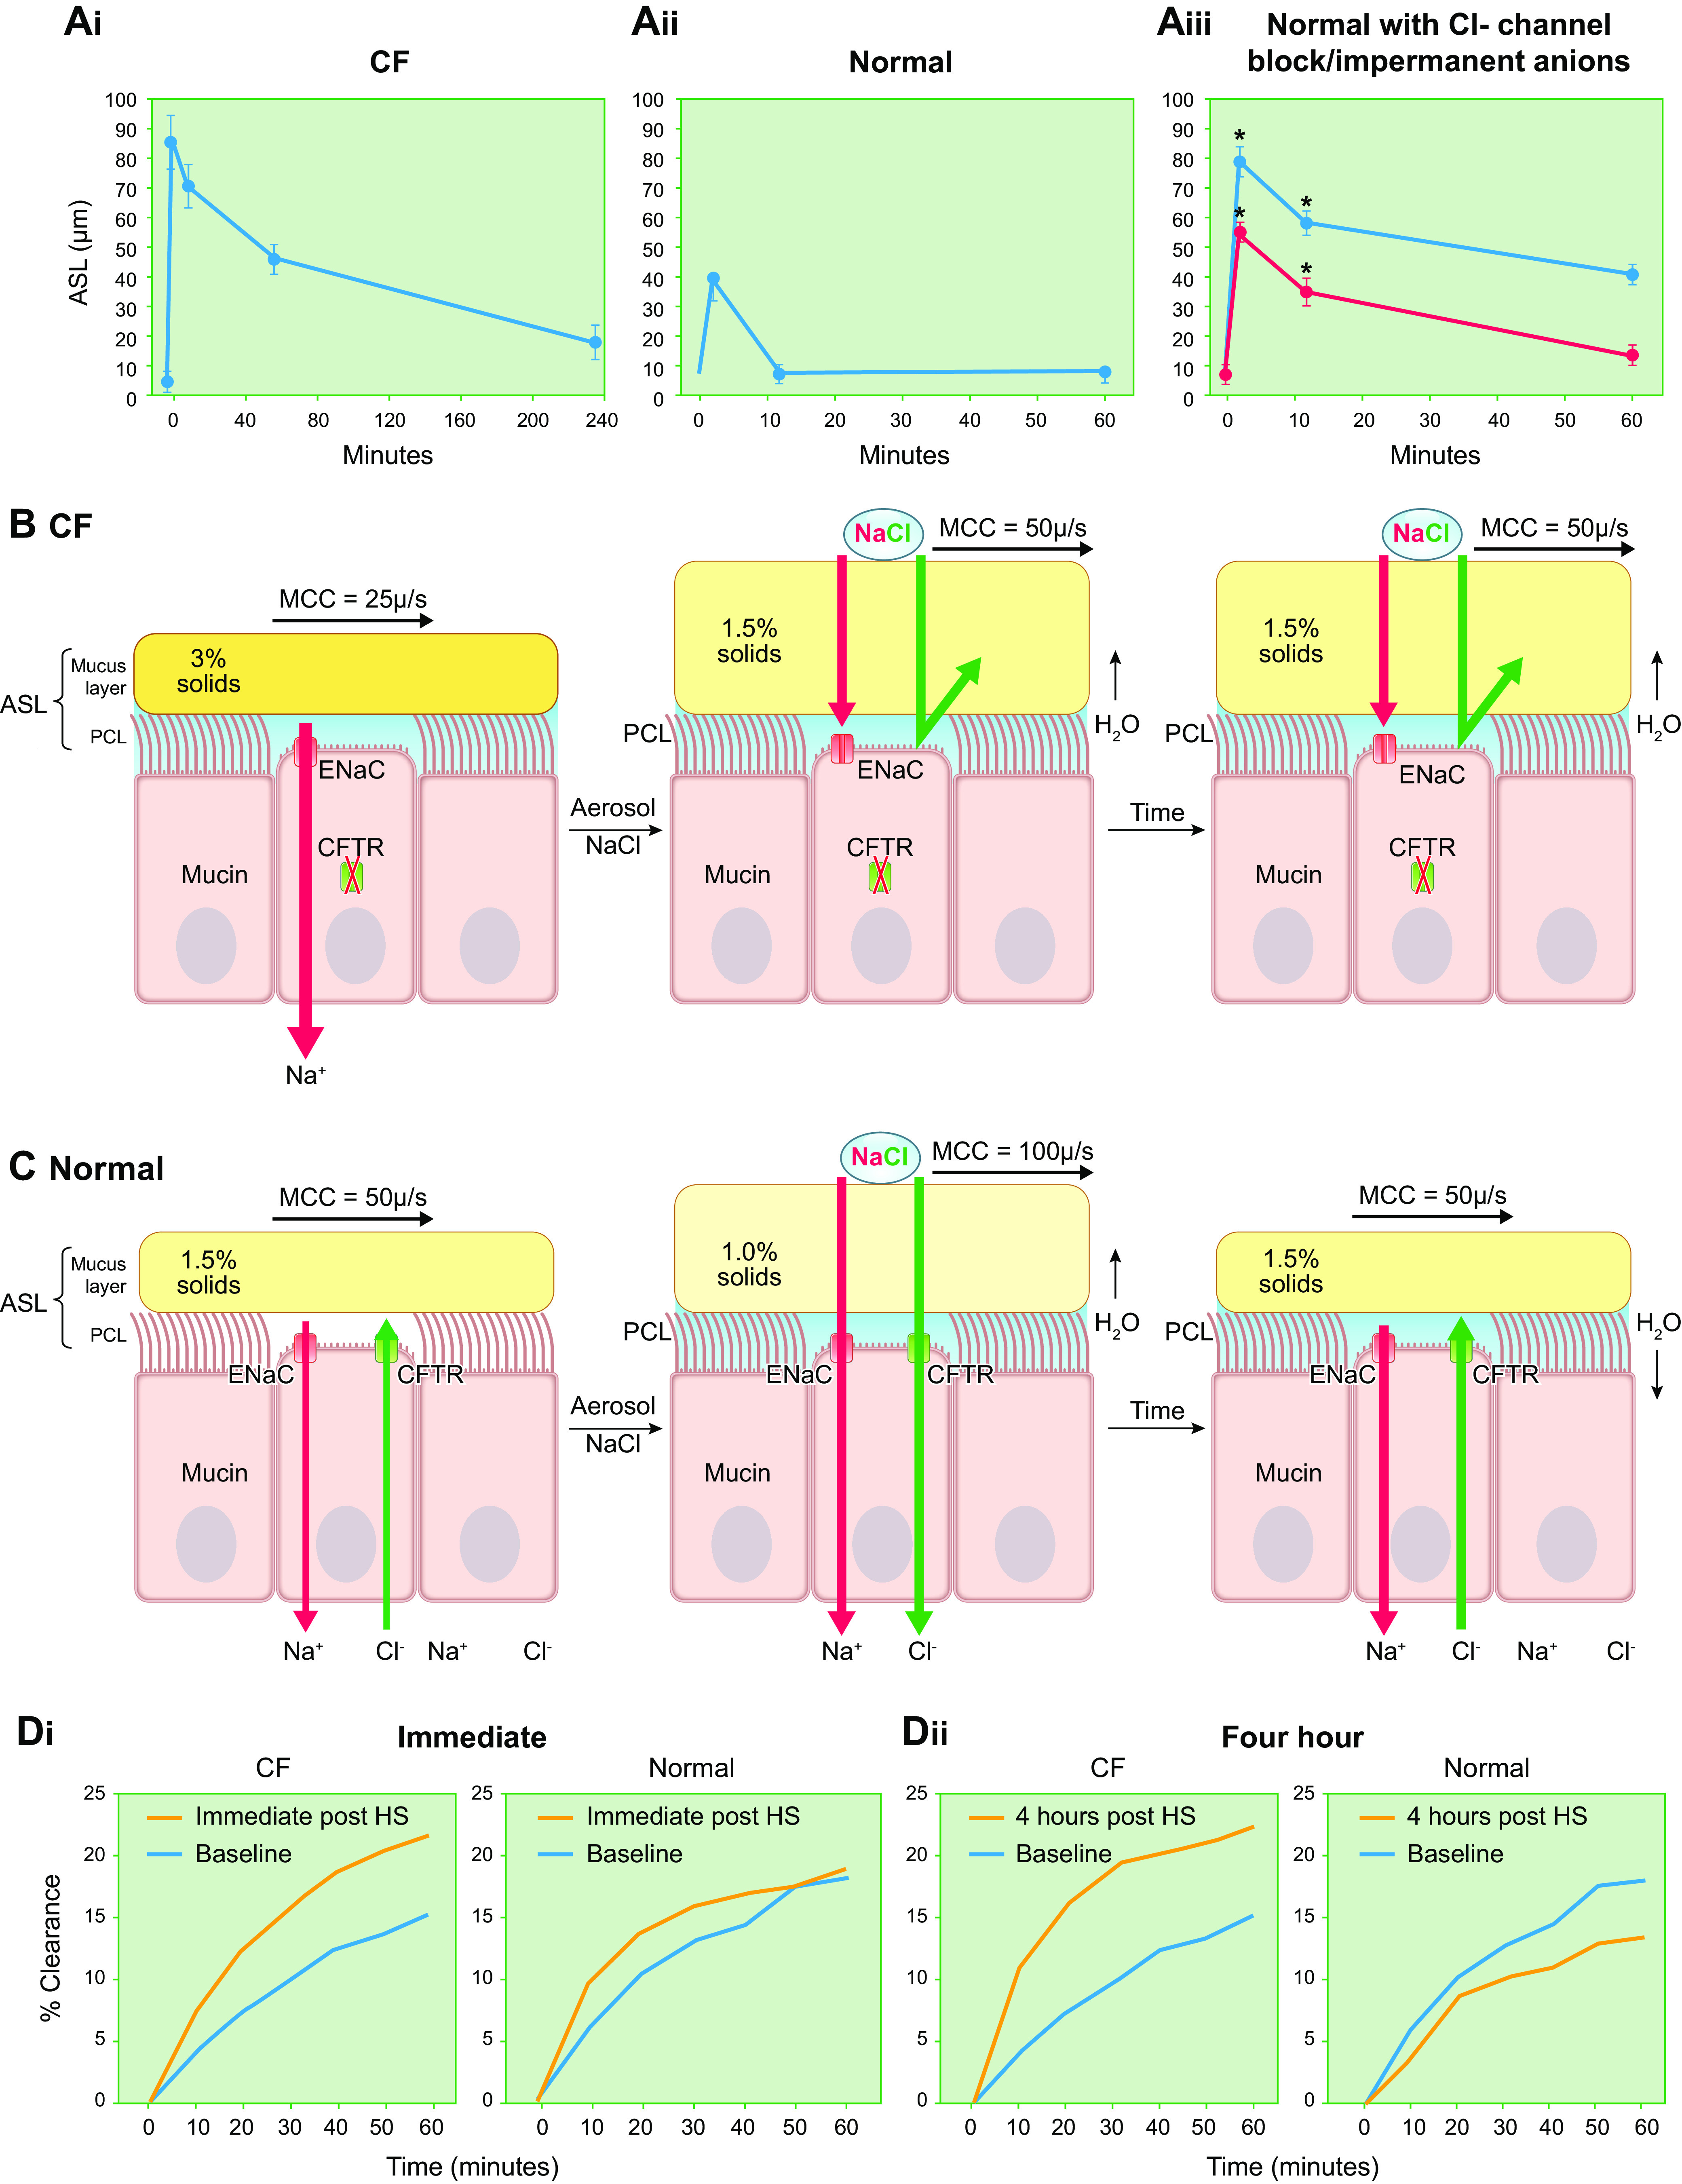
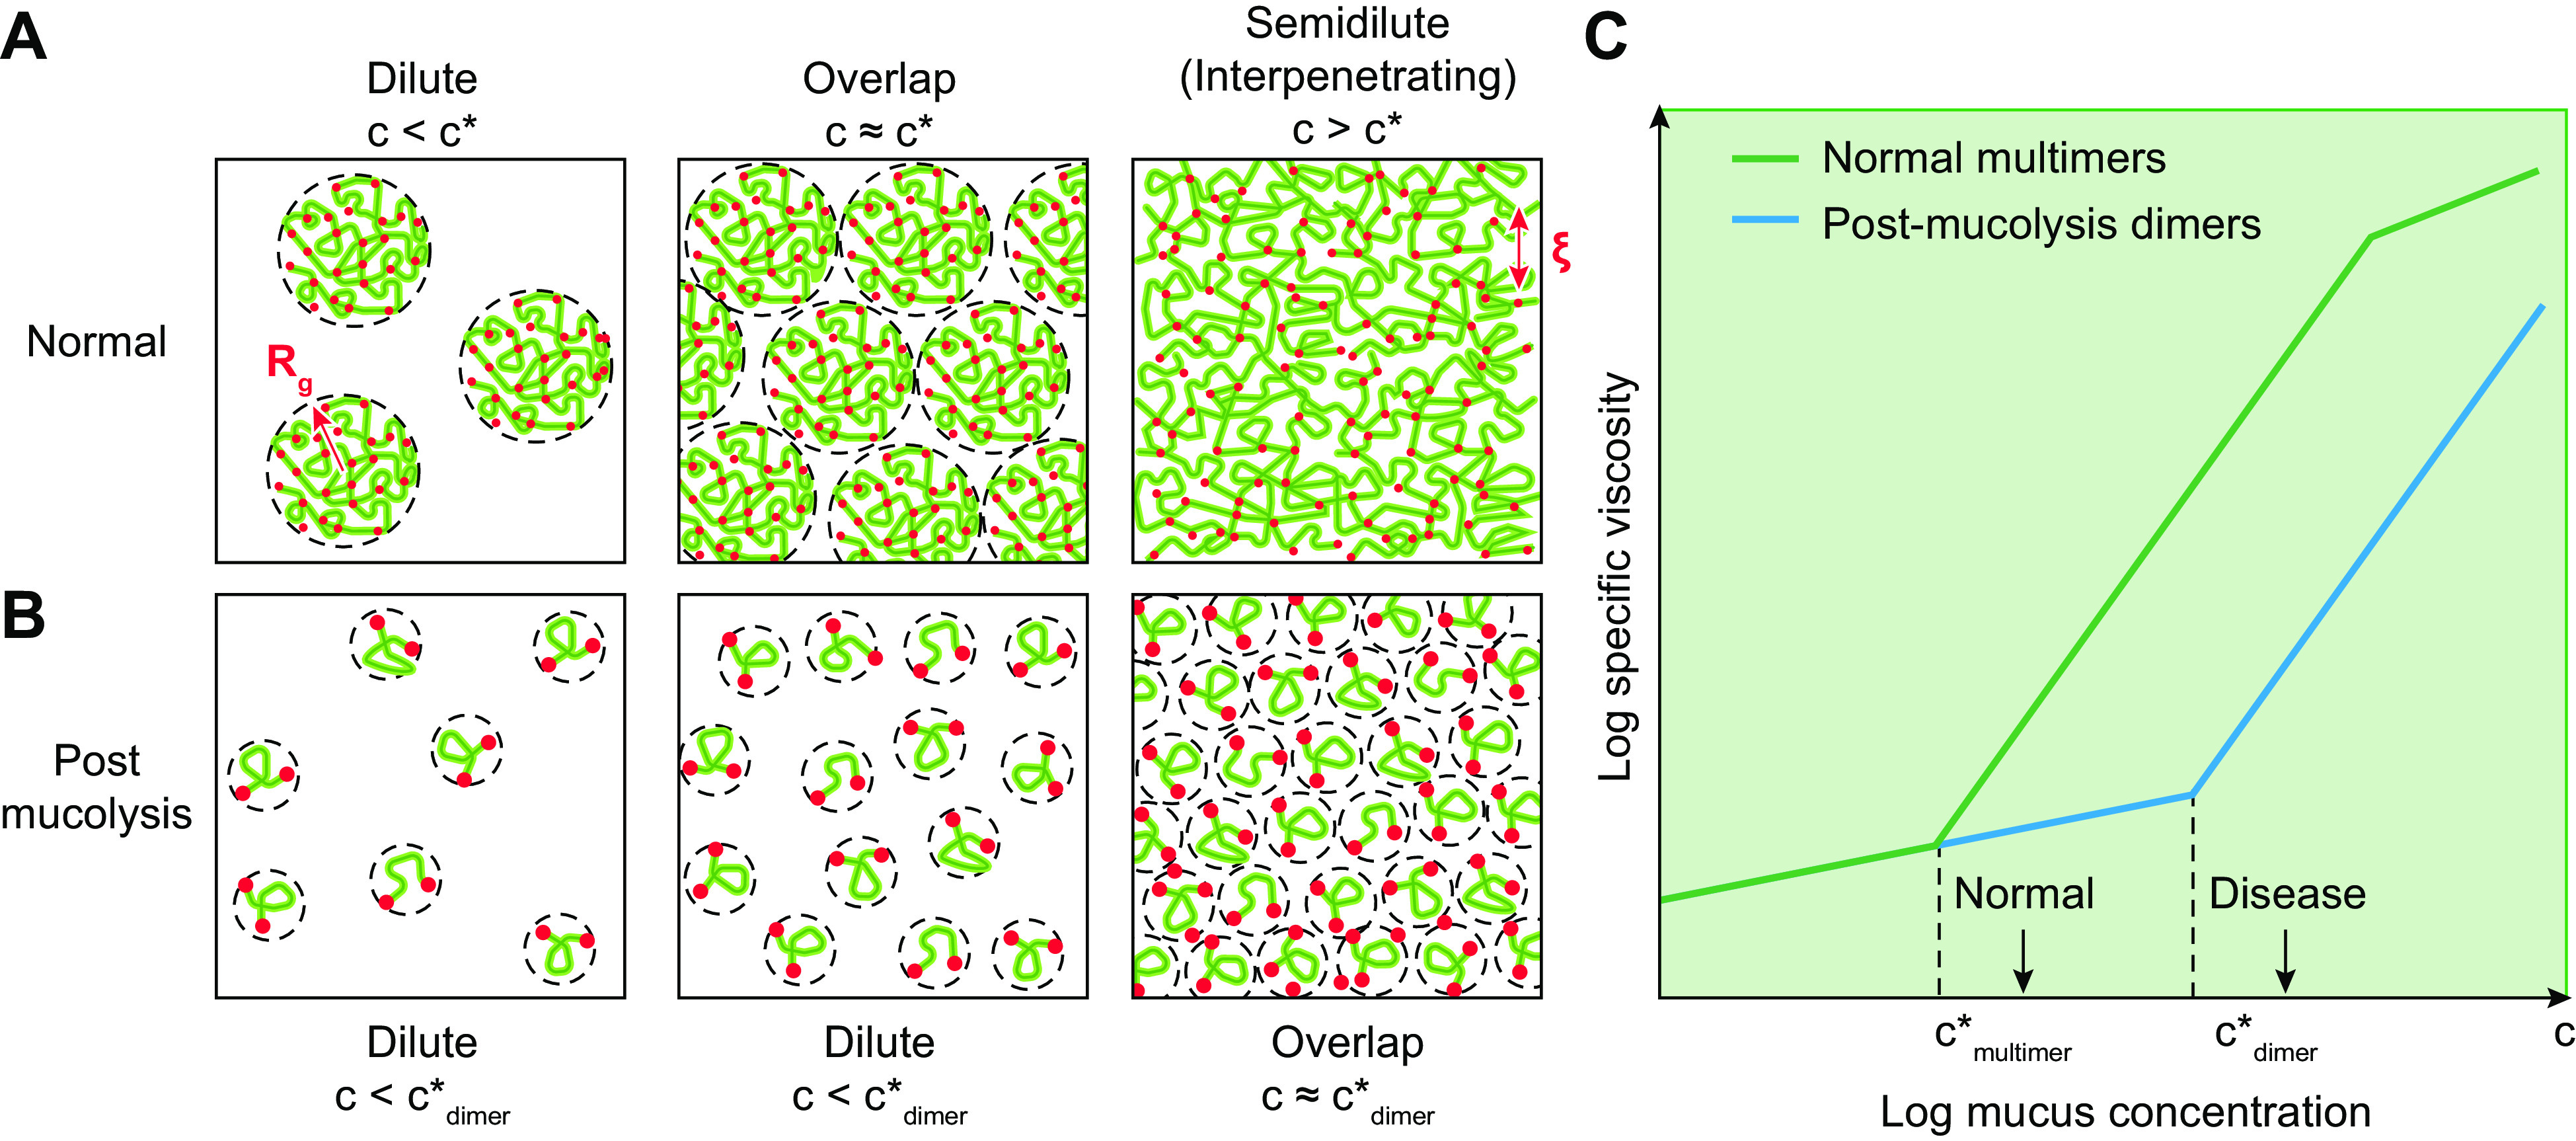
The mucus clearance system is the dominant mechanical host defense system of the human lung. Mucus is cleared from the lung by cilia and airflow, including both two-phase gas-liquid pumping and cough-dependent mechanisms, and mucus transport rates are heavily dependent on mucus concentration. Importantly, mucus transport rates are accurately predicted by the gel-on-brush model of the mucociliary apparatus from the relative osmotic moduli of the mucus and periciliary-glycocalyceal (PCL-G) layers. The fluid available to hydrate mucus is generated by transepithelial fluid transport. Feedback interactions between mucus concentrations and cilia beating, via purinergic signaling, coordinate Na+ absorptive vs Cl- secretory rates to maintain mucus hydration in health. In disease, mucus becomes hyperconcentrated (dehydrated). Multiple mechanisms derange the ion transport pathways that normally hydrate mucus in muco-obstructive lung diseases, e.g., cystic fibrosis (CF), chronic obstructive pulmonary disease (COPD), non-CF bronchiectasis (NCFB), and primary ciliary dyskinesia (PCD). A key step in muco-obstructive disease pathogenesis is the osmotic compression of the mucus layer onto the airway surface with the formation of adherent mucus plaques and plugs, particularly in distal airways. Mucus plaques create locally hypoxic conditions and produce airflow obstruction, inflammation, infection, and, ultimately, airway wall damage. Therapies to clear adherent mucus with hydrating and mucolytic agents are rational, and strategies to develop these agents are reviewed.

Keywords: airway ion transport; gel-on-brush model; mucins; muco-obstructive diseases; mucus.


Conflict of interest statement

R. C. Boucher is Chairman of the Board of Parion Sciences; is on the Scientific Advisory Board, Enterprise Therapeutics; is on the Scientific Advisory Board, Concentrix Pharma; and consults for Novartis. None of the other authors has any conflicts of interest, financial or otherwise, to disclose.

Figures

None
Graphical abstract
FIGURE 1.
FIGURE 1.
Mucin organization macroscopically and microscopically in the normal lung. A: regional airway and submucosal gland (SMG) distributions in the lung. Large airways, also defined as bronchial airways, are characterized by airway cartilage and SMGs. Small airways, also defined as bronchioles, typically are <2 mm in diameter and without cartilage and SMGs. B: microscopic organization of the mucociliary apparatus. Bi: schematic representation of the classic gel-on-liquid model showing a mucus layer (comprised of gel-forming mucins MUC5AC and MUC5B) and the periciliary layer (PCL) as a liquid-filled “sol” domain (4, 5). Bii: gel-on-brush model depicting a MUC5B- and MUC5AC-populated mucus layer juxtaposed to PCL comprised of “brushlike” epithelial-tethered mucins MUC1, 4, 16, and 20 (not shown), and likely other large glycopolymers. C: MUC5B, MUC5AC, and club cell secretory protein (CCSP) mRNA coexpression is region specific. Top: hematoxylin and eosin (H&E)- and Alcian blue and periodic acid-Schiff (AB-PAS)-stained sections of 4 airway regions. Bottom: localization of MUC5B and MUC5AC with CCSP mRNAs by RNA in situ hybridization (ISH) in the 4 different regions of normal/healthy human airways. For cellular localization, MUC5B (green), MUC5AC (red), and CCSP (white) mRNAs were visualized by fluorescent RNA ISH. Single-color images were merged (“overlay”) and the overlaid images superimposed on differential interference contrast (DIC) images. In SMGs, mucus cells exhibited large mucin granules definable by AB-PAS staining (insets in H&E- and AB-PAS-stained sections). In primary bronchial superficial epithelium, 2 nonciliated CCSP+ epithelial cell types were identified: 1) a nonciliated epithelial cell with an AB-PAS-stained apical bulge (black arrowheads) and 2) a nonciliated epithelial cell without the apical bulge (white arrowheads). In distal bronchioles, nonciliated epithelial cells with dome-shaped apical bulges (black arrows) dominated. Nuclei were stained with DAPI (blue). Scale bars, 20 µm. D: quantification of cell types expressing MUC5B, MUC5AC, and/or CCSP mRNAs in different regions of normal/healthy human airways. Data are expressed as the number of each cell type per millimeter of basement membrane (BM). Solid bars and error bars represent mean ± 2 SD. n = 5. *P < 0.05 compared with every other cell type. E: distinct regional distributions of MUC5AC, MUC5B, and CCSP mRNA localization in superficial epithelium of the normal/healthy lung. Data represent the calculated % of total MUC5AC, MUC5B, or CCSP mRNA-stained volumes for each airway region. Total MUC5AC, MUC5B, or CCSP mRNA-stained volumes for each airway region were calculated by multiplying the mean values of the RNA ISH volume densities for each airway region obtained from 5 normal/healthy lungs by the predicted total surface area of corresponding airway regions. Images in B from Refs. and and used with permission from Science and New England Journal of Medicine, respectively. Images in C–E from Ref. and used with permission from American Journal of Respiratory Critical Care Medicine.
FIGURE 2.
FIGURE 2.
Characteristics of airway mucins. A: domain structures and relative sizes of the secreted mucins (MUC5AC and MUC5B) and tethered mucins (MUC1, MUC4, and MUC16). For reference, the globular protein albumin (ALB) is shown. The secreted mucins are composed of macromonomers with NH2 (N) terminals (MUC5AC, green; MUC5B, light blue), glycosylated domains, and COOH (C) terminals (MUC5AC, yellow; MUC5B, purple). Both the terminal C-C dimers and terminal N-N multimers are linked by cysteine-mediated S-S bonds. Note the molecular mass of the MUC5AC and MUC5B multimeric mucins typically exceeds 250 MDa. The tethered mucins have cytoplasmic NH2-terminal (dark gray), transmembrane (yellow), and heavily glycosylated extracellular domains (blue). For simplicity, unique domains and proteolytic cleavage sites are not shown. Estimated molecular weights are for the glycosylated forms of the secreted mucin macromonomers and tethered mucins. B: schematic of mucin glycoprotein macromonomer domains and sizes. Relationships of NH2- and COOH-terminal domains, cysteine-rich domains, and glycosylated domains not depicted to scale. C: biosynthesis of dimers in endoplasmic reticulum and multimers in the Golgi apparatus, respectively. Classic nonassociating mucin polymer shape depicted. A contains content from Ref. and is used with permission from New England Journal of Medicine.
FIGURE 3.
FIGURE 3.
Properties of the periciliary layer-glycocalyx (PCL-G). A: mesh properties of the PCL-G. Ai: diagram depicting strategy to measure by confocal microscopy the molecular size sieving/permeability properties of the PCL-G. Fluorescent dextrans of varying sizes (radius of gyration, Rg) are utilized to 1) penetrate the PCL-G and define the epithelial surface (red dextran, Rg = 1 nm) and 2) characterize the graded mesh size/permeation characteristics of the PCL-G (larger green dextrans, Rg = 5–100 nm). Aii: X-Z confocal image of human airway cultures exposed to a small (1-nm Rg) red dextran with a graded series of larger (in nanometers) green dextrans. Aiii: graph depicting PCL height (z-axis) as defined by restriction of dextran probe (blue circles) access [exclusion zone (z)] to the cell surface. A similar relationship between size and PCL exclusion distance was observed with 20- and 40-nm nanoparticles (red triangles). The PCL-excluded molecules with Rg ∼40 nm are at the top of the PCL (the boundary) and define PCL height, and molecules with Rg ∼ 5 nm are near the cell surface. Note closer to the cell surface (lower z-axis number), the mesh becomes “tighter,” i.e., more restrictive. The PCL mesh size, i.e., correlation length (ξ), varies with the distance from the cell surface (z) as ξ = 17.5 nm·ln[7 µm/(7 µm–z)] where 17.5 nm was used as the average ξ for the PCL (blue line). B: properties of cell surface glycocalyx on nonciliated cells. Bi: forest plot depicting levels of RNA expression in major airway epithelial cell types based on single-cell RNA sequencing (RNAseq) experiments (35). Bii: comparison of height of PCL on ciliated cell (left, blue) and PCL-G on adjacent secretory cell (right) utilizing X-Z confocal imaging of dextran permeation. Green probe = 40 nm; red probe = 5 nm. Content in Ai to Aiii from Ref. and used with permission from Science.
FIGURE 4.
FIGURE 4.
Mucus and PCL osmotic pressures. A: diagram of device modified to measure mucus osmotic pressure. Upper and lower hemichambers and pressure sensor depicted. A semipermeable membrane separates the hemichambers. B: depiction of the mucus layer-PCL interface as the semipermeable boundary separating the mucus layer and PCL compartments. C: concentration-dependent mucin polymeric interaction regimes. Ci: in the dilute regime, the mucin polymers are separated by distances greater than their size, Rg. Cii: at the overlap concentration (c*), the mucins polymers are separated by a distance on the order of their size, i.e., they just “touch.” Ciii: in the semidilute/interpenetrating regime, the centers of mass of mucin polymers are separated by distances smaller than their size, and thus mucins overlap with one another, i.e., interpenetrate (134). The average distance between nearest sections of mucin polymers is the correlation length (ξ), i.e., a measure of concentration. D: human bronchial epithelial (HBE) mucus osmotic pressure without and with fractionation by preparative chromatography into large molecular (“mucin”) and small molecular (“nonmucins” such as globular proteins) fractions. Di: measurement of total mucus osmotic pressure utilizing a 10 kDa semipermeable membrane of intact HBE mucus as a function of mucus concentration (total organic solids). Dii: measurements of the contributions of the mucin and globular protein fractions to HBE mucus osmotic pressure as a function of concentration. Cos, total organic solids concentration; Cm, mucin concentration; Cp, globular protein concentration. Osmotic pressure measurements of each component were performed utilizing 10 kDa MW cutoff semipermeable membranes. Blue dashed line is fitted to globular protein (Cp) measurements using the Van’t Hoff equation (Eq. 2) that predict a globular protein MW (i.e., number average protein mass, Mp) of 66 kDa. The red dashed line to the left of c* (0.6 mg/mL) depicts the osmotic pressure of mucins in dilute conditions (cm < c*) calculated from Eq. 2 with predicted mucin MW (i.e., number average mucin mass, Mm) = 100 MDa. The osmotic pressure values for mucin concentrations (cm) above c* are fitted by the dashed red line generated by the power law term of Eq. 3 describing the osmotic pressure of semidilute mucin solutions. (Courtesy Dr. Phillipe Lorchat.) E: PCL osmotic pressure. PCL height (distance of PCL surface/boundary to epithelial cell surface) dependence on PCL osmotic pressure (ΠPCL) as measured by PCL osmotic compression in response to luminal high-molar-mass dextran polymer administration (black symbols/line). Red line depicts PCL height dependence on osmotic pressure (Eq. 6) estimated from the height-dependent tethered mucin mesh size (ξ) variation within the PCL layer (see equation in legend for FIGURE 3Aiii). See glossary for other abbreviations. E uses content from Ref. , with permission from Science.
FIGURE 5.
FIGURE 5.
Airway epithelial ion transport regulation of airway surface liquid volume/surface area (height). A: diagram of the mucus layer and periciliary-glycocalyx layer in context of epithelial active ion transport pathways. The mucus layer is depicted with 1.5% organic solids concentration. Osmotic moduli (K) of the mucus layer (KML) and PCL (KPCL) in pascals (Pa) are noted. An epithelial Na+ channel (ENaC) on the apical airway epithelial membrane mediates Na+/liquid absorption. In parallel, the epithelium can secrete Cl/anions (and liquid) to the lumen via the CFTR channel and a calcium-activated channel (CaCC) (93). The balance between active Na+ absorption and Cl secretion is regulated in part by the concentrations of extracellular ATP, interacting with P2Y2 receptors (P2Y2Rs), and adenosine (ADO), interacting with A2B receptors. P2Y2R activation inhibits Na+ absorption and stimulates CFTR/CaCC-mediated Cl secretion, producing/accelerating liquid secretion (152, 153). A2B activation accelerates CFTR-mediated Cl secretion, also producing liquid secretion. B: expression of ion channels in human airway epithelial cells. Bi: the “classic”/previous paradigm depicted CFTR, ENaC, and related basolateral ion channels (not shown) as expressed in ciliated cells. Bii: a new paradigm has CFTR, ENaC, and related basolateral ion channels/transporters (not shown) mediating transepithelial ion flows expressed in CCSP+, mucin-expressing secretory cells in both large and small airways (133). The possibility that still some CFTR is expressed in ciliated cells is shown (133). A rare cell type, the ionocyte (yellow), is depicted in large airways that expresses high levels of ENaC and CFTR. See glossary for other abbreviations.
FIGURE 6.
FIGURE 6.
Airway surface liquid volume regulation. A: diagram of purinergic signaling pathways that coordinately control directions/rates of transepithelial ion and fluid transport and ciliary beat frequency (CBF) by the two major lumen-facing epithelial cell types, i.e., ciliated and secretory cells. The pannexin 1 (PANX1) ATP-releasing apical membrane hemichannel, cell surface/shed extracellular enzymes that metabolize ATP, ADP, AMP, and adenosine (ADO) (ENTPDases, 5′-NT), apical purinoceptors (nucleotide, P2Y2R; nucleoside, A2B), and regulated CFTR, ENaC, and Ca2+-activated (CaCC) ion channels shown. Purinoceptors and ecto-enzyme nucleotide/nucleoside metabolic enzymes are depicted as commonly expressed in both ciliated and secretory cells. Pannexin-1 (PANX-1)-mediated ATP release from ciliated cells consequent to cilia-mucus sensing (see FIGURE 6D) regulates cilial beat frequency in an autocrine fashion and regulates ion transport in secretory cells in a paracrine fashion. The extracellular metabolite of ATP, i.e., adenosine, also regulates CBF and ion transport in autocrine and paracrine fashions, respectively. In secretory cells, ATP is imported into mucus granules (MG) via the vesicular nucleotide transporter (VNUT) and metabolized to ADP and AMP. These nucleotides are co-released with mucins and, via metabolism to adenosine, trigger autocrine ion/fluid secretion to hydrate the newly secreted mucins. Note, although not depicted for simplicity, P2Y2R is expressed on secretory cells and when activated triggers mucin secretion. The absence of co-release of ATP with secreted mucins protects from excessive, autocrine-mediated ATP mucin secretion. Also not depicted for simplicity, ADP/AMP release from secretory cells likely also provides adenosine for regulation of ciliary beat frequency in adjacent ciliated cells. Thus nucleotide release exhibits critical autocrine and paracrine signaling properties for coordination of efficient mucus transport. B: control of airway surface liquid volume/surface area (height) by purinergic signaling as imaged by X-Z confocal microscopy. Bi: addition of fluorescent dextran-containing solution to cultured human airway surface without (top) or with (bottom) subsequent aspiration at time (t) 0 is followed by autoregulation over 4–6 h to a common height that is governed by rates of ATP release and conversion to ADO (courtesy of Dr. Robert Tarran, University of North Carolina-Chapel Hill). N = 8. Bii: basal ATP release and conversion to ADO governs Na+ vs. Cl transport rates to generate basal ASL heights of ∼7 µm. Addition of enzymes to metabolize extracellular ATP (apyrase, APY) and adenosine (adenosine deaminase, ADA) abolishes the ability of the human bronchial epithelial (HBE) culture to maintain a 7-µm ASL height (blue dashed line). The default Na+ absorptive pathway removes all available ASL (216). Biii: dependence of ASL on concentration of added nonmetabolizable adenosine analog 5′-N-ethylcarboxamidoadenosine (NECA). Higher NECA concentrations stimulate higher fluid secretion rates and higher steady-state ASL height (216). Biv: CF vs. normal ASL homeostasis under static conditions. In contrast to normal cultures, CF cultures cannot maintain adequate airway surface volumes (height) under static conditions. Levels of ASL adenosine and A2B expression are similar in CF and normal HBE cultures (152). The failure of the mutant CFTR to secrete Cl/fluid and moderate ENaC-mediated Na+ absorption drives ASL depletion in CF. C: control of airway surface hydration during tidal breathing. Ci: under static conditions, ATP release rates are fixed at ∼400 fmol/cm2/min and generate an ∼7-µm-deep ASL layer height. The mechanical shear and transmural stretch imparted onto airway epithelia during normal breathing increase ATP release rates via PANX-1 hemichannels. As a result, ASL ATP levels increase, which inhibits Na+ absorption, increases (via metabolism-generated ADO) Cl/fluid secretion, and increases ASL volume/height. Fluid secretion dilutes mucus concentrations (depicted as % organic solids). Cii: relationship between the magnitude of changes in luminal ATP concentrations and ASL height. Human airway cultures were subjected to varying degrees of oscillatory stress during measurements of luminal [ATP] and steady-state ASL heights. These data revealed a direct relationship between [ATP] and changes in ASL height (correlation coefficient = 0.95 and slope = 0.3 mm height per steady-state change in ATP concentration) (216). D: airway epithelial autoregulation of proper surface hydration states, i.e., 97.5% water, 1.5% organic solids, 1% salt mucus, is mediated by mechanotransduction sensing by motile cilia. Motile cilia interact with mucus layer and transfer momentum to the layer. The yield stress of the mucus layer in response to ciliary beat is a function of mucus concentration. If mucus becomes hyperconcentrated/dehydrated, mucus layer yield stress increases (right). The decreased deformability (higher yield stress) of the mucus layer increases the strain on the ciliary shaft during ciliary beating, which promotes PANX-1-mediated increases in ATP release (bottom). Increased ATP release increases local ATP concentrations, increases fluid secretion (left), and rehydrates mucus to favorable homeostatic states in an autoregulatory feedback loop (top) (216). E: requirement for motile cilia in autoregulation of mucus hydration. Cilia from normal subjects respond to hyperconcentrated (6%) mucus with an increase in ATP release and a higher steady-state concentration of ATP within ASL. Primary ciliary dyskinesia (PCD) cultures, with absent cilial motility, fail to sense mucus hyperconcentration and accelerate ATP release/increase ATP concentrations within ASL. See glossary for other abbreviations. Content from Ref. used with permission from Science Signaling.
FIGURE 7.
FIGURE 7.
Integration of osmotic driving forces at the PCL-apical airway epithelial barrier, within airway surface liquid compartments, and relationships to mucus transport rates. A: schema depicting osmotic pressures/moduli related to mucus hydration. Note that because the osmotic forces of the cell (255), lateral space globular proteins (256, 257), and lateral space NaCl gradients (258) have been measured as osmotic pressures, for simplicity, all forces in this figure are depicted as pressures rather than moduli. Semipermeable barrier 1 depicts the airway apical epithelial barrier consisting of the apical cell membranes and tight junctions. Semipermeable barrier 2 describes the mucus layer-PCL interface. Three transapical epithelial osmotic forces govern water flow across semipermeable barrier 1, which has a high water permeability (PH2O). First, there are the osmotic pressures of the PCL and the cell. The cell osmotic pressure (πcell ∼10 kPa) is dominated by the cell cytoskeleton and not cytoplasm (30 Pa) (255). The PCL osmotic pressure (πPCL) is ∼250–500 Pa in basal, i.e., healthy, conditions. Second, there are the osmotic pressures generated by the small globular proteins (πp) secreted into airway surface liquid (e.g., CCSP) and proteins (e.g., albumin) passively permeating into ASL from the interstitial fluid bathing the basolateral aspects of the cell. The osmotic pressure of the globular protein component of the mucus layer has been measured at ∼40–100 Pa in health (FIGURES 3D and 12C). Because the PCL does not restrict permeation of globular proteins, the osmotic pressure of the globular proteins in the PCL is equivalent to the osmotic pressure of globular proteins measured in the mucus layer (see FIGURE 4). The globular protein osmotic pressure in the lateral space between airway epithelial cells is estimated at ∼ 60% of that of plasma proteins, i.e., ∼1.5 kPa, based on studies of lung lymph protein concentrations (256, 257). Third, active ion absorption generates small, i.e., ∼2 mM, NaCl gradients between the apical solution and the epithelial lateral space (258). The osmotic pressures, however, generated by the small ion gradients produced by active ion transport are large, i.e., ∼15 kPa. Note, ranges of πmucus, πPCL, and πp are depicted for basal conditions vs. severe airway surface liquid depletion, i.e., dehydration (values to right of arrows). Because the ion concentrations are isotonic under both basal and liquid (water)-depleted conditions, no range for extracellular NaCl concentration is depicted. B: relationships between net direction/magnitude of epithelial ion transport, the relative osmotic moduli of the mucus layer and PCL-G, and mucus transport rates. The relative water-drawing powers (osmotic moduli) of the mucus layer (KML) and PCL (KPCL) interfaced to epithelial cell-mediated fluid absorption or secretion (blue arrows) are depicted. The length of the Hookean springs (to right of the cell models) denotes the height of the PCL (purple) or mucus layer (green), and the spring diameter is inversely proportional to osmotic modulus. Bi: in the normal state, KML is lower than KPCL, Na+ absorption and Cl secretion balanced, and MCC proceeds at physiologically adaptive rates. The Hookean spring model depicts this state with a green spring (KML) with a diameter larger than the purple spring (KPCL). Bii: transient period of fluid absorption (blue arrow) from apical surface by transepithelial Na+ transport. Modest amounts of fluid are removed from the compartment with the lower-osmotic modulus, i.e., the mucus layer. The KML remains lower than KPCL, so MCC is maintained at effective rates. Biii: transient period of fluid secretion mediated by transepithelial Cl secretion (blue arrow). The PCL has the higher osmotic modulus, but its volume is fixed by the tethered mucins. Accordingly, the newly secreted fluid enters the lower-modulus, but expandable, mucus layer. The newly added hydration of the mucus layer is predicted to have small effects to increase MCC. In the context of both transient fluid absorption and fluid secretion, the mucus layer acts as a buffer/reservoir to store fluid on airway surfaces in a manner that preserves MCC. Biv: in a dehydrated state, persistent/abnormal absorption initially removes fluid from the lower-osmotic modulus mucus layer, but as KML = KPCL, fluid is removed coordinately from both the mucus layer and the PCL. The osmotic moduli of both layers are increased and equalized (smaller spring diameters) and volume depleted (springs shortened). This state osmotically compresses the cilia and produces mucus stasis. C: schema depicting relationships predicted by the gel-on-brush model between mucus percent solids, osmotic moduli of the mucus layer (KML), the periciliary layer (PCL) in the basal state (KPCL), and mucus clearance rates. Note, because the published data depicted in D were presented as total % solids, the values on the horizontal axis of FIGURE 7, C AND D are shown as total % solids. At normal mucus hydration (∼1.5% total solids), the osmotic modulus of the mucus layer is below basal PCL values (KPCL), the PCL is fully hydrated, and mucus transport is efficient. At modest levels of mucus dehydration (i.e., % total solids ∼3–4%) the osmotic modulus of the mucus layer slightly exceeds the basal PCL value, modest compression of the PCL results, and mucus transport slows. When mucus dehydration is severe (i.e., % total solids ∼7–8%), the mucus layer osmotically compresses and/or traps the cilia, producing mucus stasis and adhesion. D: relationships between mucus concentration and mucociliary transport measured in vitro in cultured human airway epithelia. Data are presented as means ± SE; n = 4–6 per group (14). See glossary for other abbreviations. A was created with BioRender.com, with permission. Bi, Biv, and C use content from Ref. , with permission from New England Journal of Medicine. C and D use content from Ref. , with permission from American Journal of Respiratory and Critical Care Medicine.
FIGURE 8.
FIGURE 8.
Relationships between osmotic forces generated by secreted polymeric mucins, active ion transport, and ASL height. A: measures of airway epithelial mucus concentration and height with time. Total % organic solids mucus concentration (Ai) and ASL height (Aii) measured over time in airway epithelial cultures allowed to secrete mucus without luminal washing. Note that mucus concentration reaches a quasi-steady-state plateau, whereas mucus height (mass) continues to increase with time. n = 7 (Ai); n = 4 (Aii). B: X-Z confocal ASL height measurements of human bronchial epithelial (HBE) culture exposed to hypertonic saline (HS) alone or HS in combination with an ENaC inhibitor (P1037). As predicted, pharmacological inhibition of ENaC slows/abolishes fluid absorption and, hence, reductions in ASL height following HS administration. C: X-Z confocal measurements of ASL height in HBE cultures exposed to PBS alone (control) or solutions containing 3 kDa MW dextrans at concentrations designated to produce ∼4.5 kPa or ∼17.8 kPa osmotic pressures. Strikingly, the osmotic pressure generated by active ion transport favoring fluid absorption (∼15 kPa; see FIGURE 7A) can be offset by administration to the apical surface of an apical membrane impermeable dextran solution with an osmotic pressure of ∼17.8 kPa. These data support the notion that hyperconcentrated mucus can generate osmotic forces sufficient to modulate the effects of active ion transport. n = 3 (8% and 16% dextran); n = 6 (control). See glossary for abbreviations. B uses data from Ref. , with permission from European Respiratory Journal.
FIGURE 9.
FIGURE 9.
Ciliary structure and function. A: components of ciliary beat cycle. Metachronal wave produced by 100 s of cilia beating in a coordinated fashion. The effect stroke (ES, blue arrow) is in the same direction as mucus flow (top black arrow), and the recovery stroke (RS, red arrow) is in the same direction as the propagation of the metachronal wave (bottom black arrow). Image from Ref. . B: molecular architecture of cilium showing the 9 outer microtubules (MTs, yellow) arranged around a central pair of MTs (green). Dynein motor proteins connect the outer MTs and generate the force that bends the cilium. C: cross section of cilium showing the spacing of MT (yellow circles) architecture of cilia. Dynein pairs between adjacent outer MTs on one side of the cilium drive the effective stroke (blue arrows), whereas the recovery stroke (red arrows) is driven by dynein pairs on the opposite side of the organelle. The angle column that motor proteins make with the bending direction dictates their contribution to the bending of the cilium. D: cartoon of the side view of the orange rectangle in B showing dynein motor proteins pulling MTs as they “walk” and bend the cilia. E: profile view of the cilia waveform during the effective and recovery strokes. Blue lines are the position of the cilia during the effective stroke, and red lines show the position of the cilia during the recovery stroke. Purple lines are the position of the cilia at the transitions between each stroke. F: displacement of a bead bound to the tip of a cilium during the effective (blue arrow) and recovery (red arrow) strokes along the direction of cilia beat (279). The maximum cilia tip velocity (Vtip) observed during the effective stroke is ∼200 µm/s, whereas the maximum Vtip during the recovery stroke is 150 µm/s. Images adapted from Refs. and , with permission from Journal of Theoretical Biology, Biophysical Journal, and Biomedical Optics Express, respectively.
FIGURE 10.
FIGURE 10.
PCL compression by cilia. A: as cilia beat, they must generate sufficient stress to compress the PCL (black arrow). Since water is incompressible, water is pumped out of the PCL by cilial compression (blue arrow). At the midpoint of the effective stroke (blue), the cilia are extended to their maximum height, and the cilial shaft-tethered mucins barely “touch” each other. In contrast, at the end of the effective stroke (red), the cilia compress the PCL by 3 µm of PCL. B: when cilia are extended from the cell surface (orange rectangle in A), the pore spacing of the PCL is large and all water within 7 μm of the surface is associated with the PCL. C: cilia at the end of the effective stoke (purple rectangle in A) compress one another, resulting in expulsion of water from the PCL. See glossary for abbreviations.
FIGURE 11.
FIGURE 11.
Mucociliary interactions. A: motion of beads embedded in mucus at the mucociliary interface (281). x in µm is linear displacement. B: the average absolute displacement of the beating cilium tip and the motion of the tracer particles embedded in mucus at the mucociliary interface during the effective and recovery strokes. C: maximum velocity of cilium tip during the effective and recovery strokes (blue) (279) and the average absolute velocity of beads in mucus (purple) during the effective and recovery strokes (281). D: strain rates imposed on flowing mucus. Oscillations in mucus transport (bead) velocity as a function of height above the mucus layer-ciliary interface. Blue is the average minimum (retrograde) velocity (Vmin), orange is the overall average velocity (Vave), and gray is the average maximum antegrade velocity (Vmax). These data indicate that near the mucus-cilia interface, the strain rate (γ˙) is ∼5 s−1 and less than at the mucus-air interface. E: strains imposed on flowing mucus. Cilia induced strains (or the ratio of the displacement over height) in mucus during flow. Strains are calculated as oscillations about the mean bead transport rate and indicate that the strain (γ) at the mucociliary interface is ∼0.05, or 5%. D uses data from Ref. , with permission from Journal of Non-Newtonian Fluid Mechanics.
FIGURE 12.
FIGURE 12.
Rheological length scales referenced to measurement technologies. A: macroscopic data are collected on a cone and plate rheometer. Cone diameters range from 20 to 60 mm with fill volumes of 50 µL to 2 mL. B: microscopic and nanoscopic rheology are measures obtained by adding tracer particles or molecules to mucus (depicted in enlargement of red box from A). If the probe particle is larger than the mesh size of mucus (red, 250-nm probe; blue, 1-µm probe), the microscopic results theoretically will be similar in magnitude to macroscopic results. If the probes are much smaller than the mesh size, like the small molecules (SM) used fluorescence recovery after photobleaching experiments (purple, <5 nm), the probes will measure the rheological properties of the fluid component of mucus, not the polymeric properties. This illustration represents 1% organic solids mucus with a 50-nm correlation length (ξ, mesh size). C: effect of air interface on mucus. In a cone and plate rheometer, a fraction of the volume of the sample being assayed is in contact with air (depicted in enlargement of black box in A). At the air interface, associative mucin polymers (green) with hydrophobic domains (red) adsorb to the air interface, locally increasing the polymer concentration and, thereby, the viscosity of mucus. Cartoon courtesy of Scott Danielsen, PhD, Duke University. C uses content from Ref. , with permission from European Respiratory Journal.
FIGURE 13.
FIGURE 13.
Macroscopic rheology of human airway mucus. A: frequency (ω) dependence of G′ elastic modulus (closed symbols) and G′′ viscous modulus (open symbols) of human bronchial epithelial (HBE) mucus at 1% organic solids. Five decades of frequency data are achieved by combining long-timescale, low-frequency creep recovery data (Creep, red) with data obtained from frequency sweep (Fsweep, blue) experiments (301). Frequency sweep data (Fsweep) are an average of n = 3, whereas creep data are from a single run. B: concentration-dependent mucus rheology (G′ and G′′ at 1 Hz) for 1%, 3%, and 5% organic solids (%os) HBE mucus (301). Graph represents the average of 3 frequency sweep experiments at each mucus concentration. C: strain dependence of rheologic parameters. Nonlinear reduction of G′ (blue, elastic modulus) and G′′ (white, viscous modulus) of CF sputum at high strains. At low strains (0.1−1%) the storage and loss moduli of sputum are greater than at strains associated with mucociliary clearance (MCC, red box) (307). n = 1 in 5% of CF sputum. A and B use data from Ref. , courtesy of Dr. Qishun Tang, and used with permission.
FIGURE 14.
FIGURE 14.
Cough clearance. A: biophysical properties of mucus-cell surface interactions relevant to cough clearance. In the small (distal) airways, the lower-velocity airflow can slide mucus along airway surfaces, a movement limited by mucus-cell surface friction. In large (proximal) airways, the higher airflow fractures intramucus cohesive forces and/or mucus-cell surface adhesive forces to expel mucus. B: peel testing device. Schematic diagram of the peel tester that was used to measure the force required to “peel” the mucus layer off the surface of the epithelium of well-differentiated human bronchial epithelial (HBE) cultures with an endogenous mucus layer. The embedded mesh in the mucus is connected by a thread (tail) to a motor that generates the force to fracture mucus-epithelial adhesive interactions. A force sensor (not shown) connected between mesh and motor measures the forces applied. C: effect of mucus concentration on mucus-PCL adhesive strength. Summary of the adhesion strength vs. mucus concentration over a range that spans normal (1% organic solids) to CF (5–15% organic solids) concentrations when peeled at 100 µm/s. D: effect of mucus concentration on intramucin cohesive strength. Summary of the cohesive strength vs. mucus concentration over a range that spans normal (1% organic solids) to CF (5–15% organic solids) concentrations when peeled at 100 µm/s. See glossary for abbreviations. Data from Ref. used with permission from The Proceedings of the National Academy of Sciences of the United States of America.
FIGURE 15.
FIGURE 15.
Muco-obstructive disease pathogenesis and total mucin concentrations in health and disease. A: progression from normal to muco-obstructed airway states. In healthy persons (left), well-balanced epithelial sodium (Na+) absorption and chloride (Cl) secretion hydrates airway surfaces and promotes efficient mucociliary clearance (MCC). In persons with muco-obstructive lung disease (center), an imbalance of ion/fluid transport coupled with mucin hypersecretion increases mucin concentrations in the mucus layer, osmotically compresses the periciliary layer (PCL), and slows/eventually abolishes MCC. Note, the red X over the cystic fibrosis transmembrane regulator (CFTR) depicts an acquired structural or regulatory defect in CFTR Cl secretory function, and the increased epithelial Na+ channel (ENaC) activity depicts acceleration of Na+ transport due to failures of regulatory inhibition (25). The adherent mucus may be expelled as sputum by cough (top right). Mucus that cannot be expelled by cough accumulates, concentrates, obstructs airflow, and becomes the nidus for infection (bottom right). CF, cystic fibrosis; CFTR, cystic fibrosis transmembrane conductance regulator; COPD, chronic obstructive pulmonary disease; ENaC, epithelial sodium channel; NCFB, non-cystic fibrosis bronchiectasis; PCD, primary ciliary dyskinesia (25). B: total sputum mucin concentrations in healthy persons and subjects with COPD, NCFB, CF, or PCD. Sputum mucin concentrations were measured by high-performance liquid chromatography and refractometry (400, 401). Bars indicate SE, and n = number of subjects studied. C: receiver operating characteristic (ROC) curves for sputum mucus concentration in diseased vs. healthy subjects. Ci: cigarette smoke-induced chronic bronchitis (CB) vs. healthy subjects. Area under the curve (AUC) = 0.76. Cii: NCFB vs. healthy subjects. AUC = 0.95. Ciii: CF vs. healthy subjects. AUC = 1.0. Content from Refs. and used with permission from New England Journal of Medicine. Cii uses data from Ref. , with permission from American Journal of Respiratory and Critical Care Medicine.
FIGURE 16.
FIGURE 16.
Pathogenetic sequence linking chronic injury, mucin secretion but defective hydration, and hypoxia-induced and IL-1α/β-dominated positive feedback cycles. A: chronic injury produces a muco-obstructed epithelium with limited fluid secretory activity, modest mucin hypersecretion, and moderately hyperconcentrated mucin/mucus. B: heterogeneous acute insults to the lung stimulate mucin secretion without adequate fluid secretion. The effect is to increase mucus concentration, produce mucus accumulation and adhesion to airway surfaces, and generate distances for O2 diffusion that limit O2 availability to airway epithelia, resulting in luminal/epithelial hypoxia (blue). C: luminal hypoxia stimulates epithelial release of IL-1α and macrophage release of IL-1β. Both IL-1 cytokines stimulate mucin secretion via interactions with epithelial IL1 receptors (IL1R1) without adequate fluid secretion, producing a further accumulation of hyperconcentrated mucus on airway surfaces and worsened hypoxia (increased epithelial cell blue color). The positive feedback cycles generated are depicted as red plus signs. Note that IL-1α/β also stimulate polymorphoneutrophilic (PMN) inflammation, which may trigger parallel/additional positive-feedback cycles (424, 425). CXCL1, chemokine (CXC motif) ligand 1; ERN2, endoribonuclease 2; SPDEF, SAM-pointed domain-containing Ets transcription factor.
FIGURE 17.
FIGURE 17.
Unified pathogenesis of CF airways disease based on mucus hyperconcentration. A: superficial airway epithelial mucus hyperconcentration contribution to CF airways disease. Ai: one scenario that depicts the generation of hyperconcentrated mucus on CF airway surfaces. Ai, left: in the basal CF state, CFTR fails (green bars with red X) to mature and localize to the apical cell membrane consequent to defective folding/maturation. In basal periods of health (clinical stability), adenosine (ADO)-regulated CFTR-mediated Cl secretion is missing, but it is probable that extracellular ATP-dependent regulation alone of ENaC-mediated fluid absorption (inhibition) and CaCC-mediated Cl/fluid secretion (accelerated) maintains mucus hydration adequate for mucociliary transport. This notion is consistent with normal ASL heights (volumes) in CF airway cultures with cyclic compression stress (mimicking breathing) and preserved central airway MCC rates in vivo (153, 401). Ai, right: with a viral infection and likely aspiration, extracellular ATPase expression (e.g., ecto-ATPases) increases, extracellular ATP levels fall, and, in the absence of downstream adenosine-CFTR compensatory mechanisms, the balance of ion and fluid transport is tipped toward excessive fluid absorption with consequent mucus hyperconcentration and stasis (153). Aii: total % solids content of respiratory secretions for adult normal and CF subjects. Sputum was obtained for normal (non-CF subjects) and CF subjects, whereas “retained” CF mucus was removed from excised CF lungs at time of transplant (76). n = 11–20. Aiii: relationship between the total % solids content of human-derived mucus samples and osmotic pressure. Samples depicted were from normal (green) and CF (blue) sputum, and retained airway mucus samples were obtained from excised CF lungs at the time of transplantation (black). Red dashed line represents the best fit of Eq. 3. Aiv: electron micrographs of airways resected during transplant procedures. Left: normal proximal airway with fully extended cilia. Middle: thickened, hyperconcentrated mucus layer compressing cilia in CF airway. Right: thickened, hyperconcentrated mucus compressing cilia over ciliated cell and PCL-G over secretory (goblet) cell in CF airway. Scale bars, 2 µm. See glossary for abbreviations. Content from Ref. used with permission from New England Journal of Medicine. Aiii uses content from Ref. , with permission from Journal of Clinical Investigation. B: submucosal gland (SMG) mucus hyperconcentration contribution to proximal airway CF airways disease. Bi: SMG mucus concentration expressed as total percent solids for SMG mucus obtained from normal vs. CF excised lungs. Bii: osmotic pressure measured in SMG mucus samples obtained from normal vs. CF excised lungs. Biii: cohesive strength of SMG mucus obtained from healthy vs. CF excised lungs. Biv: transmission electron micrographs of SMG ducts obtained from normal (left) vs. CF (right) excised lungs. Scale bars = 2 µm. Mean cilial height in normals = 6.25 ± 0.22 μm SE; mean ciliary height in CF = 3.78 ± 0.26 µm SE; P < 0.001 (531). Note, all data displayed in Bi-Biv obtained from mucus/ducts of normal vs. excised CF lungs exposed to acetylcholine (10−5 M, 2 h) to facilitate mucus collection (531). Bv: proline-rich peptide 4 (PRR4) as a biomarker for submucosal gland secretion in human subjects in vivo. PRR4 levels were measured in sputum collected from normal subjects, people with CF, and non-CF bronchiectasis (NCFB) and primary ciliary dyskinesia (PCD) disease control subjects. PRR4 levels were measured by mass spectroscopy. B uses content from Ref. , with permission from Science Advances.
FIGURE 17.
FIGURE 17.
Unified pathogenesis of CF airways disease based on mucus hyperconcentration. A: superficial airway epithelial mucus hyperconcentration contribution to CF airways disease. Ai: one scenario that depicts the generation of hyperconcentrated mucus on CF airway surfaces. Ai, left: in the basal CF state, CFTR fails (green bars with red X) to mature and localize to the apical cell membrane consequent to defective folding/maturation. In basal periods of health (clinical stability), adenosine (ADO)-regulated CFTR-mediated Cl secretion is missing, but it is probable that extracellular ATP-dependent regulation alone of ENaC-mediated fluid absorption (inhibition) and CaCC-mediated Cl/fluid secretion (accelerated) maintains mucus hydration adequate for mucociliary transport. This notion is consistent with normal ASL heights (volumes) in CF airway cultures with cyclic compression stress (mimicking breathing) and preserved central airway MCC rates in vivo (153, 401). Ai, right: with a viral infection and likely aspiration, extracellular ATPase expression (e.g., ecto-ATPases) increases, extracellular ATP levels fall, and, in the absence of downstream adenosine-CFTR compensatory mechanisms, the balance of ion and fluid transport is tipped toward excessive fluid absorption with consequent mucus hyperconcentration and stasis (153). Aii: total % solids content of respiratory secretions for adult normal and CF subjects. Sputum was obtained for normal (non-CF subjects) and CF subjects, whereas “retained” CF mucus was removed from excised CF lungs at time of transplant (76). n = 11–20. Aiii: relationship between the total % solids content of human-derived mucus samples and osmotic pressure. Samples depicted were from normal (green) and CF (blue) sputum, and retained airway mucus samples were obtained from excised CF lungs at the time of transplantation (black). Red dashed line represents the best fit of Eq. 3. Aiv: electron micrographs of airways resected during transplant procedures. Left: normal proximal airway with fully extended cilia. Middle: thickened, hyperconcentrated mucus layer compressing cilia in CF airway. Right: thickened, hyperconcentrated mucus compressing cilia over ciliated cell and PCL-G over secretory (goblet) cell in CF airway. Scale bars, 2 µm. See glossary for abbreviations. Content from Ref. used with permission from New England Journal of Medicine. Aiii uses content from Ref. , with permission from Journal of Clinical Investigation. B: submucosal gland (SMG) mucus hyperconcentration contribution to proximal airway CF airways disease. Bi: SMG mucus concentration expressed as total percent solids for SMG mucus obtained from normal vs. CF excised lungs. Bii: osmotic pressure measured in SMG mucus samples obtained from normal vs. CF excised lungs. Biii: cohesive strength of SMG mucus obtained from healthy vs. CF excised lungs. Biv: transmission electron micrographs of SMG ducts obtained from normal (left) vs. CF (right) excised lungs. Scale bars = 2 µm. Mean cilial height in normals = 6.25 ± 0.22 μm SE; mean ciliary height in CF = 3.78 ± 0.26 µm SE; P < 0.001 (531). Note, all data displayed in Bi-Biv obtained from mucus/ducts of normal vs. excised CF lungs exposed to acetylcholine (10−5 M, 2 h) to facilitate mucus collection (531). Bv: proline-rich peptide 4 (PRR4) as a biomarker for submucosal gland secretion in human subjects in vivo. PRR4 levels were measured in sputum collected from normal subjects, people with CF, and non-CF bronchiectasis (NCFB) and primary ciliary dyskinesia (PCD) disease control subjects. PRR4 levels were measured by mass spectroscopy. B uses content from Ref. , with permission from Science Advances.
FIGURE 18.
FIGURE 18.
Effectiveness of inhaled hypertonic saline (HS) for airway hydration in CF vs. normal subjects. A: comparison of CF vs. normal subject human bronchial epithelial (HBE) culture airway surface liquid (ASL) height/volume responses to NaCl deposited on apical surfaces. The height of ASL covering HBE culture surfaces was measured by labeling ASL with Texas Red dextran and X-Z confocal microscopy (401). The ASL height/volume response to a common mass of apically deposited NaCl is shown for CF (Ai) vs. normal (Aii) airway epithelia. Note the larger and more long-lasting, i.e., durable, ASL height (volume) responses in CF compared with normal HBEs. The greater and more durable responses to apical osmolyte deposition in normal HBE cultures pretreated with a CFTR channel blocker (CF172, red) or exposed to a dosing solution with Cl replaced by a CFTR impermanent anion (Na+-gluconate, blue) are consistent with the notion that Cl absorption via CFTR is limiting for NaCl absorption in normal epithelia (Aiii). B: schema depicting deposition of hypertonic NaCl aerosols on CF airway surfaces. The deposited NaCl increases ASL osmolality and osmotically draws water to airway surfaces. In contrast to normals (C), the deposited NaCl remains for longer periods on CF airway surfaces because the transcellular route for Cl absorption, i.e., CFTR, is absent/dysfunctional. (Ca2+-activated channels are not shown for simplicity.) Na+ is retained on airway surfaces for electrostatic reasons. The net result is that inhaled HS (NaCl) is more effective in CF in restoring MCC and clearing obstructing mucus because 1) the mass of deposited NaCl aerosols on airway surfaces at the end of nebulization is greater than in normals, reflecting the absence of NaCl absorption during nebulization, and 2) the deposited NaCl remains aerosols on airway surfaces for longer intervals, providing a more durable hydrating/therapeutic effect. C: fate of deposited HS (NaCl) on normal airway surfaces. The NaCl deposited during aerosol administration acutely increases ASL osmolality and osmotically draws water to the airway surface, diluting mucin concentrations and accelerating mucus clearance rates (MCC). However, the deposited NaCl is rapidly absorbed across the normal epithelium via “open” ENaC and CFTR channels coordinately down the NaCl gradient (NaCl lumen > cell/interstitium) generated by NaCl deposition. The net result is rapid absorption of NaCl, limited duration of airway surface hydration and short-lived acceleration of MCC. D: human whole lung in vivo mucociliary measurements utilizing inhaled radiotracer (621). Di: rates of central lung in vivo mucociliary clearance of inhaled radiotracer particles in people with CF (pwCF) and normal subjects immediately (0–60 min) after administration of aerosolized 7% HS. Dii: rates of mucociliary clearance of inhaled radiotracer particles in pwCF vs. normal subjects 4–5 h after inhalation of 7% HS. Note the greater immediate response and much more durable (4 h) response in CF compared with normal subjects. % Clearance, rate of clearance of deposited radiotracer particles. See glossary for other abbreviations. A contains data from Ref. and is used with permission from New England Journal of Medicine.
FIGURE 19.
FIGURE 19.
Biophysical consequences of mucolytic therapies. A: normal conditions. Normal mucins are >250 MDa in mass (molecular weight, MW) and >250 nm in size (radius of gyration, Rg, depicted by red arrow). Under normal mucus concentrations (c), i.e., 10–20 mg/mL total organic solids (∼3–6 mg/mL mucin concentrations), mucins exceed dilute conditions and are in overlap (c*) or semidilute/interpenetrating conditions and exhibit gel properties, e.g., elasticity and viscosity (η). B: mucins reduced to dimers by prototypic mucolytic agents. Dimers exhibit a MW of ∼ 5 MDa and an Rg of ∼50 nm. The mucin concentrations required to achieve overlap (c*) conditions are described as c* ≈ MW/(Rg3). Thus, at normal mucin concentrations, reduced dimeric mucins with Rg ∼5× smaller than multimeric mucins will be below c*, i.e., remain in dilute conditions. Reduced mucins (dimers) below c* will exhibit 1) a greatly reduced viscosity, predicting improved mucus coughability, and 2) an absence of an elastic modulus (not shown), predicting reduced cilium-dependent transport. C: relationships between concentrations of normal mucin multimers vs. post-mucolysis dimers and mucus-specific viscosity. The ∼3× rightward shift in the mucus concentration (c) required to achieve c* conditions for reduced (dimeric) mucins compared with multimeric mucins is shown on the x-axis (note log scale mucus concentration). A reduction in mucus viscosity is predicted for reduced (dimeric) mucins under normal and disease conditions (hyperconcentrated mucus) relative to multimeric mucins. Gellike properties, including an elastic modulus, are only predicted for reduced (dimeric) mucins in hyperconcentrated disease conditions where mucus concentrations exceed by >3× normal mucus concentrations. Figure courtesy of Dr. Scott P. O. Danielsen, Duke University, and used with permission.
FIGURE A1.
FIGURE A1.
Definition of rheological terms. During a rheological assay, a fluid is deformed by applying stress, σ, or force per unit area to deform a sample. This deformation is quantified as strain γ, or the amount of deformation (δx) divided by the gap height H.
FIGURE A2.
FIGURE A2.
Example of creep and recovery experiments. The compliance, J, is plotted vs. time during a period of active stress or creep (blue rectangle) and recovery (yellow rectangle). The viscosity of the fluid (η) is defined by the inverse of the time derivative of the compliance, and the modulus is defined as the inverse of the recoverable compliance (JR).
FIGURE A3.
FIGURE A3.
Determination of the linear viscoelastic regime (LVR). Top: 2 strain-sweep experiments were run at frequencies of 0.1 and 10 Hz. The LVR (black box) is determined to be the region of the strain sweep at which the least variation is observed across G′ and G′′ at both frequencies. A strain that falls above the instrumental noise threshold and prior to the onset of nonlinear effects (between 0.2% and 1%) is then selected for the frequency sweep experiment (bottom) ranging from 0.1 Hz to 10 Hz.

References

    1. Knowles MR, Boucher RC. Mucus clearance as a primary innate defense mechanism for mammalian airways. J Clin Invest 109: 571–577, 2002. doi: 10.1172/JCI0215217. - DOI - PMC - PubMed
    1. Fahy JV, Dickey BF. Airway mucus function and dysfunction. N Engl J Med 363: 2233–2247, 2010. doi: 10.1056/NEJMra0910061. - DOI - PMC - PubMed
    1. Albert RE, Lippmann M, Peterson HT Jr, Berger J, Sanborn K, Bohning D. Bronchial deposition and clearance of aerosols. Arch Intern Med 131: 115–127, 1973. doi: 10.1001/archinte.1973.00320070111013. - DOI - PubMed
    1. Chatterjee M, van Putten JP, Strijbis K. Defensive properties of mucin glycoproteins during respiratory infections-relevance for SARS-CoV-2. mBio 11: e02374-20, 2020. doi: 10.1128/mBio.02374-20. - DOI - PMC - PubMed
    1. Lucas AM, Douglas LC. Principles underlying ciliary activity in the respiratory tract: II. A comparison of nasal clearance in man, monkey and other mammals. Arch Otolaryngol 20: 518–541, 1934. doi: 10.1001/archotol.1934.03600040074006. - DOI

Publication types