Review
. 2022 Jul 1;102(3):1211-1261.
doi: 10.1152/physrev.00024.2021. Epub 2022 Jan 10.

The role of junctophilin proteins in cellular function

Affiliations
Review

The role of junctophilin proteins in cellular function

Stephan E Lehnart et al. Physiol Rev. .

Abstract

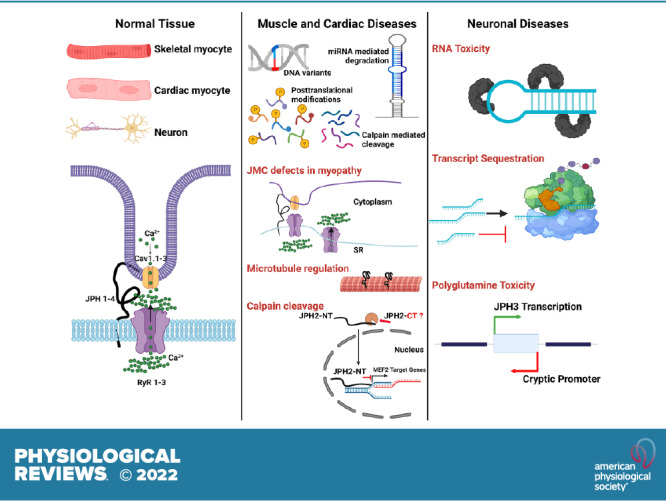
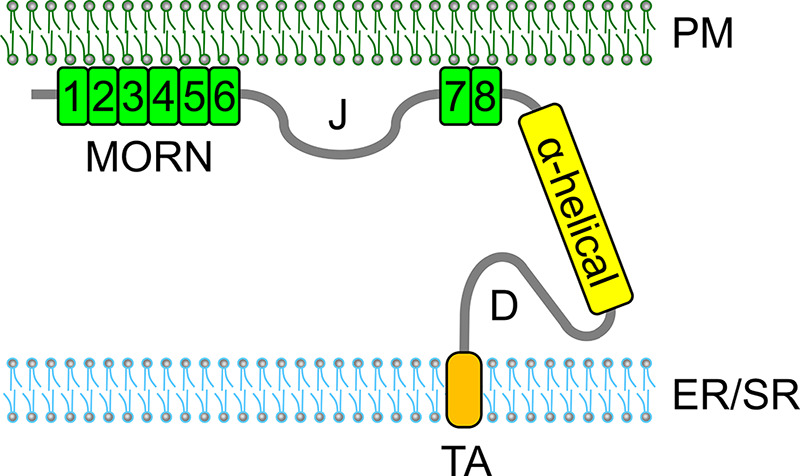
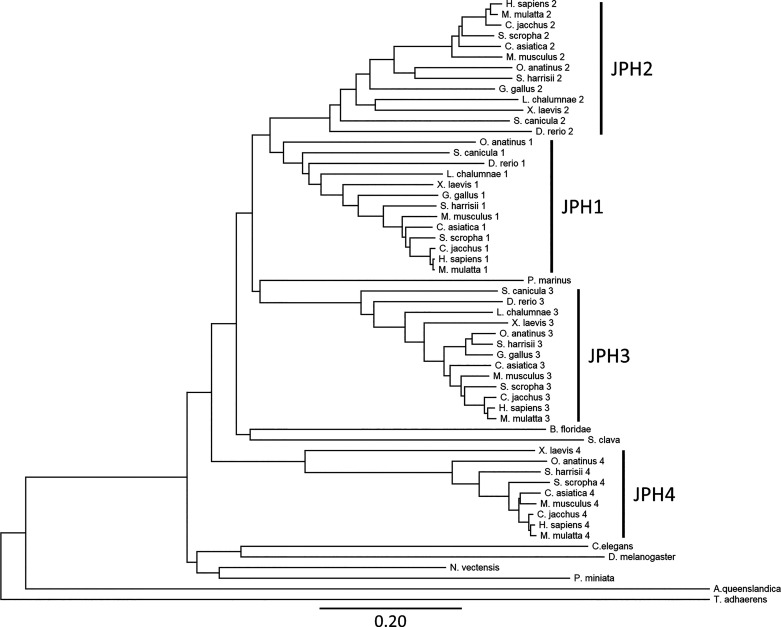
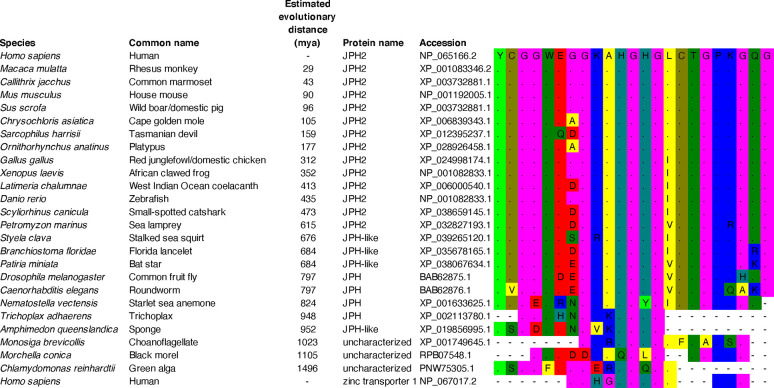
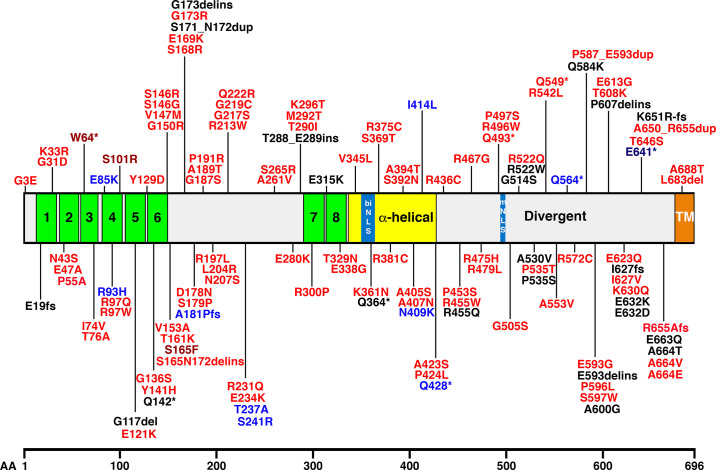
Junctophilins (JPHs) comprise a family of structural proteins that connect the plasma membrane to intracellular organelles such as the endo/sarcoplasmic reticulum (ER/SR). Tethering of these membrane structures results in the formation of highly organized subcellular junctions that play important signaling roles in all excitable cell types. There are four JPH isoforms, expressed primarily in muscle and neuronal cell types. Each JPH protein consists of six membrane occupation and recognition nexus (MORN) motifs, a joining region connecting these to another set of two MORN motifs, a putative alpha-helical region, a divergent region exhibiting low homology between JPH isoforms, and a carboxy-terminal transmembrane region anchoring into the ER/SR membrane. JPH isoforms play essential roles in developing and maintaining subcellular membrane junctions. Conversely, inherited mutations in JPH2 cause hypertrophic or dilated cardiomyopathy, while trinucleotide expansions in the JPH3 gene cause Huntington Disease-Like 2. Loss of JPH1 protein levels can cause skeletal myopathy, while loss of cardiac JPH2 levels causes heart failure and atrial fibrillation, among other disease. This review will provide a comprehensive overview of the JPH gene family, phylogeny, and evolutionary analysis of JPH genes and other MORN domain proteins. JPH biogenesis, membrane tethering, and binding partners will be discussed, as well as functional roles of JPH isoforms in excitable cells. Finally, potential roles of JPH isoform deficits in human disease pathogenesis will be reviewed.

Keywords: cardiomyopathy; excitation-contraction coupling; heart failure; junctophilins.


Conflict of interest statement

No conflicts of interest, financial or otherwise, are declared by the authors.

Figures

None
Graphical abstract
FIGURE 1.
FIGURE 1.
Predicted subcellular organization of junctophilin (JPH) within the junctional membrane complex consisting of the plasma membrane (PM) and endoplasmic/sarcoplasmic reticulum (ER/SR). JPH2 attaches to the PM by means of 2 sets of membrane occupation and recognition nexus (MORN) domains (green), connected by a junctional domain (J). The divergent (D) region with low homology among JPH isoforms. The COOH-terminal tail of JPH2 anchors into the endo/sarcoplasmic reticulum (ER/SR) membrane using a transmembrane domain, TA, tail anchor.
FIGURE 2.
FIGURE 2.
Localization of junctophilin (JPH) genes on chromosomes. Ideograms of chromosomes (Chr.) 8, 20, 16, and 14 (p and q regions), showing the JPH1, JPH2, JPH3, and JPH4 gene locations, respectively. Cytogenic bands are showing in accordance with the International System for Cytogenetic Nomenclature (15). Idiograms were generated using files posted on the website of the Department of Pathology of the University of Washington (16).
FIGURE 3.
FIGURE 3.
Gene and protein diagram of junctophilin (JPH) isoforms. Diagram shows gene diagram including exons and introns in correlation with the protein topology for the 4 JPH isoforms expressed in humans. The membrane occupation and recognition nexus (MORN) domains are shown in green, while the other domains are marked. The exons (E) are shown in pink. JPH, junctophilin; biNLS, biphasic nuclear localization signal; mNLS, monopartite nuclear localization signal; UTR, untranslated region; TM, transmembrane domain.
FIGURE 4.
FIGURE 4.
Phylogenetic tree of junctophilin (JPH) isoforms. The phylogenetic tree was created using 57 JPH isoforms from 22 different species that were selected with different times of the last common ancestor. Protein sequences were aligned using MUSCLE in Mega-X using default settings, a distance matrix was generated, and the phylogenetic tree was generated using the neighbor joining method. Clades containing each of the isoforms are indicated. The scale bar represents the length of each branch as the average number of amino acid substitutions per site (per Mega-X).
FIGURE 5.
FIGURE 5.
Evolutionary trace mapping of human junctophilin 2 (JPH2). Human JPH isoforms were aligned using the MUSCLE function in Mega-X using default settings. The universal evolutionary trace was generated using the Evolutionary Trace viewer created by Dr. O. Lichtarge (44). The human JPH2 sequence is shown as the reference sequence; the output was color coded based on the evolutionary trace scores (rvET) from the RANKS files. Lower scores (blue shaded squares) represent higher importance; higher scores represent a lower importance of amino acids (red shaded squares). Bolded amino acids are conserved across isoforms. Functional domains are underlined. MORN, membrane occupation and recognition nexus; NLS, nuclear localization signal.
FIGURE 6.
FIGURE 6.
Evolutionary conservation of the junctophilin-2 (JHP2) membrane occupation and recognition nexus (MORN)-1 domain. Homologues of the Homo sapiens JPH2 protein were obtained using protein BLAST (see accession numbers). The selected top hit from each species with different evolutionary distances from humans were aligned using the MUSCLE feature in Mega-X. A distance matrix of the aligned sequences was generated using default settings. Estimated evolutionary distance was obtained from TimeTree (30). The colors represent the amino acid types; mya, millions of years ago.
FIGURE 7.
FIGURE 7.
Phylogenetic tree of membrane occupation and recognition nexus (MORN) repeat containing protein families. The phylogenetic tree was constructed using 238 amino acid sequences from a range of proteins found in eukaryotes, bacteria, and archaea. The clustering of this tree revealed 8 distinct families of protein containing MORN repeat-containing proteins: the junctophilins (JPH), alsins (ALS), radial spoke-head homology (RSPH) proteins, four MORN-containing families (MORN1-MORN4), and an ankyrin repeat and MYND domain-containing protein 1-like (ANKMY-L) family, along with another less clearly defined group of proteins. The tree is to scale, with branch lengths corresponding to amino acid substitutions per site, calculated using the average pathway method. Reproduced with permission from Mackrill and Shiels (29).
FIGURE 8.
FIGURE 8.
Junctophilin 2 (JPH2) 3-dimensional structural prediction model. JPH2 template-based tertiary structure modeling by RaptorX visualizing the backbone fold and atomic structure. Labels indicate major JPH2 domains and regions. Inset: magnification (dashed boxes) visualizing the COOH-terminal (C) transmembrane domain (TMD) α-helix of the JPH2 tail anchor in maximal side projection. N, NH2 terminal. Modified JPH2 model based on the same protein sequence from Gross et al. (60) using Molekel software. The color code for the atom structure is red for oxygen (O), blue for nitrogen (N), yellow for sulfur (S), and gray for carbon (C).
FIGURE 9.
FIGURE 9.
Membrane topology, biogenesis, and endo/sarcoplasmic reticulum (ER/SR) membrane insertion of tail-anchored (TA) proteins via the guided entry of TA proteins (GET) pathway. A: topology comparison of the single-pass type II transmembrane protein integrin-α1 (PDB 2L8S) versus the type IV TA protein phospholamban (PDB 2HYN). B: space filling JPH2 3-dimensional (3-D) structure atomic prediction. Wild-type junctophilin 2 (JPH2) template-based tertiary structure modeling by RaptorX and Molekel. The ER/SR membrane leaflets’ approximate positions are indicated behind the TA COOH-terminal (C) domain (orange lines). N, NH2 terminal. Modified JPH2 model based on the same protein sequence from Gross et al. (60) using Molekel software. Molekel is an open-source 3-dimensional molecular visualization package for analyzing the results of computational chemistry packages (61). C: the transmembrane domain provides the moderately to strongly hydrophobic physicochemical properties, targeting TA proteins to the ER/SR organelle (62). D: at the end of ribosomal biogenesis the nascent polypeptide hydrophobic COOH-terminal TA (cyan) faces the challenging aqueous cytosolic environment. SRP, signal recognition particle. E: GET pathway and its components established in yeast: 1) Sgt2 loaded with the TA polypeptide docks to the closed form of the ATP-bound (T) pretargeting complex Get3-Get4-Get5; 2) ATP hydrolysis by Get3; 3) cytosolic translocation of the cargo-loaded Get3-TA complex to the ER membrane, and capture by the Get1-Get2 complex; 4) Get1 interactions driving the transition of Get3 to an open conformation, concomitant ADP (D) release, insertion and release of the TA polypeptide in the ER bilayer; and 5) ATP (T) followed by Get4-Get5 binding driving the dissociation of Get3 from the ER receptor toward its recruitment in the next cycle of TA cargo engagement [modified with permission from Borgese et al. (63)]. F: table summarizing the yeast and mammalian GET pathway components.
FIGURE 10.
FIGURE 10.
Conserved 23-amino acid tandem membrane occupation and recognition nexus (MORN) repeat atomic structures and predicted junctophilin 2 (JPH2) β-strand architecture. A and B: Domain depiction and crystal structure of the NH2-terminal deletion proteins Trypanosoma brucei TbMORN1(7–15) and Toxoplasma gondii TgMORN1(7-15) each forming tail-to-tail homodimers. Amino acid numbers and NH2(N)/COOH (C) termini are indicated on top. The crystal structure is shown both from the side and 90° rotated as indicated. Major dimensions are indicated (double arrows). Each truncated protomer contains 9 MORN repeats of which the 3 COOH-terminal repeats additionally provide the antiparallel tail-to-tail interactions. The secondary structure consists exclusively of antiparallel β-strands and peripheral loops. TbMORN1(7–15) and TgMORN1(7–15) exhibit the same number of MORN repeats and structural configurations. Modified with permission from Sajko et al. (81). C: consensus MORN repeat sequence of TbMORN(7–15) revised according to its crystal structure. While repeats 7–15 exist in the crystal structure, the deleted repeats 1–6 are inferred. Blue color intensities indicate the conservation of sequence identity as indicated by the legend (%cutoff). TbMORN1 consists entirely of MORN repeats and β-hairpins, where the NH2-terminal and COOH-terminal 6-residue β-strands are connected by a 5-residue loop. Finally, a 6-residue loop connects to the subsequent MORN repeat. The highly conserved GxG and additional motifs of the 23-residues consensus MORN repeat are indicated below. Modified with permission from Sajko et al. (81). D: conserved JPH2 YxGxW and GxG motifs of the 23-residues consensus MORN repeat sequence of JPH2. While the JPH2 sequence identity indicated by %cutoff (legend) is lower, the 6-residue tandem β-strands connected by a 5-residue loop are confirmed by similarity to the revised TbMORN1 consensus sequence.
FIGURE 11.
FIGURE 11.
Subcellular junctophilin 2 (JPH2) clustering in atrial and ventricular cardiomyocytes. A: mouse atrial cardiomyocyte confocal section overview (top) and magnified image region indicated by yellow brackets (bottom). Magnification showing the variable subcellular signal qualities of immunostained JPH2 clusters. Larger JPH2 cluster signals (red) marked by white arrowheads are mainly located at deep intracellular axial tubule structures labeled with caveolin-3 (green). Less intense JPH2 signals apparently localize to transverse striations devoid of Cav3 signals. Scale bar = 10 μm. Modified with permission from Brandenburg et al. (82). B: confocal 3-dimensional z-stack projection overview (top) and magnification (bottom) showing intense JPH2 cluster signals (green) mainly deep inside a mouse atrial cardiomyocyte, occasionally intersecting ryanodine receptor 2 (RyR2) channel clusters (red) in transversal striations evident by colocalized signals (yellow). Scale bar = 10 μm. Modified with permission from Brandenburg et al. (82). C: high-power magnification of rat ventricular myocyte. Exchange-PAINT quantitative superresolution imaging of a single cluster of RyR2 channels (red), interspersed JPH2 signals (green), and signal overlay (right). Scale bars = 200 nm. Modified with permission from Jayasinghe et al. (75).
FIGURE 12.
FIGURE 12.
Subcellular ryanodine receptor 2 (RyR2) clustering in ventricular control and transgenic heart sections from adult mice. A-C: superresolution images showing immunolabeled RyR2 channel clusters in left-ventricular myocardial sections at transverse striations. A: junctophilin 2 (JPH2) knockdown (JPH2-KD). B: control wild-type heart section. C: JPH2 overexpression (JPH2-OE). Magnified views of singular clusters are shown in the insets. Scale bars = 4 µm in main panels; scale bars = 0.5 µm in insets indicated by white rectangles. D: RyR2 cluster size. E: number of RyR2 clusters. Mouse strains are indicated by color. Control, n = 11 cells, 2 animals; JPH2-KD, n = 12 cells, 2 animals; JPH2-OE, n = 9 cells, 2 animals. Data are displayed as means ± SE. ***P < 0.001 (Kruskal-Wallis two-sided test). Modified with permission from Munro et al. (74).
FIGURE 13.
FIGURE 13.
Molecular mechanisms of skeletal MCS excitation-contraction coupling. Side view showing a speculative model of the macromolecular complex containing 2 CaV1.1-α1S channels (PDB 3JBR) and 1 ryanodine receptor 2 (RyR2) channel (PDB 3J8H). Multiple SPRY1/3 domains on the cytoplasmic portion of the RyR1 tetramer may mediate the physical coupling with CaV1.1 as indicated [NH2-terminal domain (NTD)]. Vice versa, the voltage-dependent opening of the Cav1.1-α1S pore may induce conformational changes of the β-subunit and the II-III linker, and the latter may trigger conformational interactions through the SPRY1/3 domains of the RyR1 tetramer. Modified with permission from Bai et al. (87).
FIGURE 14.
FIGURE 14.
Cardiac muscle MCS excitation-contraction coupling. Cartoon showing a side view of the molecular junctional membrane complex components. Structured junctophilin 2 (JPH2) domains are indicated by orange boxes, according to Gross et al. (60). Caveolin 3 model following Parton et al. (88). Space-filling structure of the ryanodine receptor 2 (RyR2) channel open state and its functional relation to both the Cav1.2 channel in the T-tubule and the endo/sarcoplasmic reticulum (ER/SR) transmembrane domain (PDB 5GOA) [modified from Peng et al. (89)]. Arrows indicate Ca2+-induced Ca2+ release. RyR2 surface colors: blue, hydrophilic; red, hydrophobic.
FIGURE 15.
FIGURE 15.
Membrane tubulation processes in cardiomyocytes. A: possible mechanism of invaginating T-tubule development at postnatal day (P)5. Caveolin 3 is indicated as coat protein of caveolae (green), bridging integrator 1 (BIN1) as membrane folding coat near the cell surface at the rudimentary tubule (lilac), as well as junctophilin 2 (JPH2) (red) and ryanodine receptor 2 (RyR2) (blue) in the terminal sarcoplasmic reticulum (SR). B: from P10 and later mature T-tubules with SR membrane contacts have formed. Increased JPH2 and RyR2 expression and coclustering in the terminal SR is tightly coordinated with Cav1.2 clustering in JMCs at T-tubules. Note the nonlcaveolar caveolin 3 complexes (green rectangles) and interactions with Bin1, Cav1.2, and JPH2. Axial tubules are connected to T-tubules in a mature cell-wide network. C: acute shRNA-mediated JPH2 knockdown disrupts anchoring of developing T-tubules to the terminal SR and intracellular network maturation. Proliferation of axial tubules and irregular membrane structures is increased and overall similar to observations in heart disease. Modified from with permission from Beavers et al. (145).
FIGURE 16.
FIGURE 16.
Distribution of junctophilin 2 (JPH2) variants in ClinVar superimposed onto JPH2 protein domains. The bar in the middle of the figure represents the human JPH2 protein; functional domains are marked as follows: number green bars represent membrane occupation and recognition nexus (MORN) domains, the yellow box represents the alpha-helical domain, the divergent domain is white, and TM marks the transmembrane domain. The numbers represent amino acids residues; the letters represent amino acid identifiers. biNLS, biphasic nuclear localization signal; mNLS, monopartite nuclear localization signal; del, deletion; dup, duplication; fs, frameshift; ins, insertion. *Stop codon. Red marks hypertrophic cardiomyopathy-linked variants, and dark red indicates LP/P variants (W64*, S101R, S165F). Blue marks dilated cardiomyopathy-linked variants, dark blue indicates LP/P variant (E641*). Black marks variants with an unknown disease association.
FIGURE 17.
FIGURE 17.
Proteolytic pathways of junctophilin-2 in diseased hearts. Schematic showing the protein structure of junctophilin-2 (JPH2) in which major functional domains are highlighted: membrane occupation and recognition nexus (MORN) domains in green, alpha-helical domain in yellow, and transmembrane domain (TM) in orange. Calpain-1 cleavage sites are shown in blue, and calpain-2 cleavage sites are shown in pink. Resulting proteolytic fragments are shown, and their subcellular functions are indicated. biNLS, biphasic nuclear localization signal; mNLS, monopartite nuclear localization signal; HF, heart failure; MEF2, myocyte enhancer factor 2.

Similar articles

Cited by

References

    1. Manivannan K, Ramanan SV, Mathias RT, Brink PR. Multichannel recordings from membranes which contain gap junctions. Biophys J 61: 216–227, 1992. doi:10.1016/S0006-3495(92)81828-3. - DOI - PMC - PubMed
    1. Takeshima H, Komazaki S, Nishi M, Iino M, Kangawa K. Junctophilins: a novel family of junctional membrane complex proteins. Mol Cell 6: 11–22, 2000. doi:10.1016/s1097-2765(00)00003-4. - DOI - PubMed
    1. Franzini-Armstrong C. Fine structure of sarcoplasmic reticulum and tranverse tubular system in muscle fibers. Fed Proc 23: 887–895, 1964. - PubMed
    1. Flucher BE. Structural analysis of muscle development: transverse tubules, sarcoplasmic reticulum, and the triad. Dev Biol 154: 245–260, 1992. doi:10.1016/0012-1606(92)90065-o. - DOI - PubMed
    1. Takeshima H, Hoshijima M, Song LS. Ca(2)(+) microdomains organized by junctophilins. Cell Calcium 58: 349–356, 2015. doi:10.1016/j.ceca.2015.01.007. - DOI - PMC - PubMed

Publication types