. 2022 Jan 10:11:e74057.
doi: 10.7554/eLife.74057.

Archerfish number discrimination

Affiliations

Archerfish number discrimination

Davide Potrich et al. Elife. .

Abstract

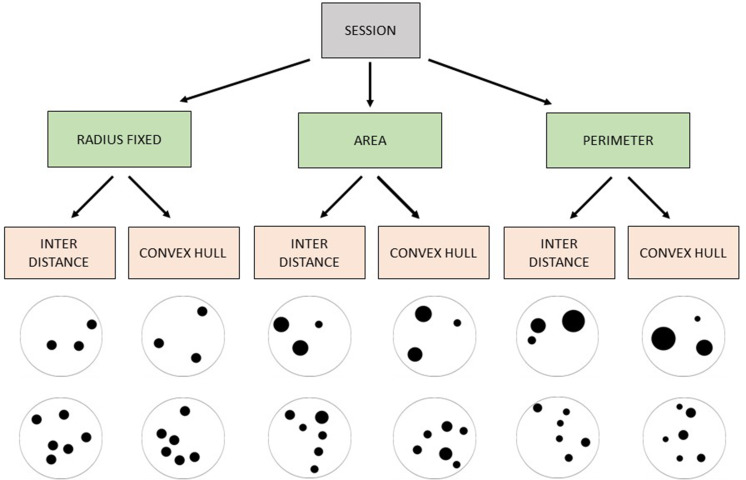
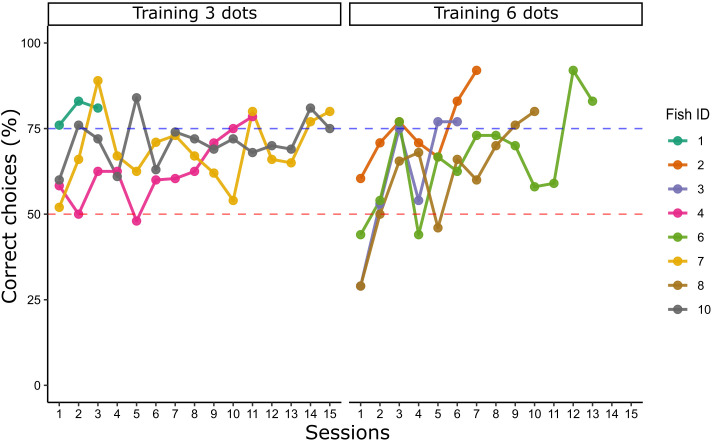
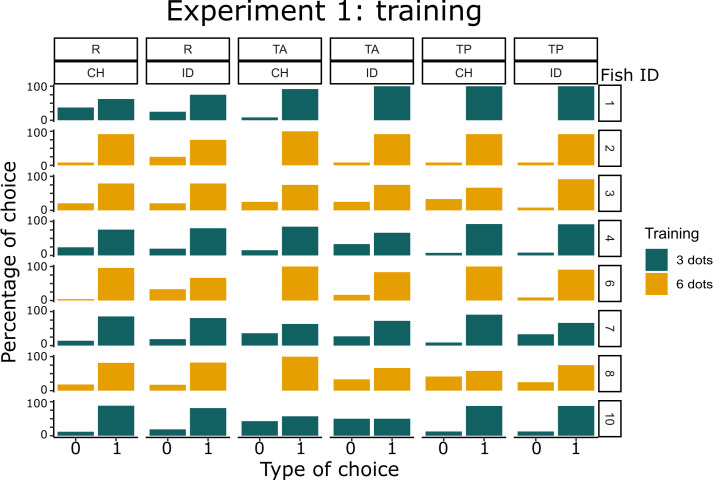
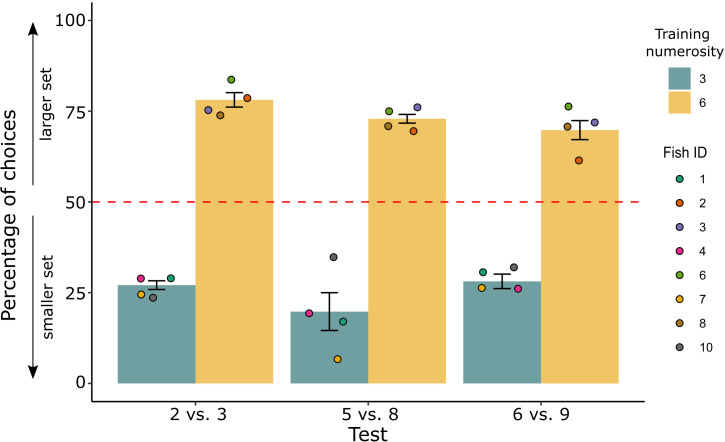
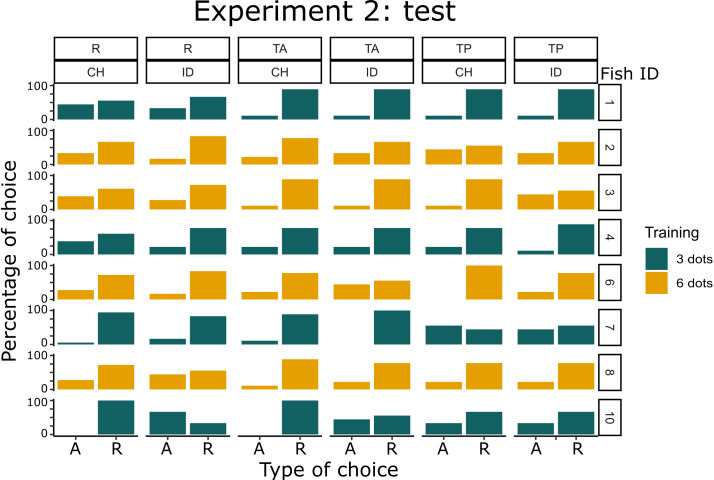
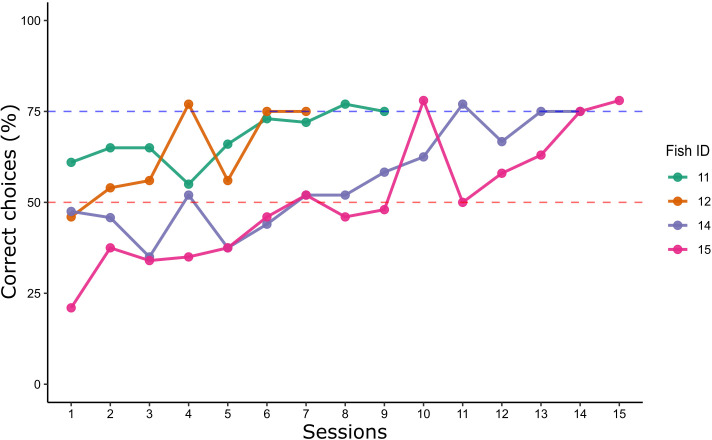
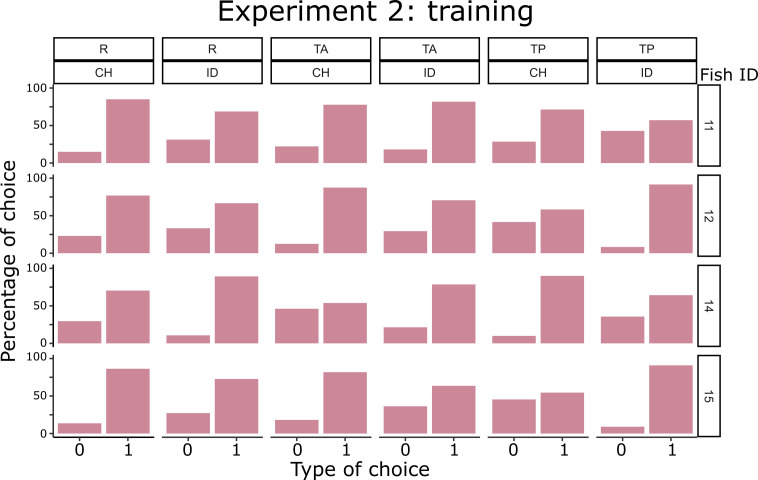
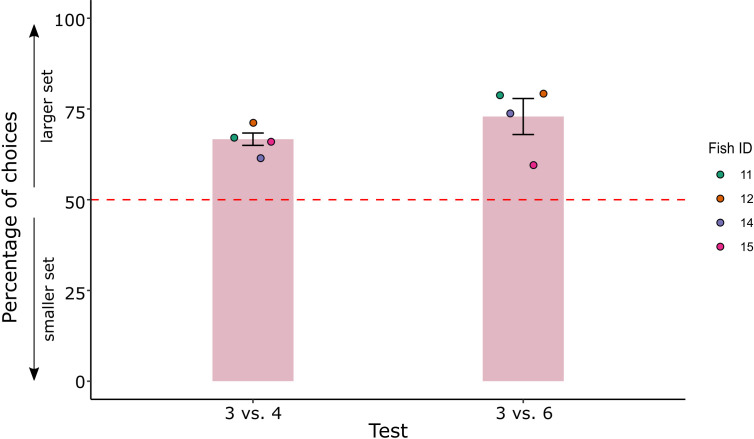
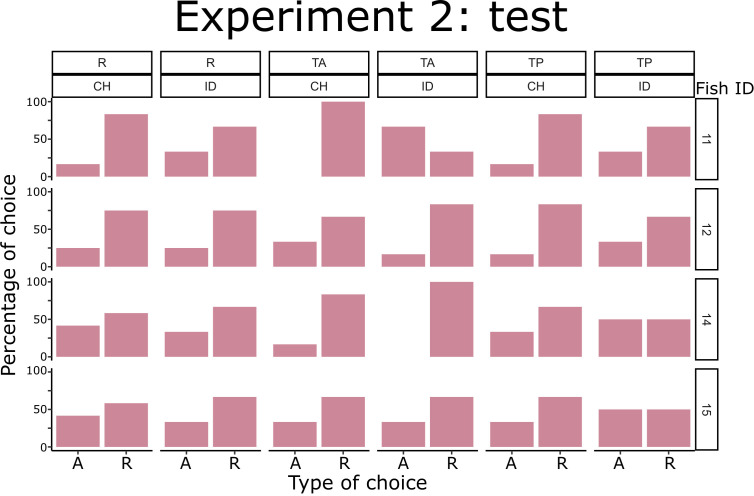
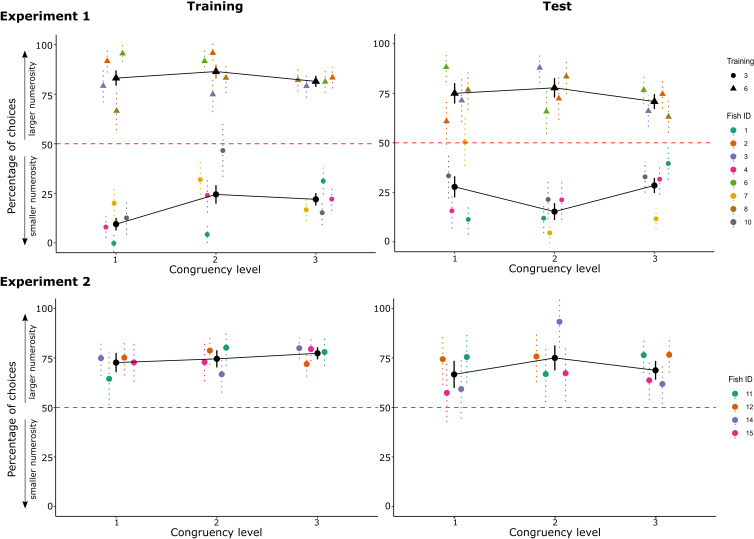
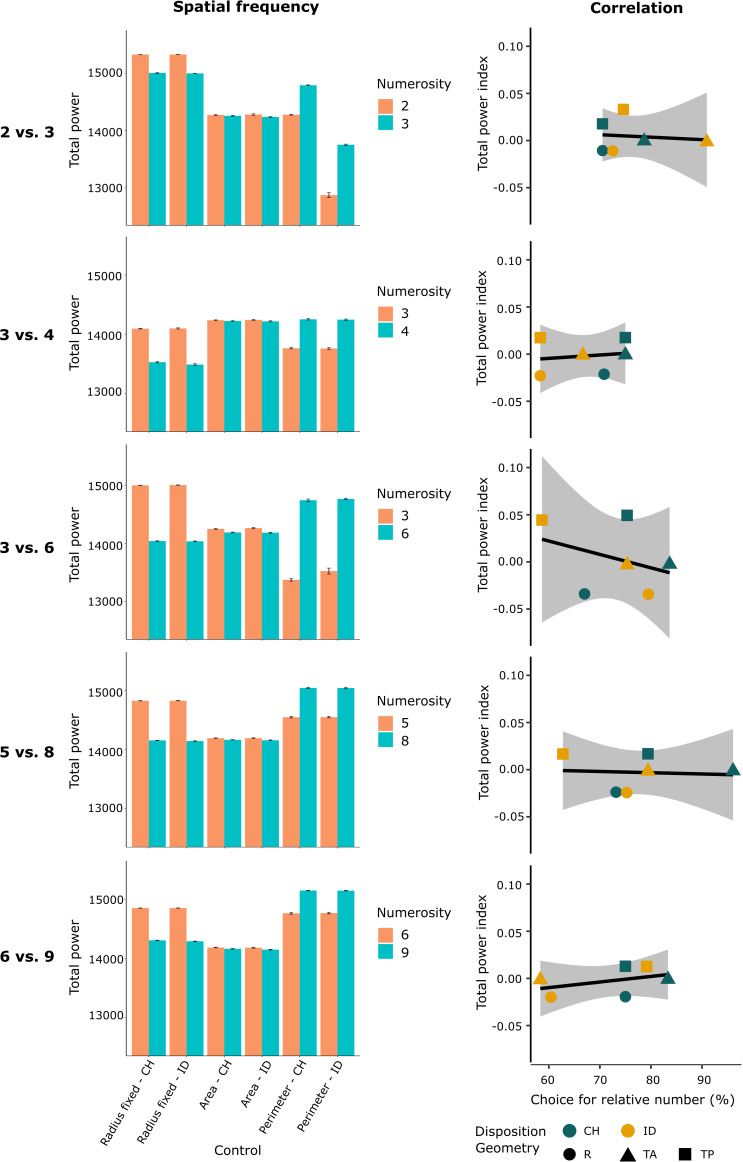
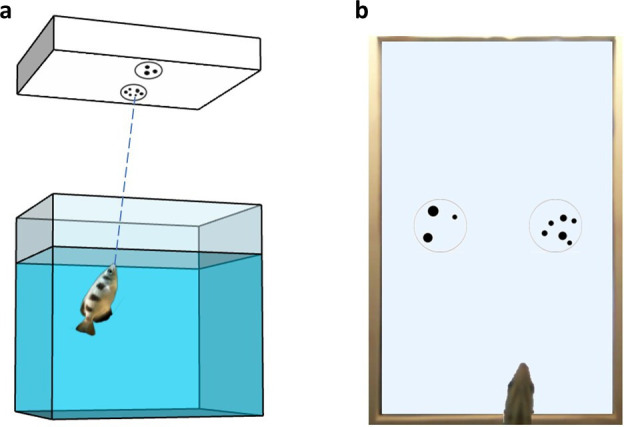
Debates have arisen as to whether non-human animals actually can learn abstract non-symbolic numerousness or whether they always rely on some continuous physical aspect of the stimuli, covarying with number. Here, we investigated archerfish (Toxotes jaculatrix) non-symbolic numerical discrimination with accurate control for covarying continuous physical stimulus attributes. Archerfish were trained to select one of two groups of black dots (Exp. 1: 3 vs 6 elements; Exp. 2: 2 vs 3 elements); these were controlled for several combinations of physical variables (elements' size, overall area, overall perimeter, density, and sparsity), ensuring that only numerical information was available. Generalization tests with novel numerical comparisons (2 vs 3, 5 vs 8, and 6 vs 9 in Exp. 1; 3 vs 4, 3 vs 6 in Exp. 2) revealed choice for the largest or smallest numerical group according to the relative number that was rewarded at training. None of the continuous physical variables, including spatial frequency, were affecting archerfish performance. Results provide evidence that archerfish spontaneously use abstract relative numerical information for both small and large numbers when only numerical cues are available.

Keywords: archerfish; archerfish (toxotes jaculatrix); neuroscience; number; number discrimination; number sense; numerical cognition; numerical rule.


Conflict of interest statement

DP, MZ, GV No competing interests declared

Figures

Figure 1.
Figure 1.. Schematic representation of the non-numerical physical controls applied to the stimuli in each session.
Figure 2.
Figure 2.. Learning curve of Experiment 1: lines graph show the percentage of correct choices for each archerfish in a 3 vs 6 training, grouped by numerosity rewarded (three or six dots).
Learning criterion (blue dotted line) was reached after two consecutive sessions ≥75%. The red dotted line refers to chance level.
Figure 2—figure supplement 1.
Figure 2—figure supplement 1.. Performance data for each non-numerical control condition at training in Experiment 1.
Type of choices 0 and 1 corresponds to uncorrect and correct choices, respectively (training data refer to the last two training sessions, when learning criterion was reached).
Figure 3.
Figure 3.. Percentage of choice for the larger/smaller set (mean ± standard error of the mean [SEM]) in the comparison tests for the two groups trained to select the smaller (3) or larger (6) set.
Coloured dots represent the individual performance for each fish.
Figure 3—figure supplement 1.
Figure 3—figure supplement 1.. Individual performance data for each non-numerical control condition at test in Experiment 1.
Type of choices A and R corresponds to choices for absolute and relative numerosity.
Figure 4.
Figure 4.. Learning curves of Experiment 2: the lines show the percentage of correct choices for each archerfish in a 2 vs 3 training.
Learning criterion (blue dotted line) was reached after two consecutive sessions ≥75%. The red dotted line refers to chance level.
Figure 4—figure supplement 1.
Figure 4—figure supplement 1.. Performance data for each non-numerical control condition at training in Experiment 2.
Type of choices 0 and 1 corresponds to uncorrect and correct choices, respectively (training data refer to the last two training sessions, when learning criterion was reached).
Figure 5.
Figure 5.. Percentage of choice for the larger set (mean ± standard error of the mean [SEM]) in the comparison test set of Experiment 2.
Coloured dots represent the individual performance for each fish.
Figure 5—figure supplement 1.
Figure 5—figure supplement 1.. Individual performance data for each non-numerical control condition at test in Experiment 1.
Type of choices A and R corresponds to choices for absolute and relative numerosity.
Figure 6.
Figure 6.. The graphs report the choices for the larger numerosity depending on the different levels of congruency: graphs are reported both for the training phase (mean data of the last two sessions when the criterion was reached) and the test phase, for both Experiments 1 and 2.
In Experiment 1, data are grouped by training condition (circles for fish trained with three dots, triangles for fish trained with six dots). Coloured points represent single fish performance with standard error bars (i.e. data are mediated over trials with the same congruency level, per each fish), while black points represent the overall mean (i.e. data are mediated over all the trials with the same congruency level). Red dotted lines represent chance levels.
Figure 7.
Figure 7.. The histograms (on the left) show the spatial frequency (total power) for each numerical comparison among the different control groups (non-numerical variables control).
The different constraints applied to the stimuli (control of the area, perimeter, or elements radius) showed to influence the spatial frequency between the two compared numerosities. The regression lines (on the right) show the correlation between fish’ performance accuracy (choice for the relative numerosity) and the spatial frequency (total power index between the two total power values), for all numerical comparisons. The coloured shapes (dots, triangles and squares) correspond to each specific control condition.
Figure 8.
Figure 8.. Experimental setup.
(a) Schematic representation of the experimental apparatus. (b) Bottom view of the tank from the camera placed below the tank’s pavement.

References

    1. Abramson JZ, Hernández-Lloreda V, Call J, Colmenares F. Relative quantity judgments in the beluga whale (Delphinapterus leucas) and the bottlenose dolphin (Tursiops truncatus) Behavioural Processes. 2013;96:11–19. doi: 10.1016/j.beproc.2013.02.006. - DOI - PubMed
    1. Adriano A, Girelli L, Rinaldi L. The ratio effect in visual numerosity comparisons is preserved despite spatial frequency equalisation. Vision Research. 2021;183:41–52. doi: 10.1016/j.visres.2021.01.011. - DOI - PubMed
    1. Agrillo C, Miletto Petrazzini ME, Piffer L, Dadda M, Bisazza A. A new training procedure for studying discrimination learning in fish. Behavioural Brain Research. 2012;230:343–348. doi: 10.1016/j.bbr.2012.02.025. - DOI - PubMed
    1. Agrillo C, Bisazza A. Spontaneous versus trained numerical abilities. A comparison between the two main tools to study numerical competence in non-human animals. Journal of Neuroscience Methods. 2014;234:82–91. doi: 10.1016/j.jneumeth.2014.04.027. - DOI - PubMed
    1. Anderson US, Stoinski TS, Bloomsmith MA, Marr MJ, Smith AD, Maple TL. Relative numerousness judgment and summation in young and old Western lowland gorillas. Journal of Comparative Psychology. 2005;119:285–295. doi: 10.1037/0735-7036.119.3.285. - DOI - PubMed

Publication types