. 2022 Jan 10:11:e74589.
doi: 10.7554/eLife.74589.

Structural and functional properties of a magnesium transporter of the SLC11/NRAMP family

Affiliations

Structural and functional properties of a magnesium transporter of the SLC11/NRAMP family

Karthik Ramanadane et al. Elife. .

Abstract

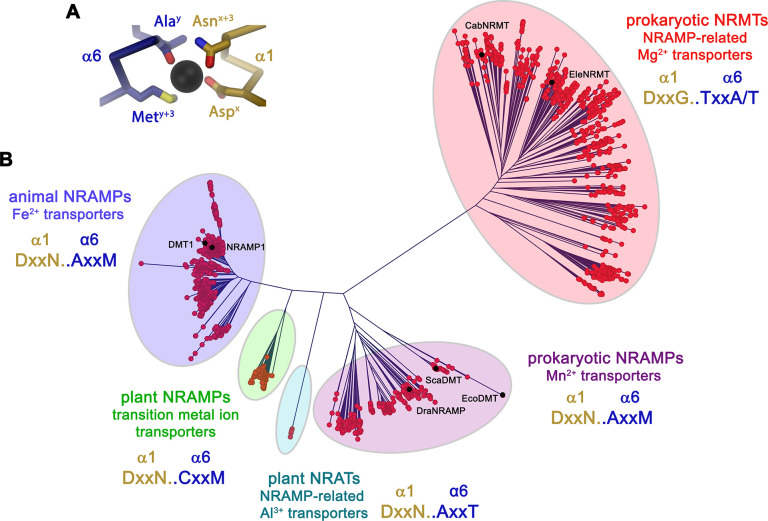
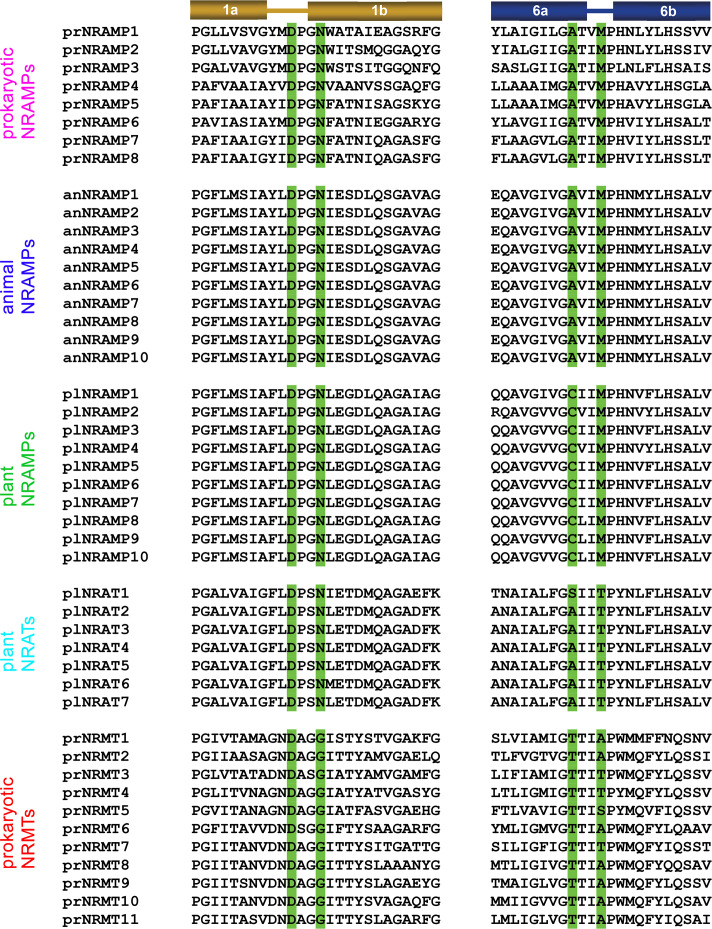
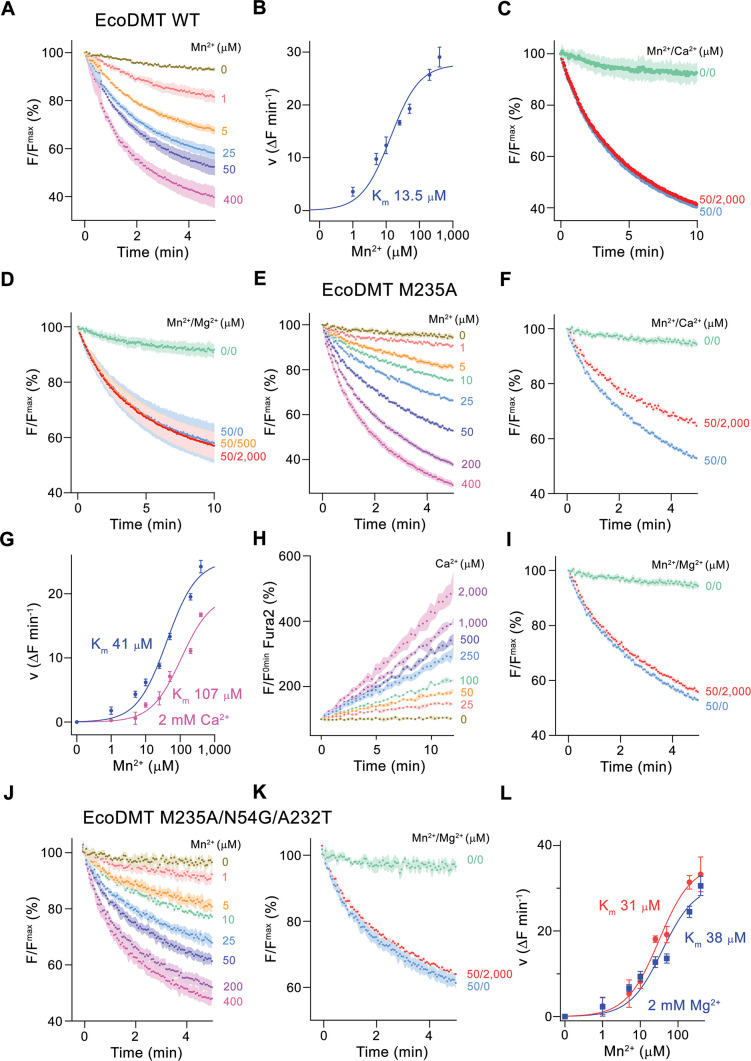
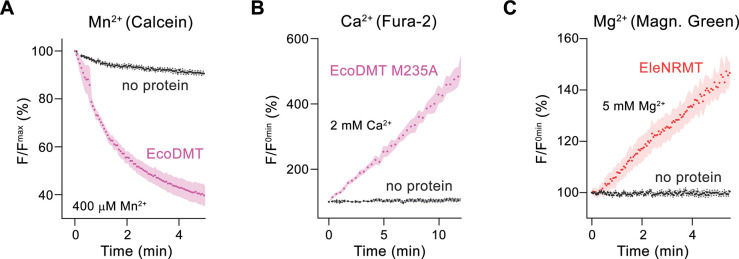
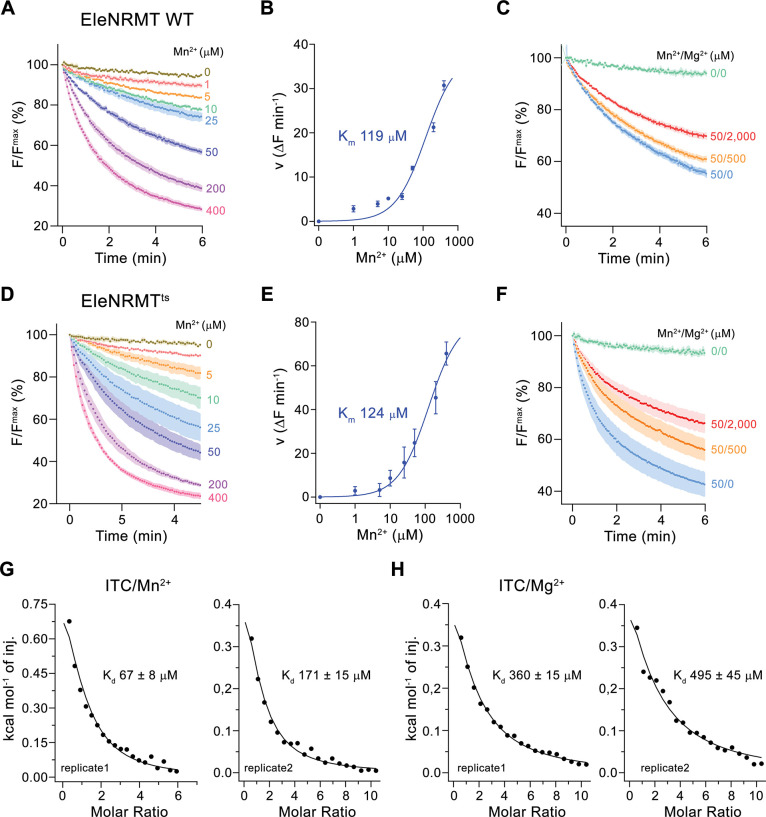
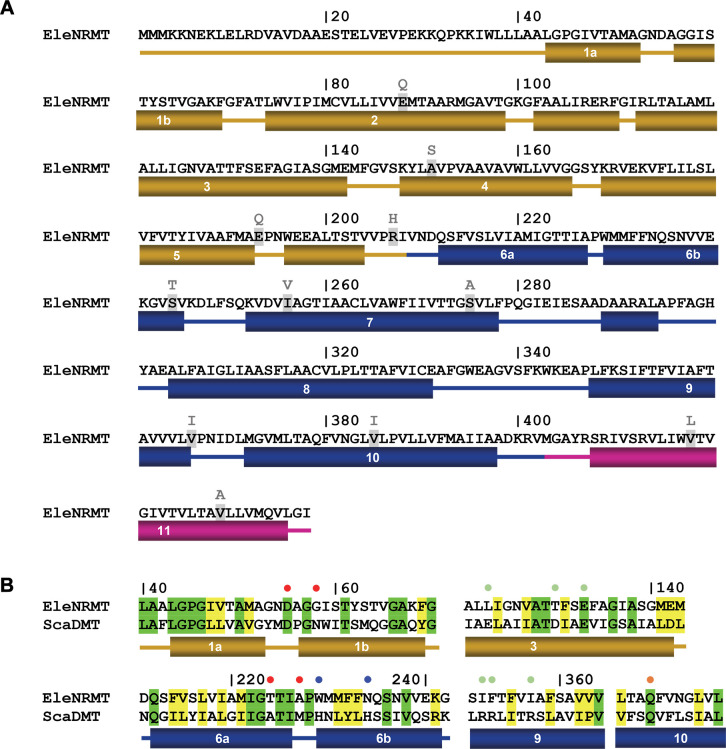
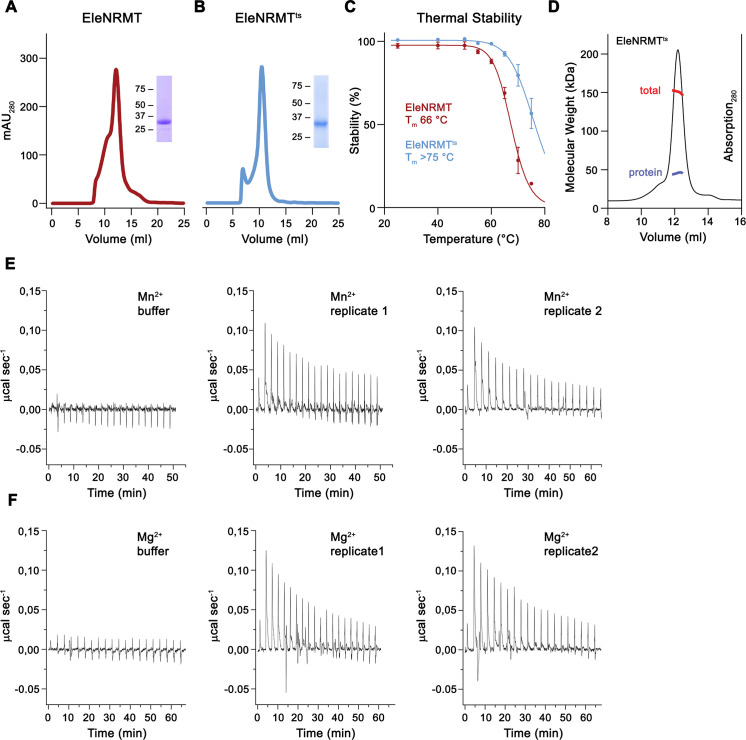
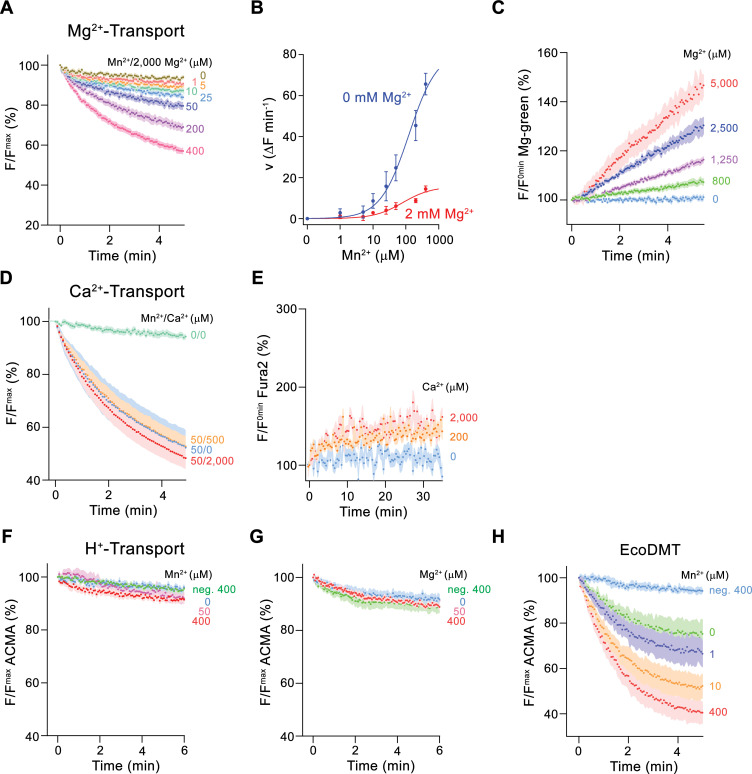
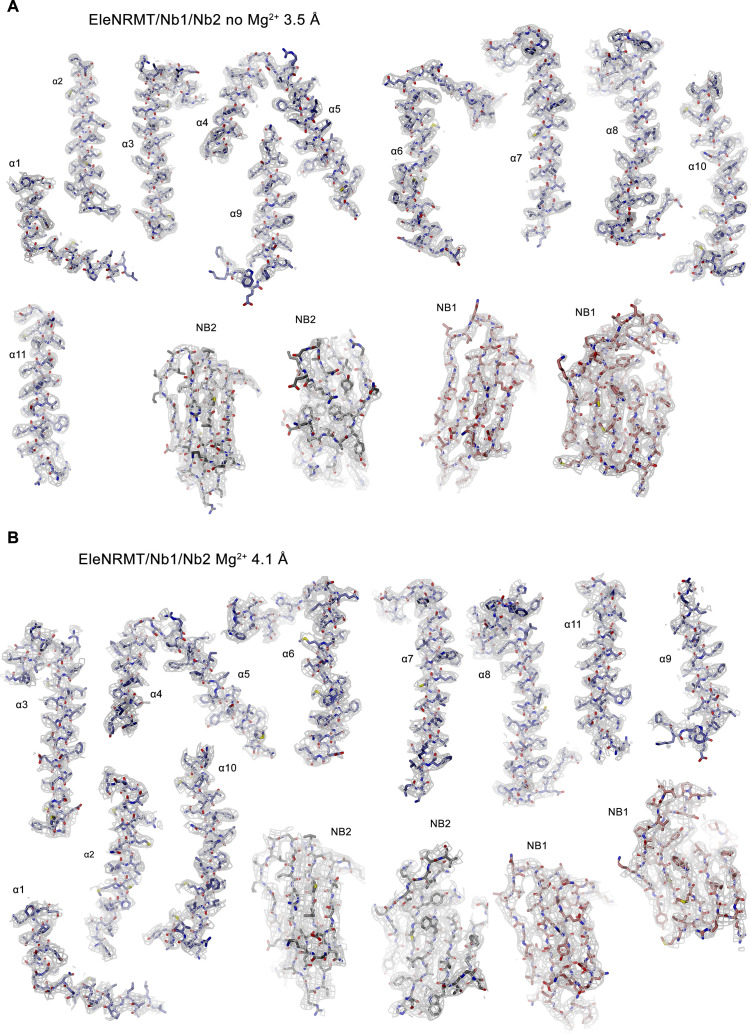
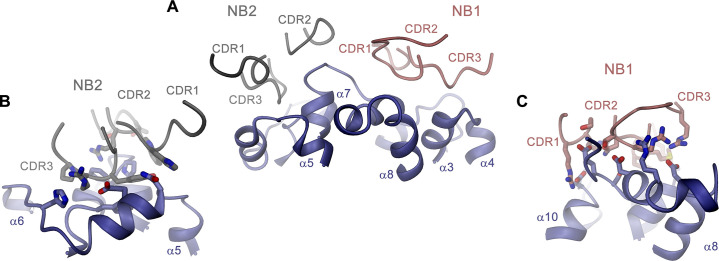
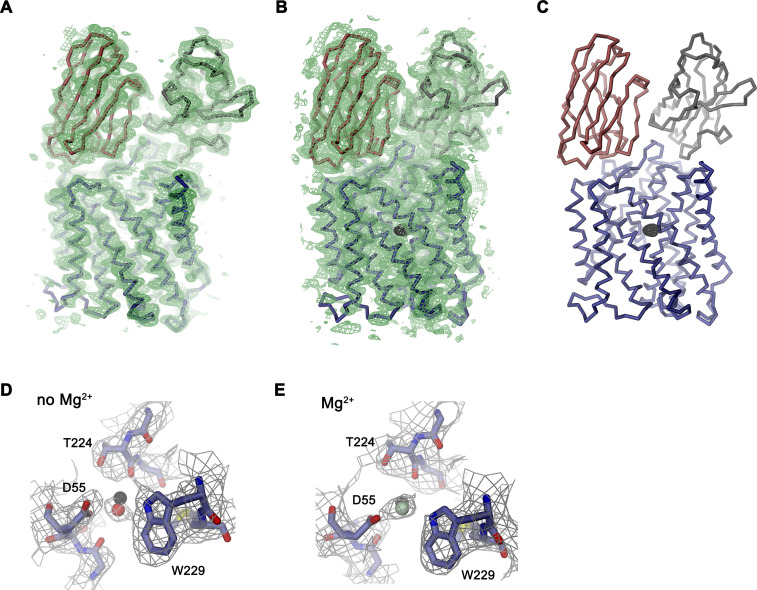
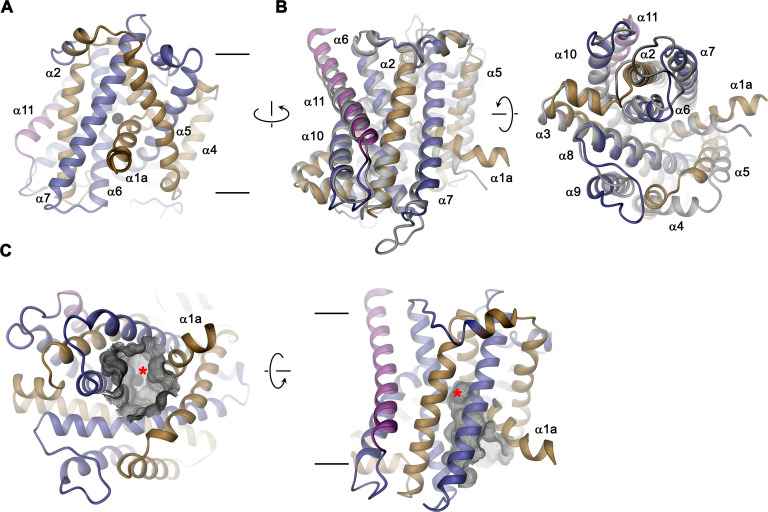
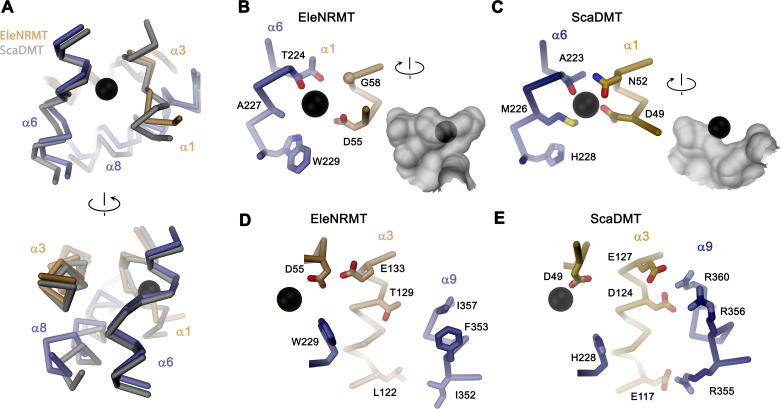
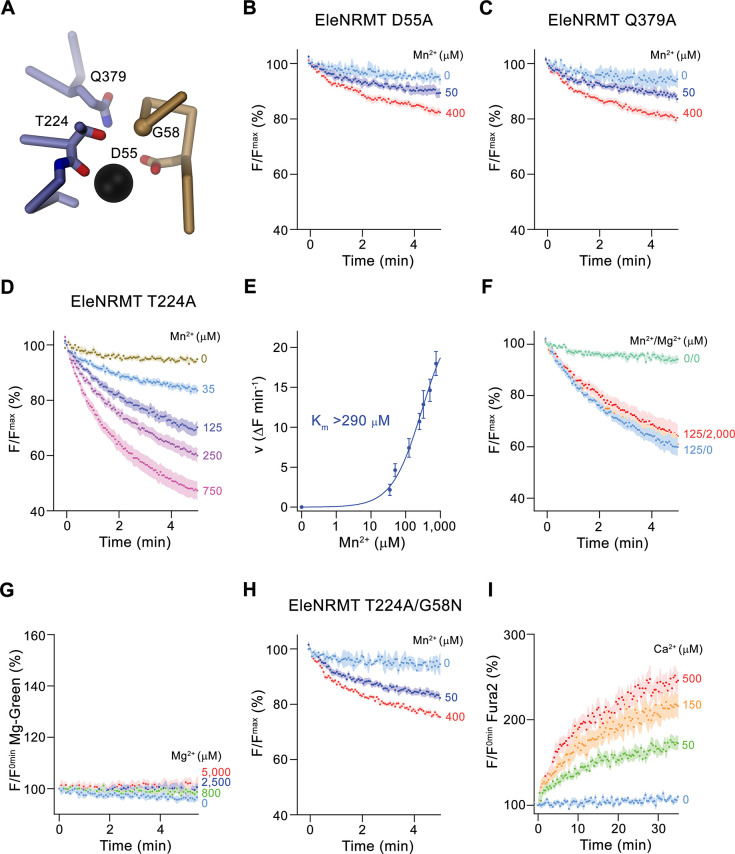
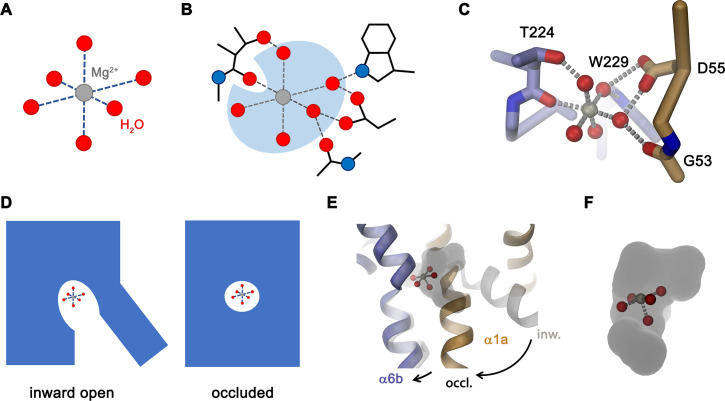
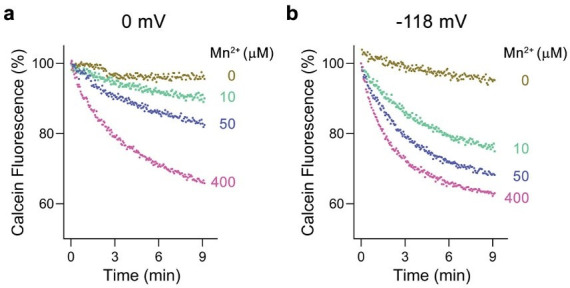
Members of the ubiquitous SLC11/NRAMP family catalyze the uptake of divalent transition metal ions into cells. They have evolved to efficiently select these trace elements from a large pool of Ca2+ and Mg2+, which are both orders of magnitude more abundant, and to concentrate them in the cytoplasm aided by the cotransport of H+ serving as energy source. In the present study, we have characterized a member of a distant clade of the family found in prokaryotes, termed NRMTs, that were proposed to function as transporters of Mg2+. The protein transports Mg2+ and Mn2+ but not Ca2+ by a mechanism that is not coupled to H+. Structures determined by cryo-EM and X-ray crystallography revealed a generally similar protein architecture compared to classical NRAMPs, with a restructured ion binding site whose increased volume provides suitable interactions with ions that likely have retained much of their hydration shell.

Keywords: cryo-EM; isothermal titration calorimetry; magnesium transport; molecular biophysics; structural biology; transport assays; x-ray crystallogrpahy.


Conflict of interest statement

KR, MS, RD, CM No competing interests declared

Figures

Figure 1.
Figure 1.. Phylogenetic analysis of the SLC11/NRAMP family.
(A) Model of the consensus ion binding site of NRAMP transporters as obtained from the X-ray structure of ScaDMT (PDBID 5M95) in complex with Mn2+. Regions of α1 and α6 are shown as Cα-trace, selected residues coordinating the ion as sticks. (B) Phylogenetic tree of SLC11 residues with different clades of the family highlighted. Selected family members are indicated. The consensus sequence of the respective ion binding site of each clade is shown.
Figure 1—figure supplement 1.
Figure 1—figure supplement 1.. Sequence alignment of selected protein regions of SLC11 family members.
Residues constituting the ion binding site are highlighted in green. Secondary structure elements are indicated on the top. Prokaryotic NRAMPSs (prNRAMP): 1 D. radiodurans (Uniprot: Q9RTP8), 2 S. capitis (Uniprot: A0A4U9TNH6), 3 E. coelocola (Uniprot: E4KPW4), 4 E. coli (UniProt: sp|P0A769|MNTH_ECOLI), 5 M. tuberculosis (UniProt: sp|P9WIZ5|MNTH_MYCTU), 6 B. subtilis (UniProt: sp|P96593|MNTH_BACSU), 7 S. typhimurium (Uniprot: sp|Q9RPF4|MNTH_SALTY), 8 P. aeruginosa (Uniprot: sp|Q9RPF3|MNTH1_PSEAE). Animal NRAMPs (anNRAMP): 1 H. sapiens NRAMP2 (NCBI: NP_001366375.1), 2 P. paniscus NRAMP2 (NCBI: XP_008949491.1), 3 C. sabaeus NRAMP2 (NCBI: XP_037853046.1), 4 R. roxellana NRAMP2 (NCBI: XP_010383634.1), 5 M. mulatta NRAMP2 (NCBI: EHH20731.1), 6 E. caballus NRAMP2 (NCBI: XP_023499318.1), 7 C. canadensis NRAMP2 (NCBI: XP_020035491.1), 8 H. hyaena NRAMP2 (NCBI: XP_039097283.1), 9 C. ferus NRAMP2 (NCBI: XP_032348726.1), 10 B. indicus NRAMP2 (NCBI: XP_019816126.1). Plant NRAMPs (plNRAMP): 1 P. vulgaris (NCBI: XP_007155869.1), 2T. subterraneum (NCBI: GAU12542.1), 3 G. max (NCBI: NP_001344702.1), 4 C. arietinum (NCBI: XP_004511877.1), 5 D. chrysotoxum (NCBI: KAH0462125), 6T. cacao (NCBI: XP_007047433.1), 7 V. unguiculata (NCBI: XP_027914252.1), 8 G. soja (NCBI: KAG4933418.1), 9 M. truncatula (NCBI: XP_003611648.1), 10 A. annua (NCBI: PWA53748.1). Plant NRATs (plNRAT): 1 O. sativa (NCBI: XP_015625418.1), 2 D. oligosanthes (NCBI: OEL35611.1), 3 S. italica (NCBI: XP_004952002.1), 4 S. bicolor (NCBI: XP_002451480.2), 5 P. miliaceum (NCBI: RLM80353.1), 6 P. virgatum (NCBI: XP_039819678.1), 7 Z. mays (NCBI: PWZ19830.1). Prokaryotic NRMTs (prNRMT): 1 P. propionicus (NCBI: WP_011735082.1), 2 M. australiensis (NCBI: WP_013780282.1), 3 C. saccharolyticus (NCBI: WP_011916762.1), 4 A. bacterium (NCBI: PYS45348.1), 5 G. bemidjiensis (NCBI: WP_012531668.1), 6T. narugense (NCBI: PMP85905.1), 7 C. acetobutylicum (NCBI: WP_034583260.1), 8 M. paludicola (NCBI: BAI61876.1), 9 S. aciditrophicus (NCBI: WP_011418107.1), 10 S. usitatus (NCBI: WP_011688372.1), 11 E. laentae (NCBI: WP_009305646.1).
Figure 2.
Figure 2.. Functional characterization of EcoDMT mutants.
(A) EcoDMT-mediated Mn2+ transport into proteoliposomes. Data display mean of three experiments from three independent reconstitutions. (B) Mn2+ concentration dependence of transport. Initial velocities were derived from individual traces of experiments displayed in (A), the solid line shows the fit to a Michaelis–Menten equation with an apparent Km of 13.5  μM. (C) Mn2+ transport in presence of Ca2+. Data display mean of seven experiments from two independent reconstitutions, except for the measurement without divalent ions (0/0, green, mean of two experiments). (D) Mn2+ transport into EcoDMT proteoliposomes in presence of Mg2+. Data display mean of 3 (0/0, green), 4 (50/0, blue) and nine experiments (50/500, orange and 50/2000, red) from three independent reconstitutions. (E) Mn2+ transport into proteoliposomes containing the EcoDMT mutant M235A. Data display mean of eight experiments from three independent reconstitutions. (F) Inhibition of Mn2+ transport in the mutant M235A by Ca2+ (3 experiments from three independent reconstitutions). (G) Mn2+ concentration dependence of transport into M235A proteoliposomes. For Mn2+, initial velocities were derived from individual traces of experiments displayed in (E), for Mn2+ in presence of 2 mM Ca2+, data show mean of three experiments from three independent reconstitutions. The solid lines are fits to a Michaelis–Menten equation with apparent Km of 41  μM (Mn2+) and 107 uM (Mn2+ in presence of 2 mM Ca2+). (H) Ca2+-transport into M235A proteoliposomes assayed with the fluorophore Fura-2. Data display mean of tree experiments from three independent reconstitutions. (I) Mn2+ transport in presence of Mg2+. Data display mean of 6 experiments from three independent reconstitutions. (J) Mn2+ transport into proteoliposomes containing the EcoDMT triple mutant M235A/N54G/A232T. Data display mean of three experiments from three independent reconstitutions. (K) Inhibition of Mn2+ transport in the mutant M235A/N54G/A232T by Mg2+ (six experiments from three independent reconstitutions). (L) Mn2+ concentration dependence of transport into M235A/N54G/A232T proteoliposomes. For Mn2+, initial velocities were derived from individual traces of experiments displayed in (J), for Mn2+ in presence of 2 mM Mg2+, data show mean of three (without Mg2+, red) and six experiments (with Mg2+, blue) from three independent reconstitutions. The solid lines are fits to a Michaelis–Menten equation with apparent Km of 31  μM (Mn2+) and 38 µM (Mn2+ in presence of 2 mM Mg2+). (A, C, D, E, F, I, J, K) Uptake of Mn2+ was assayed by the quenching of the fluorophore calcein trapped inside the vesicles. (A, C, D, E, F, H, I, J, K) Averaged traces are presented in unique colors. Fluorescence is normalized to the value after addition of substrate (t = 0). Applied ion concentrations are indicated. (A–L), Data show mean of the indicated number of experiments, errors are s.e.m.
Figure 2—figure supplement 1.
Figure 2—figure supplement 1.. Assay controls.
Non-specific leak into protein-free liposomes in assay conditions used for the detection of different divalent cations. The respective fluorophores are trapped inside the liposomes. (A) Mn2+ transport assayed by the quenching of the fluorophore calcein. (B) Ca2+ transport assayed by the fluorescence increase of the fluorophore Fura-2. (C) Mg2+ transport assayed by the fluorescence increase of the fluorophore Magnesium Green. Traces show experiments at the highest concentration of divalent cations used in the study. The signal of protein-free liposomes (no protein) is shown in gray, the specific transport mediated by the indicated protein constructs is shown for comparison (pink for Mn2+ and Ca2+ red for Mg2+). Dots show mean values of independent replicates (A, no protein n = 12, EcoDMT n = 3; B, no protein n = 13, EcoDMT M235A n = 3; C, no protein n = 13, EleNRMT n = 3) errors are s.e.m.
Figure 3.
Figure 3.. Transport properties of EleNRMT.
(A) EleNRMT mediated Mn2+ transport into proteoliposomes. Data display mean of three experiments from two independent reconstitutions. (B) Mn2+ concentration dependence of transport. Initial velocities were derived from individual traces of experiments displayed in (A), the solid line shows the fit to a Michaelis–Menten equation with an apparent Km of 119  μM. (C) Mn2+ transport in presence of Mg2+. Data display mean of 3 (0/0, green), 6 (50/0, blue), 5 (50/500, orange), and 9 (50/2000, red) experiments from two independent reconstitutions. (D) Mn2+ transport into proteoliposomes mediated by the thermostabilized mutant EleNRMTts. Data display mean of four experiments from two independent reconstitutions, except for the measurement with 25 μM Mn2+ (mean of three experiments). (E) Mn2+ concentration dependence of transport. Initial velocities were derived from individual traces of experiments displayed in (D), the solid line shows the fit to a Michaelis–Menten equation with an apparent Km of 124  μM. (F) Mn2+ transport in presence of Mg2+. Data display mean of 4 (0/0, green), 9 (50/0, blue), 11 (50/500, orange), and 8 (50/2000, red) experiments from two independent reconstitutions. A, C, D, F. Uptake of Mn2+ was assayed by the quenching of the fluorophore calcein trapped inside the vesicles. Averaged traces are presented in unique colors. Fluorescence is normalized to the value after addition of substrate (t = 0). Applied ion concentrations are indicated. (A–F), Data show mean of the indicated number of experiments, errors are s.e.m. (G–H), Binding isotherms obtained from isothermal titrations of Mn2+ (G) and Mg2+ (H) to EleNRMTts. The data shown for two biological replicates per condition was fitted to a model assuming a single binding site with the binding isotherm depicted as solid line. Errors represent fitting errors.
Figure 3—figure supplement 1.
Figure 3—figure supplement 1.. EleNRMT sequence and topology.
(A) Sequence of EleNRMT (NCBI: WP_009305646.1) with secondary structure elements indicated below. Residues mutated in the thermostabilized EleNRMTts are highlighted with replacements shown on top. (B) Comparison of functionally relevant regions of EleNRMT and the Mn2+ transporter ScaDMT (Uniprot: A0A4U9TNH6) with secondary structure elements shown below. Dots indicate ion binding site (red), a residue interacting with the ion in an occluded state (orange) and positions relevant for H+ transport in NRAMPs on α6 (blue) and α3, 9 (green).
Figure 3—figure supplement 2.
Figure 3—figure supplement 2.. Stabilization and biochemical characterization of EleNRMT.
Gel filtration profiles on a Superdex 200 column of WT EleNRMT (A) and the thermostabilized construct of ElenRMTts (B). Insets show SDS-PAGE gel of peak fractions with molecular weight marker indicated (kDa). (C) Thermal stability of EleNRMT and EleNRMTts as determined by fluorescence-based size-exclusion chromatography (Hattori et al., 2012). Data show averages of four technical replicates, errors are s.e.m. (D) SEC/MALS experiment of purified EleNRMTts with obtained molecular weight corresponding to a monomeric transporter (measured molecular weight of 45.6 kDa versus theoretical molecular weight of 46.9 kDa). Thermograms of Mn2+ (E) and Mg2+ (F) binding to EleNRMTts obtained from isothermal titration calorimetry experiments shown in Figure 3G and H. (E, F) Panels show titration against buffer (left) and traces of two biological replicates (center, right).
Figure 4.
Figure 4.. Ion selectivity and substrate coupling.
(A–E) Metal ion transport by EleNRMTts. (A) EleNRMTts mediated Mn2+ transport into proteoliposomes in presence of 2 mM Mg2+. Data display mean of eight experiments from three independent reconstitutions, except for the measurement with 200 μM Mn2+ (mean of seven experiments). (B) Mn2+ concentration dependence of transport into EleNRMTts proteoliposomes. For Mn2+, data are as displayed in Figure 3E, for Mn2+ in presence of 2 mM Mg2+, initial velocities were derived from individual traces of experiments displayed in (A). The solid lines are fits to a Michaelis–Menten equation. (C) Mg2+-transport into EleNRMTts proteoliposomes assayed with the fluorophore Magnesium Green. Data display mean of 5 (0 μM Mg2+), 8 (800 μM and 1250 μM Mg2+), 4 (2500 μM Mg2+), and 3 (5000 μM Mg2+) experiments from two independent reconstitutions. (D) Mn2+ transport in presence of Ca2+. Data display mean of 4–11 experiments from three independent reconstitutions. (A, D) Uptake of Mn2+ was assayed by the quenching of the fluorophore calcein trapped inside the vesicles. (E) Ca2+-transport into EleNRMTts proteoliposomes assayed with the fluorophore Fura-2. Data display mean of 3 (0 μM Ca2+), 12 (200 μM Ca2+) and 9 (2000 μM Ca2+) experiments from 2 independent reconstitutions. The small increase of the fluorescence at high Ca2+ concentrations likely results from non-specific leak into proteoliposomes. (F–H) Assay of H+ transport with the fluorophore ACMA. Experiments probing metal ion coupled H+ transport into proteoliposomes containing EleNRMTts upon addition of Mn2+ (eight experiments from two independent reconstitutions) (F) and Mg2+ (eight experiments from two independent reconstitutions) (H) do not show any indication of H + transport. Mn2+ coupled H+ transport into EcoDMT proteoliposomes (three experiments from three independent reconstitutions and for the negative control [no protein, 400 μM Mn2+], 4 measurements) is shown for comparison (I). A, C-H Averaged traces are presented in unique colors. Fluorescence is normalized to the value after addition of substrate (t = 0). Applied ion concentrations are indicated. (A–H), Data show mean of the indicated number of experiments, errors are s.e.m.
Figure 4—figure supplement 1.
Figure 4—figure supplement 1.. Nanobody selection.
(A) Sequence alignment of the three EleNRMT binders Nb1-Nb3. Secondary structure is shown above. The location of complementary determining regions (CDRs) are indicated, residues in Nb1 and Nb2 making contacts with EleNRMTts are highlighted in green. SEC profiles of purified (B) Nb1, (C) Nb2, and (D) the EleNRMTts-Nb1,2 complex assembled with a stoichiometric excess of both nanobodies. Inset shows SDS-PAGE gel with molecular weights (kDa) indicated.
Figure 5.
Figure 5.. Structural characterization of EleNRMTts by Cryo-EM and X-ray crystallography.
(A) Cryo-EM density (contoured at 5 σ) of EleNRMTts in complex with Nb1 and Nb2 at 3.5 Å viewed from within the membrane with the extracellular side on top and (B), ribbon representation of the complex in the same view. Proteins are shown in unique colors. (C) Anomalous difference density of Mn2+ obtained from the crystal structure of the EleNRMTts-Nb1-Nb2 complex (calculated at 5 Å and displayed as black mesh contoured at 4.5 σ). Model of EleNRMTts encompassing the unwound center of helices α1 and α6 is shown as ribbon.
Figure 5—figure supplement 1.
Figure 5—figure supplement 1.. Cryo-EM reconstruction of the EleNRMTts-nanobody complex.
(A) Representative micrograph (out of a total of 22 117 images) of the complex acquired with a Titan Krios G3i microscope equipped with a K3 camera. (B) 2D class averages of the EleNRMTts-Nb1-Nb2 dataset. (C) Data processing workflow. After extraction and one round of 2D classification, a single ab initio reconstruction with four classes was performed. The particle distribution is indicated in %. The two most promising classes, together with a decoy class were subjected to nine rounds of heterogeneous refinement. Non-uniform (NU) refinement, local CTF-refinement and a second round of NU-refinement with C1 symmetry yielded a map at a resolution of 3.5 Å. (D) Angular distribution of particle orientations. The heatmap displays the number of particles for a given viewing angle. (E) Directional and global FSC plots. The global FSC is shown in black. Dashed line indicates 0.143 cut-off and the resolution at which the FSC curve drops below 0.143 is indicated. The directional FSC curves providing an estimation of anisotropy of the dataset are shown for directions x, y, and z. (F) Final 3D reconstruction of the EleNRMTts-Nb1-Nb2 complex in indicated orientations, colored according to the local resolution, estimated in cryoSPARC v.3.2.0.
Figure 5—figure supplement 2.
Figure 5—figure supplement 2.. Cryo-EM reconstruction of EleNRMTts-nanobody in presence of Mg2+.
(A) Cryo-EM reconstruction of the EleNRMTts-nanobody complex in presence of Mg2+. (A) Representative micrograph (out of a total of 12,427 images) of the complex acquired with a Titan Krios G3i microscope equipped with a K3 camera. (B) 2D class averages of the EleNRMTts-Nb1-Nb2 dataset. (C) Data processing workflow. After extraction and one round of 2D classification, a single ab initio reconstruction with four classes was performed. The particle distribution is indicated in %. The particles from the two most promising classes, together with a decoy class were subjected to 22 rounds of heterogeneous refinement. Non-uniform (NU) refinement, local CTF-refinement and a second round of NU-refinement with C1 symmetry yielded a map at a resolution of 4.1 Å. (D) Angular distribution of particle orientations. The heatmap displays the number of particles for a given viewing angle. (E) Directional and global FSC plots. The global FSC is shown in black. Dashed line indicates 0.143 cut-off and the resolution at which the FSC curve drops below 0.143 is indicated. The directional FSC curves providing an estimation of anisotropy of the dataset are shown for directions x, y, and z. (F) Final 3D reconstruction of the EleNRMTts-Nb1-Nb2 complex in indicated orientations, colored according to the local resolution, estimated in cryoSPARC v.3.2.0.
Figure 5—figure supplement 3.
Figure 5—figure supplement 3.. Cryo-EM densities of EleNRMT-nanobody complexes.
(A) EleNRMTts-nanobody complex in absence of Mg2+ at 3.5 Å. Electron density (contoured at 6σ, gray mesh) is shown superimposed on indicated protein regions. (B) EleNRMTts-nanobody complex in presence of Mg2+ at 4.1 Å. Electron density (contoured at 6σ, gray mesh) is shown superimposed on indicated protein regions.
Figure 5—figure supplement 4.
Figure 5—figure supplement 4.. Nanobody binding interfaces.
(A) Contact region of EleNRMTts and nanobodies Nb1 and Nb2. (B) Binding interface of Nb2. (C) Binding interface of Nb1. (B, C), Side chains of residues mediating binding interactions between the transporter and the nanobodies are displayed as sticks. (A–C) Proteins are shown as ribbons with respective regions labeled.
Figure 5—figure supplement 5.
Figure 5—figure supplement 5.. X-ray structures of EleNRMT-nanobody complexes in presence of Mg2+ and Mn2+ and comparison to cryo-EM structures.
(A) Structure of the EleNRMTts-Nb1-Nb2 complex in Mg2+ at 4.1 Å (B) Structure of the EleNRMTts-Nb1-Nb2 complex soaked in Mn2+ at 4.6 Å. A, B 2Fo-Fc density (contoured at 1 σ) is shown as green mesh superimposed on the model. (B, C), Anomalous difference electron density (calculated at 6 Å and contoured at 4 σ) from the dataset displayed in B is depicted as black mesh. (A-C), shown is one of two complexes in the asymmetric unit as Cα trace with protein chains displayed in unique colors. Phases for 2Fo-Fc and anomalous difference density maps were obtained from molecular replacement using the cryo-EM model improved by constrained minimal refinement. Residual density in the cryo-EM maps of the EleNRMTts-Nb1-Nb2 complex in vicinity to the Mn2+ binding position (indicated by black sphere) in absence (D) and presence of Mg2+ (E). Protein is represented as sticks, water (red) or Mg2+ (green) as spheres. Maps are as displayed in Figure 5—figure supplement 3.
Figure 6.
Figure 6.. EleNRMT structure.
(A) Ribbon representation of EleNRMT viewed from within the membrane with α1-α5 colored in beige, α6- α10 in blue and α11 in magenta. The position of a bound ion is indicated by a black sphere. (B) Superposition of EleNRMT and ScaDMT (based on PDBID:5M94 with modeled α1a), both showing equivalent inward-open conformations. Ribbon representation of ScaDMT is shown in gray, the representation of EleNRMT is as in A. (C) Ribbon representation of EleNRMT with surface of the aqueous cavity leading to the ion binding site displayed as mesh. Left, view from the cytoplasm and, right, from within the membrane. A bound ion is represented by a black sphere whose position is indicated with a red asterisk. A-C Selected helices are labeled. Membrane boundaries (A, C) and relationship between views (A–C) are indicated.
Figure 7.
Figure 7.. Comparison of regions of functional relevance between EleNRMT and ScaDMT.
(A) Superposition of the metal ion binding regions of EleNRMT and ScaDMT (PDBID:5M95). The coloring is as in Figure 6B. The relationship between views is indicated. (B) Metal ion binding sites of EleNRMT (B) and ScaDMT (C). (B, C), inset (right) shows molecular surface surrounding the bound ion with indicated relationship. Whereas the ion in EleNRMT is located inside the aqueous cavity, its location in ScaDMT is outside of the cavity, tightly surrounded by coordinating residues. (D) Region of EleNRMT on α3 and α9 implicated in proton transport in NRAMPs and corresponding region in ScaDMT (E). (D, E) The bound ion with the conserved binding site aspartate on α1 and a residue corresponding to the first α6b histidine in NRAMPs, which was identified as potential H+ acceptor, are shown for reference. (A-E) The proteins are depicted as Cα-trace, selected residues as sticks. The position of bound metal ions is represented as a black sphere. (B-E) Selected secondary structure elements and residues are indicated.
Figure 8.
Figure 8.. Functional characterization of binding site mutants.
(A) Model of the ion binding site of EleNRMT with ion (black sphere) showing bound Mn2+. Regions of α1 and α6 are shown as Cα-trace, selected residues coordinating the ion as sticks. (B–D) Mn2+ transport mediated by EleNRMTts binding site mutants. (B) D55A (2 (0 μM Mn2+), 6 (50 μM Mn2+), and 7 (400 μM Mn2+) experiments from two independent reconstitutions), (C) Q379A (2 (0 μM Mn2+), 6 (50 μM Mn2+), and 7 (400 μM Mn2+) experiments from two independent reconstitutions), (D) T224A (5 experiments from two independent reconstitutions). (E) Mn2+ concentration dependence of transport of T224A. Initial velocities were derived from individual traces of experiments displayed in (D), the solid line shows the fit to a Michaelis–Menten equation with an apparent Km exceeding 290  μM. (F) Mn2+ transport into T224A proteoliposomes in presence of Mg2+ (4 experiments from two independent reconstitutions). (G) Mg2+-transport into T224A proteoliposomes assayed with the fluorophore Magnesium green (4 experiments from two independent reconstitutions). (H-I) Transport mediated by the EleNRMTts binding site mutant T224A/G58N. (H) Mn2+ transport into proteoliposomes containing T224A/G58N (2 (0 μM Mn2+), 6 (50 μM Mn2+), and 7 (400 μM Mn2+) experiments from two independent reconstitutions). (I) Ca2+-transport into T224A/G58N proteoliposomes assayed with the fluorophore Fura-2 (9 (0 μM Ca2+), 10 (50 μM Ca2+), 11 (150 μM Ca2+), and 10 (500 μM Ca2+) experiments from two independent reconstitutions). (B-D), (F- H) Uptake of Mn2+ was assayed by the quenching of the fluorophore calcein trapped inside the vesicles. (B-D), (F-I) Averaged traces are presented in unique colors. Fluorescence is normalized to value after addition of substrate (t = 0). Applied ion concentrations are indicated. (B–I), Data show mean of the indicated number of experiments, errors are s.e.m.
Figure 9.
Figure 9.. Features of Mg2+ transport by NRMTs.
Schematic depiction of (A), the octahedral coordination of the first hydration shell surrounding a Mg2+ ion and (B), the same octahedral coordination within the binding site of a NRMT with five of the six water molecules remaining bound to the ion and where the bulk of protein interactions with the ion are mediated via coordinated water. (C) Model of Mg2+ bound to the site of EleNRMT in the inward-facing conformation. The coordinates of the hydrated Mg2+ were obtained from the high-resolution structure of the Mg2+ transporter MgtE (PDBID 4U9L). The Mg2+ ion was placed on the position of Mn2+ obtained from the anomalous difference density defined in the X-ray structure. A single water molecule with a backbone oxygen atom was removed and the remaining complex was oriented to maximize interactions of coordinating waters with protein residues. Regions of the binding site are represented as Cα-trace and selected interacting residues as sticks. (D) Schematic depiction from an inward-facing to an occluded conformation of a NRMT with bound hydrated Mg2+ indicated. (E) Hypothetical model of the transition of EleNRMT from an inward-facing (gray) to an occluded conformation (colored) that was based on the occluded conformation of DraNRAMP (PDBID: 6C3I). (F) Close-up of the binding pocket of the hypothetical model of the occluded conformation with bound Mg2+–5H2O complex.
Author response image 1.
Author response image 1.. Voltage dependence of Mn2+ transport by EcoDMT.
a, Mn2+ transport assayed at a membrane potential of 0 mV. b, Mn2+ transport assayed at a membrane potential of -118 mV. a, b Mn2+ uptake into proteoliposomes was monitored by the quenching of calcein trapped inside the liposomes. Traces measured with indicated Mn2+ concentrations added to the outside are shown in unique colors.
Author response image 2.
Author response image 2.. Inhibition of EleNRMT mediated Mg2+ transport by Nb1.
a, Mn2+ transport into proteoliposomes containing EleNRMT upon addition of indicated concentrations of Nb1 to the outside. b, Mn2+ transport into proteoliposomes containing EleNRMT upon addition of indicated concentrations of Nb1 added to both sides of the liposome. Partial inhibition reflects the about equal distribution of orientation of EleNRMT within the liposomes.

Similar articles

Cited by

References

    1. Afonine PV, Poon BK, Read RJ, Sobolev OV, Terwilliger TC, Urzhumtsev A, Adams PD. Real-space refinement in PHENIX for cryo-EM and crystallography. Acta Crystallographica. Section D, Structural Biology. 2018;74:531–544. doi: 10.1107/S2059798318006551. - DOI - PMC - PubMed
    1. Bozzi AT, Bane LB, Weihofen WA, McCabe AL, Singharoy A, Chipot CJ, Schulten K, Gaudet R. Conserved methionine dictates substrate preference in Nramp-family divalent metal transporters. PNAS. 2016a;113:10310–10315. doi: 10.1073/pnas.1607734113. - DOI - PMC - PubMed
    1. Bozzi AT, Bane LB, Weihofen WA, Singharoy A, Guillen ER, Ploegh HL, Schulten K, Gaudet R. Crystal Structure and Conformational Change Mechanism of a Bacterial Nramp-Family Divalent Metal Transporter. Structure. 2016b;24:2102–2114. doi: 10.1016/j.str.2016.09.017. - DOI - PMC - PubMed
    1. Bozzi AT, Bane LB, Zimanyi CM, Gaudet R. Unique structural features in an Nramp metal transporter impart substrate-specific proton cotransport and a kinetic bias to favor import. The Journal of General Physiology. 2019a;151:1413–1429. doi: 10.1085/jgp.201912428. - DOI - PMC - PubMed
    1. Bozzi AT, Zimanyi CM, Nicoludis JM, Lee BK, Zhang CH, Gaudet R. Structures in multiple conformations reveal distinct transition metal and proton pathways in an Nramp transporter. eLife. 2019b;8:e41124. doi: 10.7554/eLife.41124. - DOI - PMC - PubMed

Publication types

MeSH terms

LinkOut - more resources