. 2022 Jan 10:11:e69906.
doi: 10.7554/eLife.69906.

RNA N6-methyladenosine modulates endothelial atherogenic responses to disturbed flow in mice

Affiliations

RNA N6-methyladenosine modulates endothelial atherogenic responses to disturbed flow in mice

Bochuan Li et al. Elife. .

Abstract

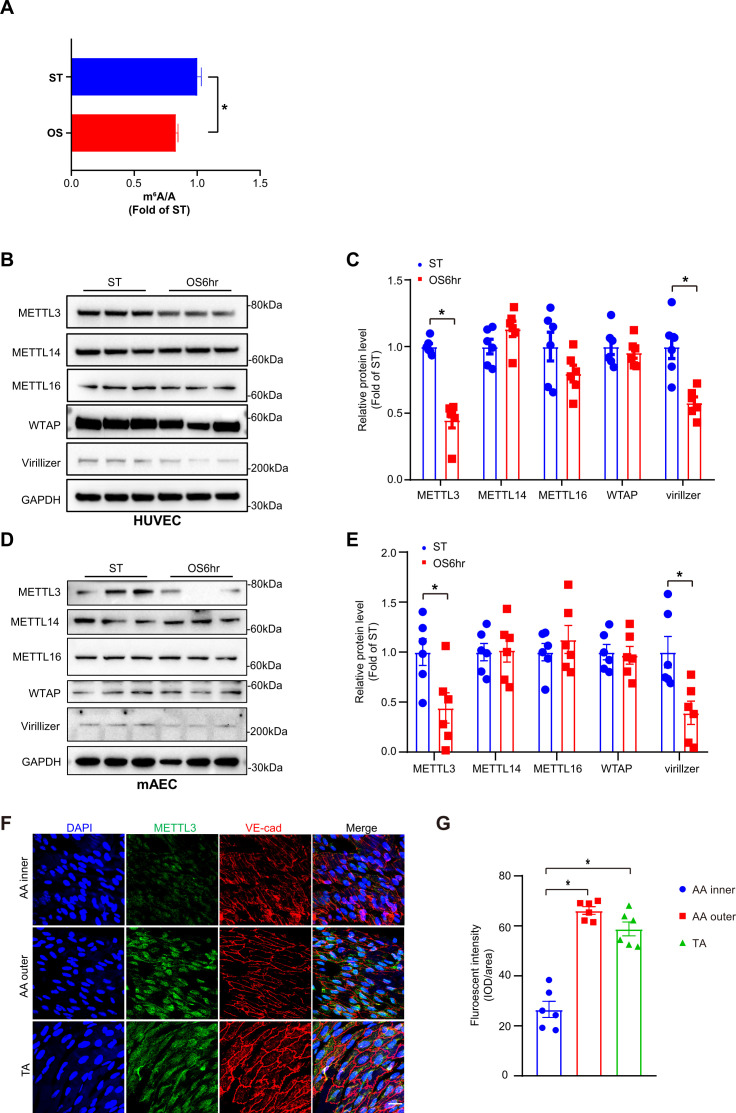
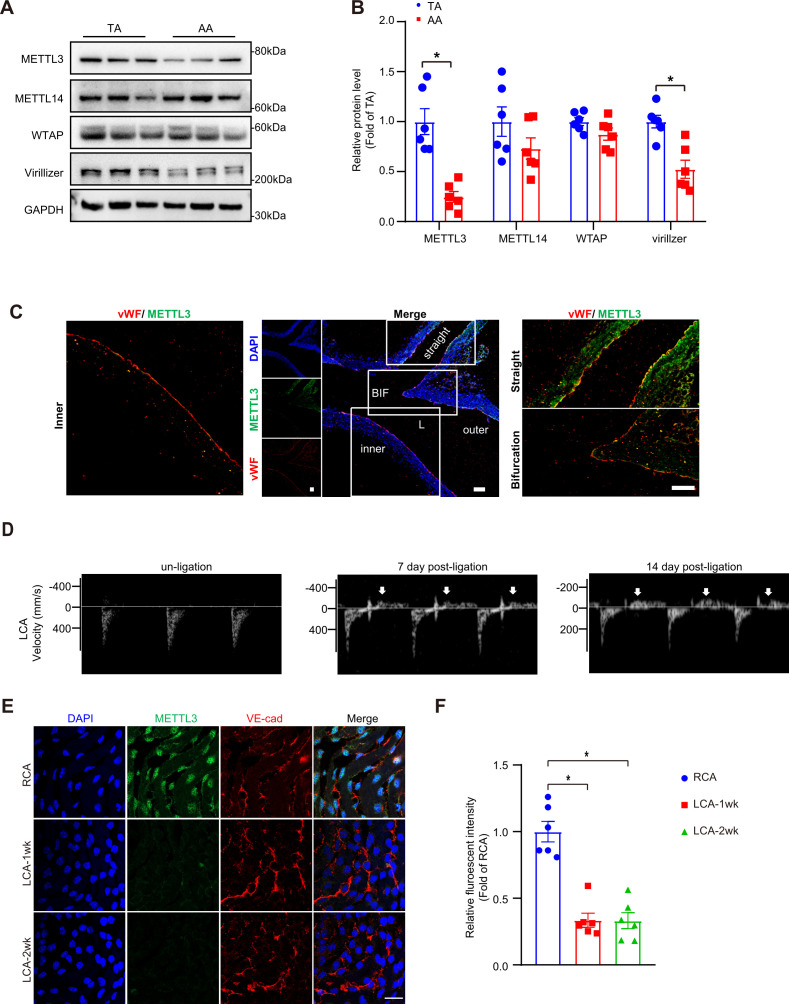
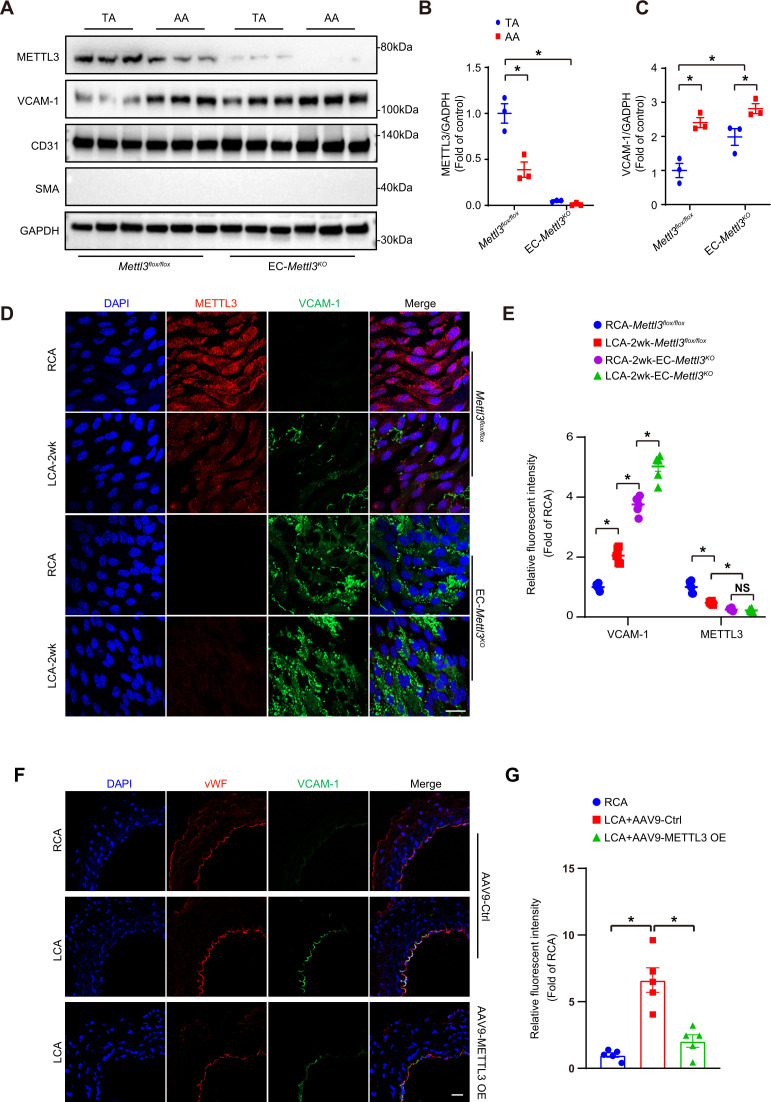
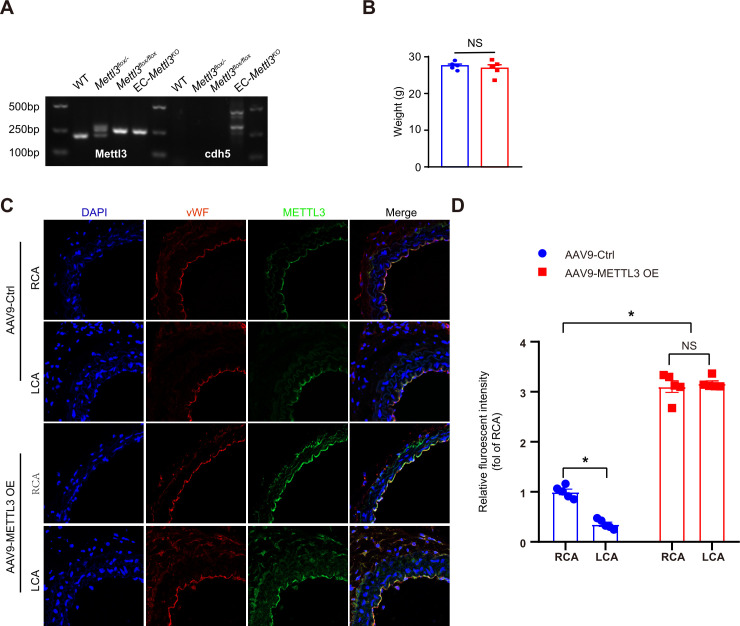
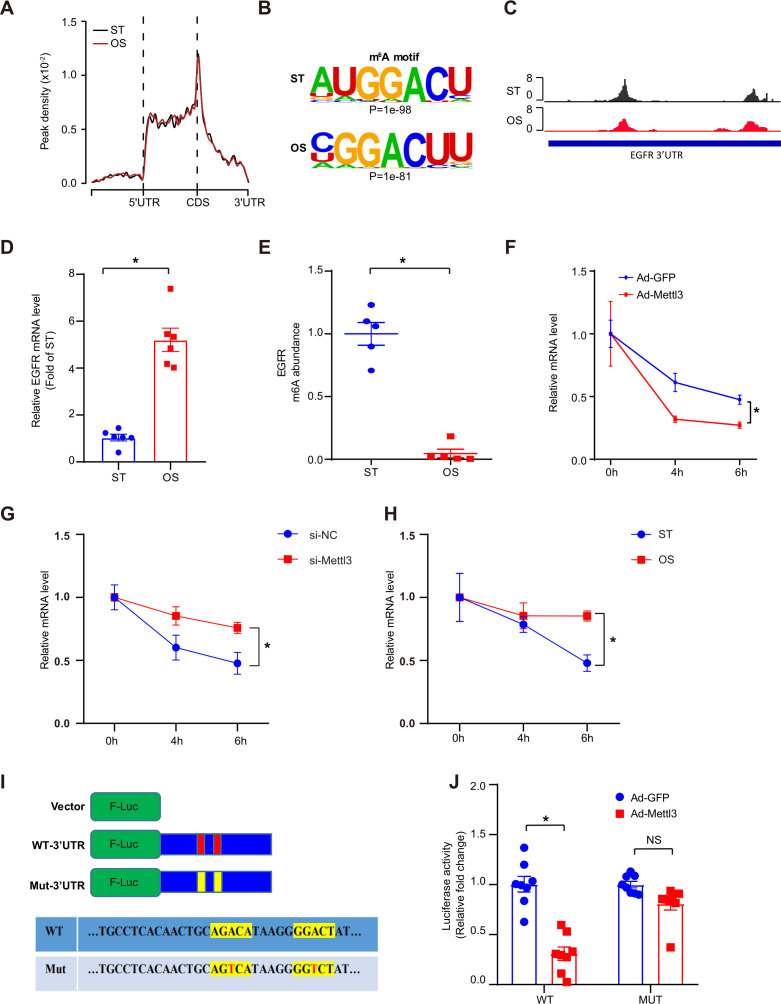
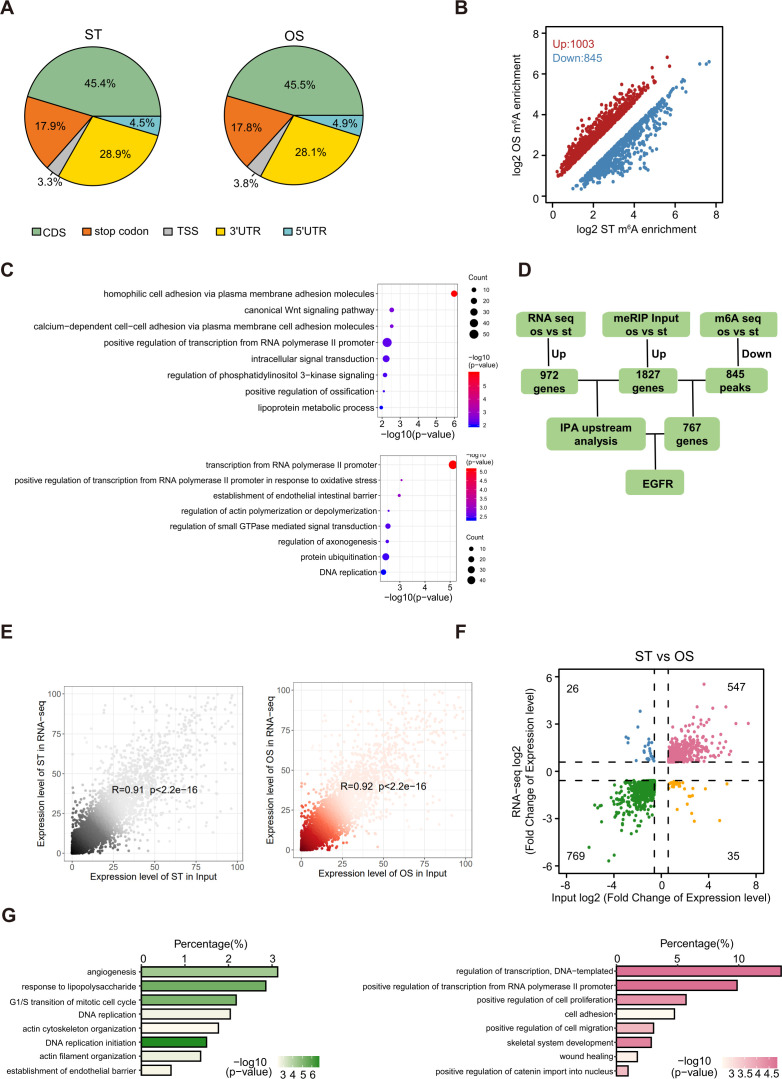
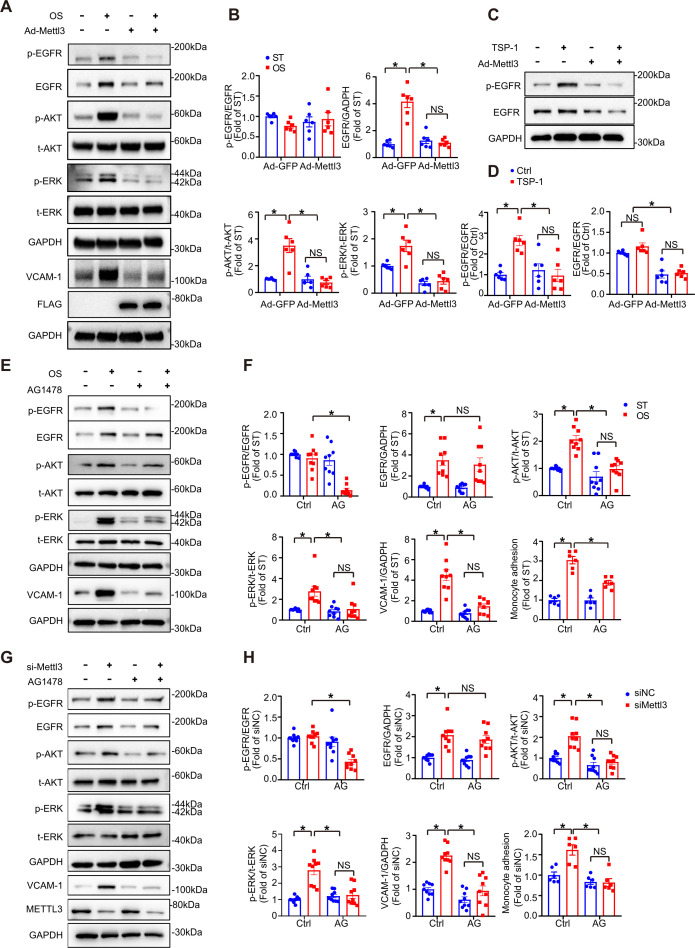
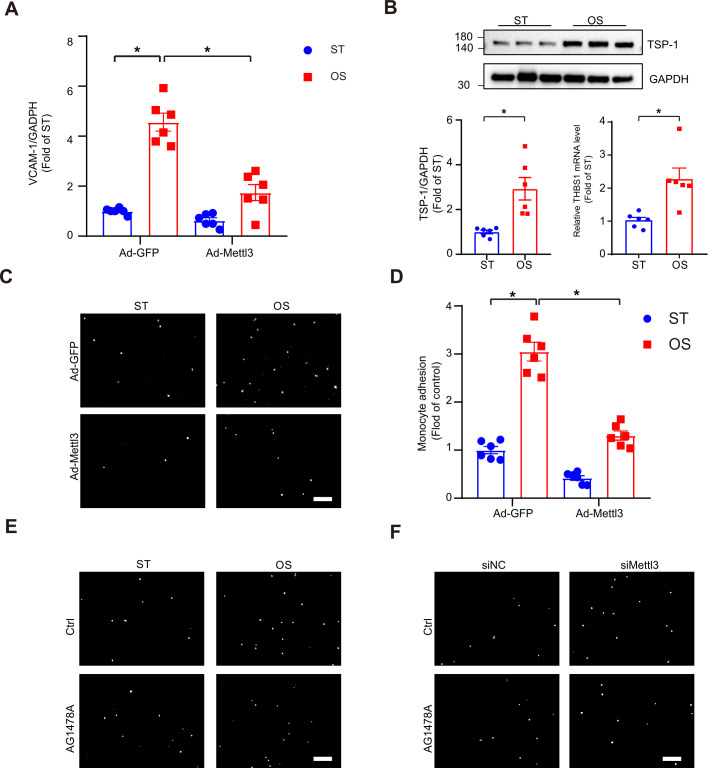
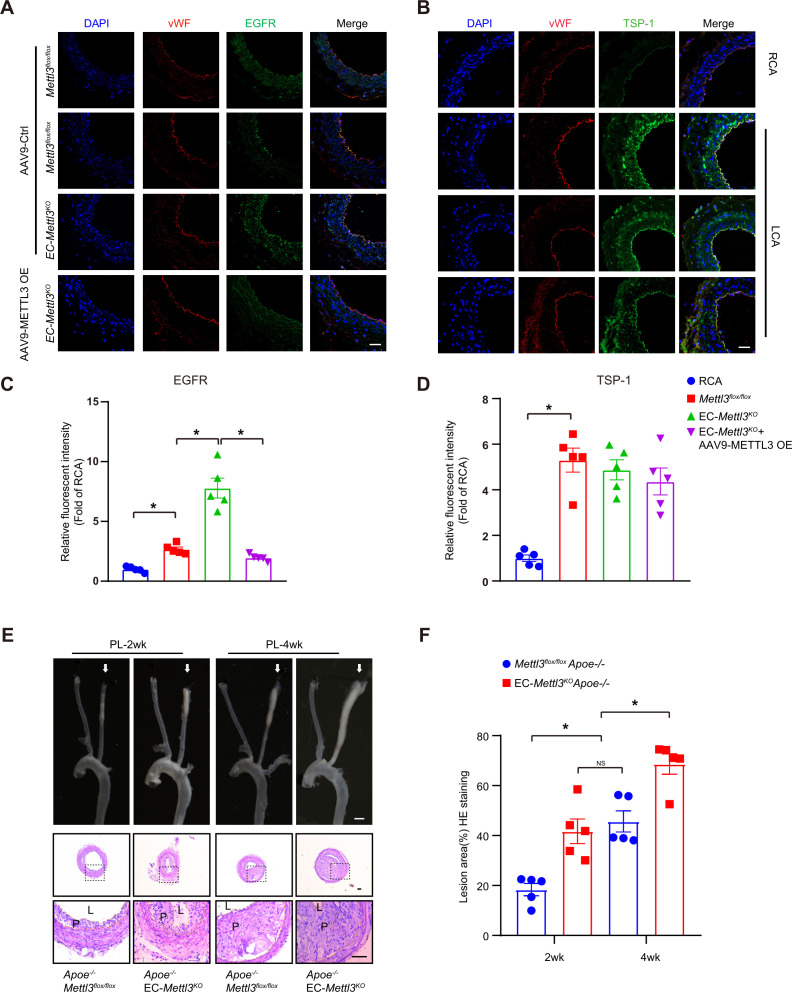
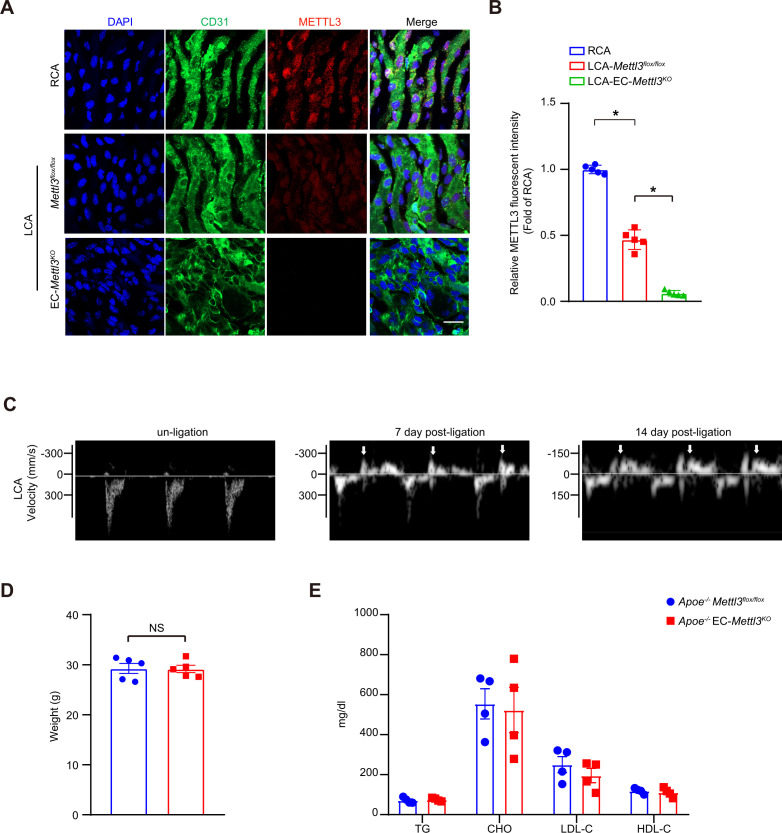
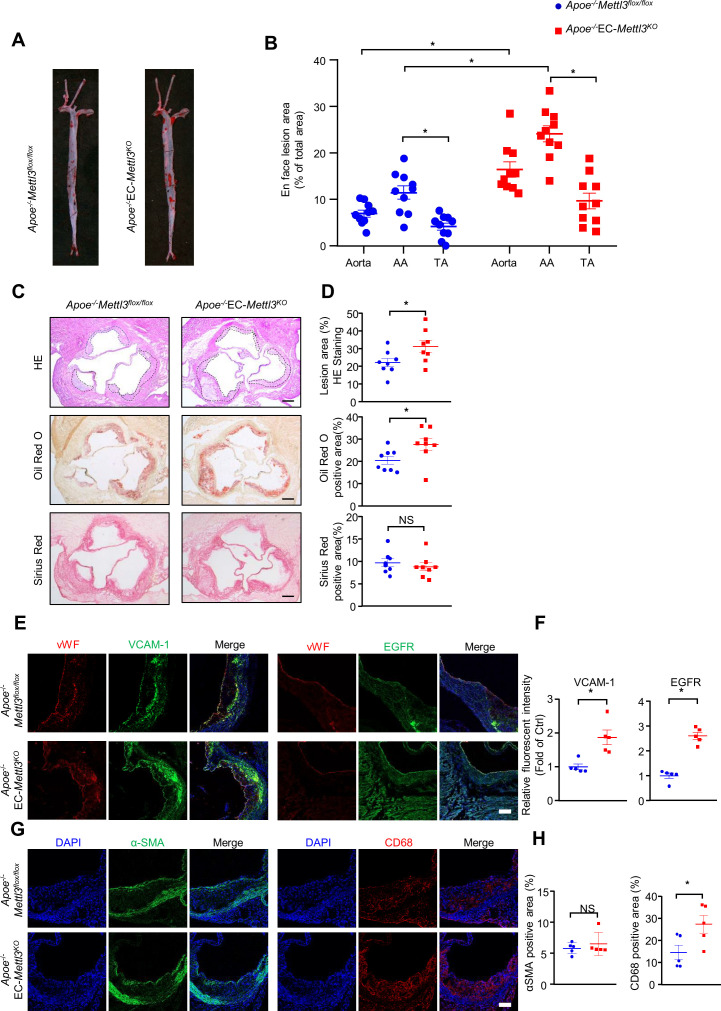
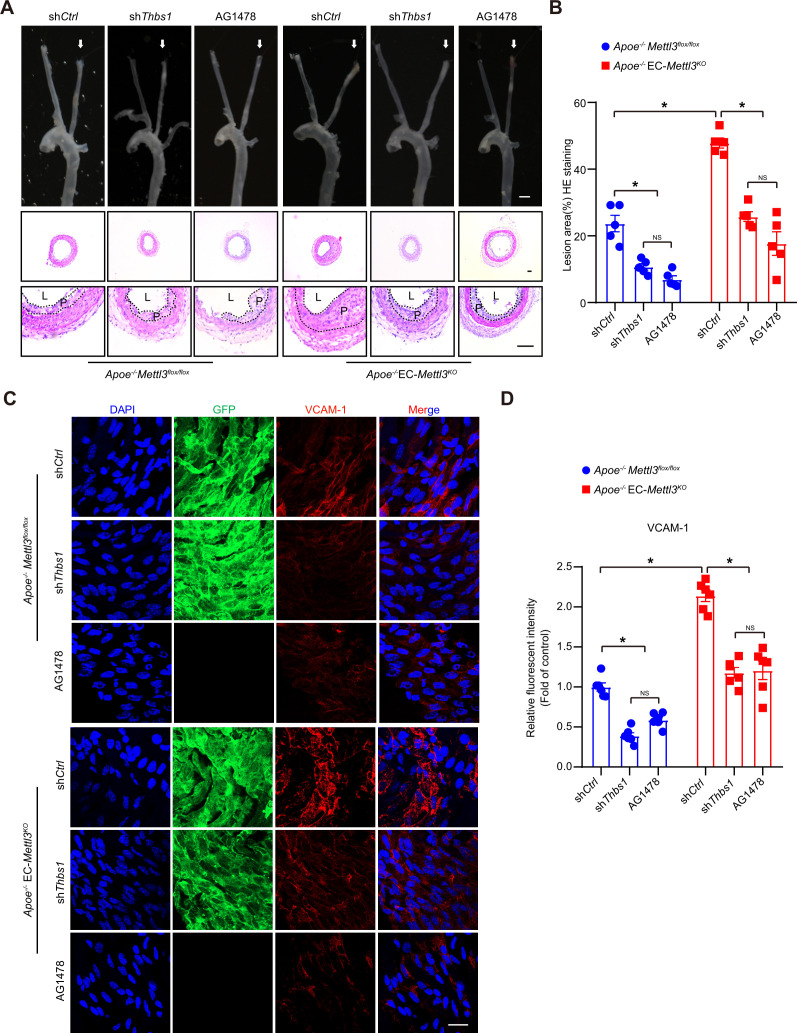
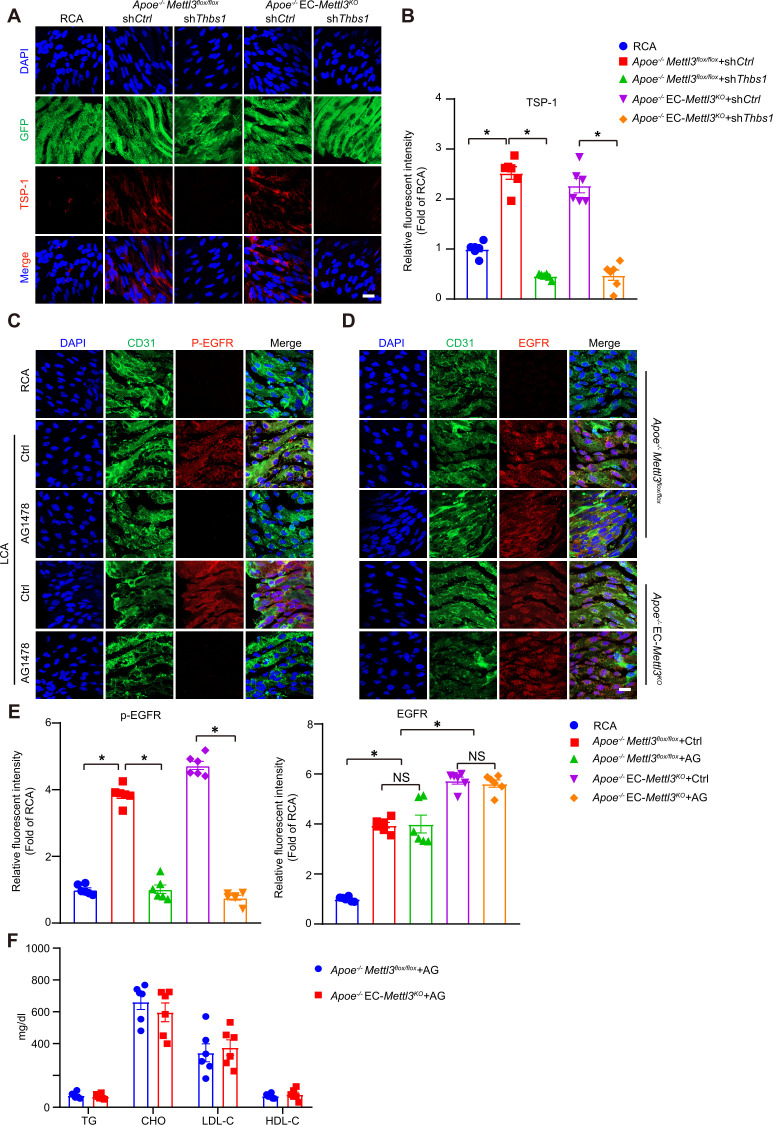
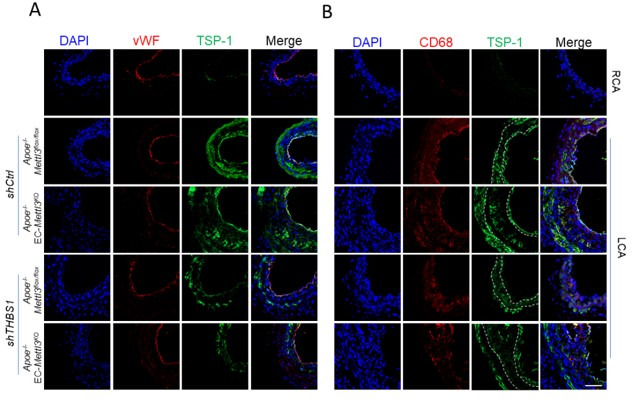
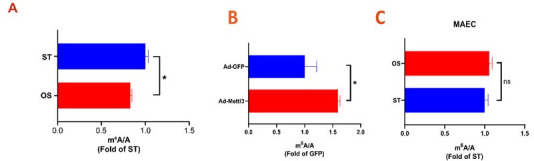
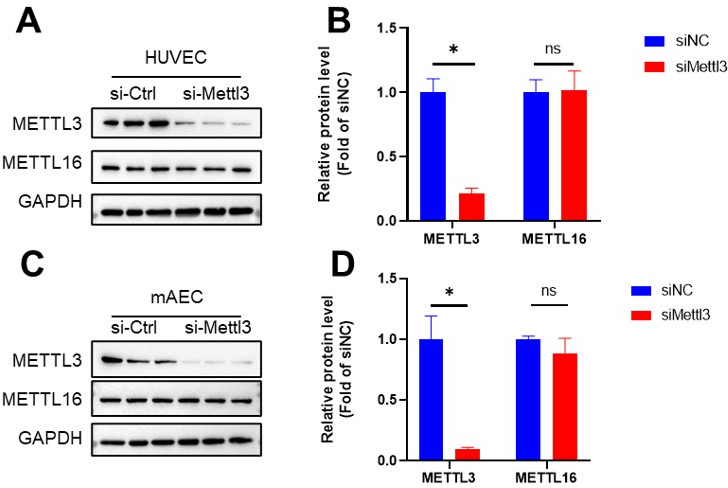
Atherosclerosis preferentially occurs in atheroprone vasculature where human umbilical vein endothelial cells are exposed to disturbed flow. Disturbed flow is associated with vascular inflammation and focal distribution. Recent studies have revealed the involvement of epigenetic regulation in atherosclerosis progression. N6-methyladenosine (m6A) is the most prevalent internal modification of eukaryotic mRNA, but its function in endothelial atherogenic progression remains unclear. Here, we show that m6A mediates the epidermal growth factor receptor (EGFR) signaling pathway during EC activation to regulate the atherosclerotic process. Oscillatory stress (OS) reduced the expression of methyltransferase like 3 (METTL3), the primary m6A methyltransferase. Through m6A sequencing and functional studies, we determined that m6A mediates the mRNA decay of the vascular pathophysiology gene EGFR which leads to EC dysfunction. m6A modification of the EGFR 3' untranslated regions (3'UTR) accelerated its mRNA degradation. Double mutation of the EGFR 3'UTR abolished METTL3-induced luciferase activity. Adenovirus-mediated METTL3 overexpression significantly reduced EGFR activation and endothelial dysfunction in the presence of OS. Furthermore, thrombospondin-1 (TSP-1), an EGFR ligand, was specifically expressed in atheroprone regions without being affected by METTL3. Inhibition of the TSP-1/EGFR axis by using shRNA and AG1478 significantly ameliorated atherogenesis. Overall, our study revealed that METTL3 alleviates endothelial atherogenic progression through m6A-dependent stabilization of EGFR mRNA, highlighting the important role of RNA transcriptomics in atherosclerosis regulation.

Keywords: EGFR; Mettl3; atherosclerosis; cell biology; endothelial cell; immunology; inflammation; mouse.


Conflict of interest statement

BL, TZ, ML, ZC, YZ, ML, YL, YS, ML, YT, YY, HJ, DL No competing interests declared

Figures

Figure 1.
Figure 1.. Methyltransferase like 3 (METTL3)-dependent N6-methyladenosine (m6A) methylation is decreased in atheroprone regions.
Human umbilical vein endothelial cells (HUVECs) and mouse aortic endothelial cells (mAECs) were exposed to OS (0.5 ± 4 dyn/cm2) for 6 hr. Cells with static treatment (ST) were a control. (A) Ultra-high-performance liquid chromatography-triple quadrupole mass spectrometry coupled with multiple-reaction monitoring analysis of m6A levels in mRNAs extracted from HUVECs exposed to ST and OS. Data are shown as the mean ± SEM, *p<0.05, NS, not significant (Student’s t test). n = 3. (B–E) Western blot analysis of METTL3, METTL14, METTL16, Wilms tumor 1-associated protein, and Virillizer expression in HUVECs (B–C) and mAECs (D–E) response to ST and OS. Data are mean ± SEM, *p<0.05 (Student’s t test). n = 6. (F) Aortas from 6- to 8-week-old Apoe-/- mice underwent immunofluorescence staining for indicated proteins. AA inner, inner curvature of aortic arch; AA outer, outer curvature of aortic arch; TA, thoracic aorta. Scale bar, 20 μm. (G) Quantification of protein expression in (F). Data are mean ± SEM, *p<0.05 (one-way ANOVA with Bonferroni multiple comparison post-test). n = 6.
Figure 1—figure supplement 1.
Figure 1—figure supplement 1.. Methyltransferase like 3 (METTL3) is decreased in atheroprone regions.
(A–B) Protein was extracted from the aortic arch (AA) and thoracic aorta (TA) of 8-week-old C57BL/6 mice. (A) Western blot analysis of expression of METTL3, METTL14, Wilms tumor 1-associated protein, Virillizer, and GAPDH (glyceraldehyde-3-phosphate dehydrogenase) in the tissue lysates of AA and TA. (B) Quantification of protein expression in (A). Data are mean ± SEM, *p<0.05 (Student’s t test). n = 6. (C) Aortas from 6- to 8-week-old Apoe-/- mice underwent immunofluorescence staining for indicated proteins. BIF, bifurcation of aortic arch; inner, inner curvature of aortic arch; outer, outer curvature of aortic arch; straight, straight of aorta; L, lumen. Represent images are shown. n = 6. Scale bar, 80 μm. Male Apoe-/- mice underwent partial ligation of the carotid artery for indicated weeks. (D) Ultrasound images showing flow velocity profiles and revealing that partial ligation induces flow reversal (indicated by arrows) in ligated coronary artery (LCA) during diastole. Representative images at 0, 7th and 14th day after surgery were shown. n = 6. (E) Shows enface immunofluorescence staining of the expression of METTL3 in ECs of the carotid artery of mice. Scale bar, 20 μm. (F) Quantification of relative fluorescent intensity of METTL3. Data are mean ± SEM, *p<0.05 (one-way ANOVA with Bonferroni multiple comparison post-test). n = 6.
Figure 2.
Figure 2.. Methyltransferase like 3 (METTL3) deficiency induces endothelial activation in atheroprone regions.
(A–C) Protein was extracted from the AA and TA of 8-week-old EC-Mettl3KO and Mettl3flox/flox mice. (A) Western blot analysis of the expression of METTL3, vascular adhesion molecule (VCAM-1), CD31, SMA (smooth muscle actin), and GAPDH in tissue lysates of AA and TA intima. AA, aortic arch; TA, thoracic aorta. (B–C) Quantification of protein expression in (A). Data are shown as the mean ± SEM, *p<0.05 (two-way ANOVA with Bonferroni multiple comparison post hoc test). Protein extracts of intima from three mice were pooled as one sample, n = 3. (D) EC-Mettl3KO and Mettl3flox/flox mice underwent partial ligation of the carotid artery for 2 weeks. En face immunofluorescence staining for the expression of VCAM-1 and METTL3 in ECs of the carotid artery of mice. Scale bar, 20 μm. (E) Quantification of the relative fluorescence intensity of VCAM-1 and METTL3. Data are shown as the mean ± SEM, *p<0.05 (two-way ANOVA with Bonferroni multiple comparison post hoc test). n = 6 mice. (F) Male mice underwent partial ligation of the carotid artery. During ligation, carotid arteries were infused with the indicated adeno-associated virus. Immunofluorescence staining of VCAM-1 and vWF in ECs of the RCA and LCA of mice. RCA, right carotid artery; LCA, left carotid artery. Scale bar, 20 μm. (G) Quantification of the relative fluorescence intensity of VCAM-1. Data are shown as the mean ± SEM, *p<0.05 (one-way ANOVA with Bonferroni multiple comparison post hoc test). n = 5 mice.
Figure 2—figure supplement 1.
Figure 2—figure supplement 1.. Identification of EC-specific methyltransferase like 3 (Mettl3)-deficient mice.
(A) Genotyping of mice. PCR indicated that tamoxifen-stimulated Cdh5-Cre recombination in tail preparations of mice as follows: wild-type mice and Mettl3flox/-, Mettl3flox/flox, and EC-Mettl3KO mice. (B) Body weight of 8-week-old EC-Mettl3KO and Mettl3flox/flox mice. Data are shown as the mean ± SEM, NS, not significant (Student’s t test). n = 5. (C) Male EC-Mettl3KO mice underwent partial ligation of the carotid artery. During ligation, carotid arteries were infused with the indicated adeno-associated viruses. Immunofluorescence staining for expression of Mettl3 and vWF in ECs of the carotid artery of mice. Scale bar, 20 μm. (D) Quantification of the relative fluorescence intensity of Mettl3. Data are shown as the mean ± SEM, *p<0.05 (Student’s t test). n = 5 mice.
Figure 3.
Figure 3.. Oscillatory stress (OS)-abolished N6-methyladenosine (m6A) prevents epidermal growth factor receptor (EGFR) mRNA degradation.
(A) Distribution of m6A peaks along the 5’ untranslated regions (5’UTR), CDS (coding sequence), and 3’UTR regions of mRNA in static treatment (ST) and OS. (B) m6A motif identified from human umbilical vein endothelial cells (HUVECs) under ST and OS treatments. (C) Integrative genomics viewer tracks displaying the results of IP vs. input read distributions in EGFR 3’UTR mRNA of HUVECs under ST and OS treatments. (D) qPCR analysis of EGFR mRNA levels in ST and OS. Data are shown as the mean ± SEM, *p<0.05 (Student’s t test). n = 6. (E) MeRIP-qPCR detection of m6A enrichment on EGFR mRNA in ST and OS. Data are shown as the mean ± SEM, *p<0.05 (Student’s t test). n = 5. (F–H) qPCR analysis showing delayed EGFR mRNA degradation upon methyltransferase like 3 (Mettl3)-overexpression (F); si-Mettl3 (G); and OS treatment (H). HUVECs were treated with actinomycin D for 4 and 6 hr. Data are shown as the mean ± SEM, *p<0.05 (two-way ANOVA with Bonferroni multiple comparison post hoc test). n = 6. (I) Schematic representation of the mutated (RRACH to RRTCH) 3’ UTR of EGFR plasmids. (J) Relative activity of the wild-type or mutant EGFR 3’UTR firefly luciferase reporter in K293 cells treated with green fluorescent protein (GFP)- or GFP-Mettl3-overexpressing adenovirus. Data are shown as the mean ± SEM, *p<0.05, NS, not significant (Student’s t test). n = 8. RNA-seq and MeRIP-seq data generated in this study have been deposited to the Genome Sequence Archive in BIG Data Center under accession number PRJCA004746.
Figure 3—figure supplement 1.
Figure 3—figure supplement 1.. N6-methyladenosine (m6A) profiling in human umbilical vein endothelial cells treated with static treatment (ST) and oscillatory stress (OS).
(A) Pie charts showing the m6A peak distribution in different RNA regions (CDS, stop codon, TSS (transcriptional start site), 5’ untranslated regions [5′ UTR], 3′ UTR) in ST and OS. (B) Scatter plots showing m6A enrichment of peaks in ST and OS. (C) Bubble diagram showing gene ontology (GO) enrichment analysis of upregulated (up) and downregulated (down) m6A-modified genes in ST and OS. (D) Schematic of m6A downstream analysis. 1.5-fold expression change, p<0.05. (E) Gene expression was highly correlated in RNA-seq and input from MeRIP-seq for both ST and OS conditions. (F) Overlay of differentially expressed genes of RNA-seq and input from ST and OS treatments. (G) GO enrichment analysis of downregulated genes (left) and upregulated genes (right).
Figure 4.
Figure 4.. The thrombospondin-1/epidermal growth factor receptor (TSP-1/EGFR) pathway participates in EC inflammation induced by methyltransferase like 3 (METTL3) inhibition in response to oscillatory stress (OS).
(A) Western blot analysis of p-EGFR, EGFR, p-AKT, t-AKT, p-ERK, t-ERK, FLAG (tag of METTL3), and vascular adhesion molecule 1 (VCAM-1) expression. GAPDH is the protein loading control. Human umbilical vein endothelial cells (HUVECs) were infected with the indicated adenoviruses for 24 hr with or without exposure to OS or static treatment (ST) for another 6 or 12 hr. (B) Quantification of the expression of the indicated proteins in (A). Data are shown as the mean ± SEM, *p<0.05, NS, not significant (two-way ANOVA with Bonferroni multiple comparison post hoc test). n = 6. (C) HUVECs were infected with the indicated adenoviruses for 24 hr with or without TSP-1 (10 µg/ml) treatment. Western blot analysis of p-EGFR, EGFR, and GAPDH. (D) Quantification of the expression of the indicated proteins in (C). Data are shown as the mean ± SEM, *p<0.05, NS, not significant (two-way ANOVA with Bonferroni multiple comparison post hoc test). n = 6. (E) HUVECs were exposed to OS or ST for 6 or 12 hr with or without pretreatment with AG1478 (10 μmol/L). Western blot analysis of p-EGFR, EGFR, p-AKT, t-AKT, p-ERK, t-ERK, VCAM-1, and GAPDH. (F) Quantification of the expression of the indicated proteins in (E). Data are shown as the mean ± SEM, *p<0.05, NS, not significant (two-way ANOVA with Bonferroni multiple comparison post hoc test). n = 9. (G) HUVECs were infected with METTL3 siRNA for 24 hr with or without treatment with AG1478 (10 μmol/L). Western blot analysis of p-EGFR, EGFR, p-AKT, t-AKT, p-ERK, t-ERK, VCAM-1, METTL3, and GAPDH. (H) Quantification of the expression of the indicated proteins in (G). Data are shown as the mean ± SEM, *p<0.05, NS, not significant (two-way ANOVA with Bonferroni multiple comparison posttest). n = 9. THP-1 cells were labeled with fluorescence dye, and then a cell adhesion assay was performed. The number of adherent cells was normalized to that of HUVECs as a control (statistical chart in F, H). Data are shown as the mean ± SEM, *p<0.05, NS, not significant (two-way ANOVA with Bonferroni multiple comparison post hoc test). n = 6.
Figure 4—figure supplement 1.
Figure 4—figure supplement 1.. Thrombospondin-1 (TSP-1) and epidermal growth factor receptor (EGFR) are involved in methyltransferase like 3 (METTL3)-mediated EC dysfunction in response to oscillatory stress (OS).
(A) Quantification of expression of vascular adhesion molecule 1 in human umbilical vein endothelial cells (HUVECs) upon different treatments. Cells were infected with the indicated adenoviruses for 24 hr with or without exposure to oscillatory stress (OS) or static treatment (ST) for another 12 hr. Data are shown as the mean ± SEM, *p<0.05 (two-way ANOVA with Bonferroni multiple comparison post hoc test). n = 6. (B) Western blot analysis of TSP-1 and qPCR analysis of THBS1 mRNA levels in ST and OS conditions. Data are shown as the mean ± SEM, *p<0.05 (Student’s t test). n = 6. (C–F) HUVECs were exposed to the indicated treatments. Representative images of adhesive cells. Scale bar, 500 μm. Cell numbers from five random fields with a 10× objective were counted in each well. The number of adherent cells was normalized to that of HUVECs as a control. Data are shown as the mean ± SEM, *p<0.05 (two-way ANOVA with Bonferroni multiple comparison post hoc test). n = 6.
Figure 5.
Figure 5.. Epidermal growth factor receptor (EGFR) contributes to EC activation in endothelial methyltransferase like 3 (Mettl3)-deficient mice.
(A–B) EC-Mettl3KO and Mettl3flox/flox mice underwent partial ligation of the carotid artery for 2 weeks were infused with the indicated adeno-associated virus. Immunofluorescence staining for expression of EGFR, thrombospondin-1 (TSP-1) in ECs of the carotid artery of mice. Scale bar, 80 μm. (C–D) Quantification of the relative fluorescence intensity of EGFR and TSP-1. Data are shown as the mean ± SEM, *p<0.05 (two-way ANOVA with Bonferroni multiple comparison post hoc test). n = 5 mice. (E) Eight-week-old male Apoe–/–Mettl3flox/flox and Apoe–/– EC-Mettl3KO mice with 2 or 4 weeks of partial ligation were fed a Western-type diet, and arterial tissues were isolated to examine atherosclerotic lesions. Scale bar: 1.5 mm. Ligated coronary arteries were sectioned for hematoxylin-eosin staining. Scale bar: 100 μm. L, lumen; P, plaque. (F) Quantification of lesion area. Data are shown as the mean ± SEM, *p<0.05, NS, not significant (one-way ANOVA with Bonferroni multiple comparison post hoc test). n = 5 mice.
Figure 5—figure supplement 1.
Figure 5—figure supplement 1.. Verification of disturbed flow in the partially ligated left common carotid artery.
(A) EC-Mettl3KO and Mettl3flox/flox mice underwent partial ligation of the carotid artery for 2 weeks. En face immunofluorescence staining of methyltransferase like 3 (METTL3) expression in ECs of the carotid artery of mice. Scale bar, 20 μm. (B) Quantification of the relative fluorescence intensity of METTL3. Data are shown as the mean ± SEM, *p<0.05 (one-way ANOVA with Bonferroni multiple comparison post hoc test). n = 5 mice. (C) Ultrasound images showing flow velocity profiles and revealing that partial ligation induces flow reversal (indicated by arrows) in the ligated coronary artery during diastole. Representative images at 0, 7th and 14th day after surgery are shown. n = 6. (D) Body weight of Apoe–/–Mettl3flox/flox and Apoe–/– EC-Mettl3KO mice. Data are shown as the mean ± SEM, NS, not significant (Student’s t test). n = 5. (E) Plasma levels of TG, CHO, LDL-C, and HDL-C. TG, triglycerides; CHO, total cholesterol; LDL-C, low-density lipoprotein-cholesterol; HDL-C, high-density lipoprotein-cholesterol. Data are shown as the mean ± SEM. n = 4.
Figure 6.
Figure 6.. EC-specific methyltransferase like 3 (METTL3) deficiency accelerates atherogenesis in Apoe-/- mice.
Apoe-/-EC-Mettl3KO and Apoe-/-Mettl3flox/flox mice were fed a Western-type diet for 12 weeks. (A) Oil Red O staining of aortas. (B) Plaque area as a percentage of total area. AA, aortic arch; TA, thoracic aorta. Data are shown as the mean ± SEM, *p<0.05 (two-way ANOVA with Bonferroni multiple comparison post hoc test). n = 10. (C–D) HE, Oil Red O, and Sirius Red immunofluorescence staining of aortic roots. White dashed line indicates the size of plaque. Quantification of plaque size, Oil Red O-positive area in plaque size, Oil Red O-positive area in plaque and collagen fiber (Sirius Red). Data are shown as the mean ± SEM, *p<0.05 (Student’s t test). n = 8. (E and G) Epidermal growth factor receptor (EGFR), vascular adhesion molecule 1 (VCAM-1), vWF, α-SMA, and CD68 immunofluorescence staining of aortic roots. Scale bar, 20 μm. (F and H) Quantification of the relative fluorescence intensity of VCAM-1, EGFR, α-SMA, and CD68. Data are shown as the mean ± SEM, *p<0.05, NS, not significant (Student’s t test). n = 5.
Figure 7.
Figure 7.. Thrombospondin-1/epidermal growth factor receptor (TSP1/EGFR) signaling is involved in atherosclerosis.
(A) An 8-week-old male Apoe–/– Mettl3flox/flox and Apoe–/– EC-Mettl3KO mice with 2 weeks of partial ligation were infused with the indicated lentiviruses or pretreated with AG1478 (AG, 10 mg/kg/day) for 7 days, and arterial tissues were isolated to examine atherosclerotic lesions. Scale bar: 1.5 mm. Ligated coronary arteries (LCAs) were sectioned for hematoxylin-eosin (H&E) staining. Scale bar: 100 μm. L, lumen; P, plaque. (B) Quantification of lesion area. Data are shown as the mean ± SEM, *p<0.05, NS, not significant (two-way ANOVA with Bonferroni multiple comparison post hoc test). n = 5 mice. (C) Apoe–/– Mettl3flox/flox and Apoe–/– EC-Mettl3KO mice with 2 weeks of partial ligation were infused with the indicated lentiviruses or pretreated with AG1478 (AG, 10 mg/kg/day) for 7 days. En face immunofluorescence staining of the expression of vascular adhesion molecule (VCAM-1) in ECs of the carotid artery of mice. Scale bar, 20 μm. (D) Quantification of the relative fluorescence intensity of VCAM-1. Data are shown as the mean ± SEM, *p<0.05, NS, not significant (two-way ANOVA with Bonferroni multiple comparison post hoc test). n = 6.
Figure 7—figure supplement 1.
Figure 7—figure supplement 1.. AG1478 decreases phosphorylation of epidermal growth factor receptor (EGFR) induced by oscillatory stress.
(A–B) EC-Mettl3KO and Mettl3flox/flox mice underwent partial ligation of the carotid artery for 2 weeks. During ligation, carotid arteries were infused with the indicated lentiviruses. En face GFP and immunofluorescence staining of the expression of thrombospondin-1 (TSP-1). Scale bar, 20 μm. (B) Quantification of the relative fluorescence intensity of TSP-1. Data are shown as the mean ± SEM, *p<0.05 (one-way ANOVA with Bonferroni multiple comparison post hoc test). n = 6. (C–D) Apoe–/–Mettl3flox/flox and Apoe–/– EC-Mettl3KO mice with 2 weeks of partial ligation were infused with the indicated lentiviruses or pretreated with AG1478 (AG, 10 mg/kg/day) for 7 days. En face immunofluorescence staining of the expression of p-EGFR and EGFR in ECs of the carotid artery of mice. Scale bar, 20 μm. (E) Quantification of the relative fluorescence intensity of p-EGFR and EGFR. Data are shown as the mean ± SEM, *p<0.05, NS, not significant (two-way ANOVA with Bonferroni multiple comparison post hoc test). n = 6. (F) Plasma levels of TG, CHO, LDL-C, and HDL-C. TG, triglycerides; CHO, total cholesterol; LDL-C, low-density lipoprotein-cholesterol; HDL-C, high-density lipoprotein-cholesterol. Data are expressed as the mean ± SEM. n = 6.
Author response image 1.
Author response image 1.. TSP1 participates in endothelial atherogenic responses to disturbed flow.
(A-B) 8-week-old male Apoe–/– Mettl3flox/flox and Apoe–/– EC-Mettl3KO mice with 2 weeks of partial ligation were infused with the indicated lentiviruses, and arterial tissue cross sections immunofluorescence staining of the expression of TSP-1 in ECs (vWF) and macrophages (CD68) of the carotid artery of mice. Scale bar, 80 μm.
Author response image 2.
Author response image 2.. .
(A-C) UHPLC-MRM-MS analysis of m6A levels in mRNA extracted from HUVECs (A) and mAECs (C) exposed to ST and OS, and infected with the indicated adenoviruses (B). Data are shown as the mean ± SEM, *p<0.05, ns, not significant (Student’s t test). n=3.
Author response image 3.
Author response image 3.. METTL16 remains unchanged upon Mettl3 knockdown.
HUVECs and mAECs were infected with METTL3 siRNA for 24 hr, Western blot analysis of METTL3, METTL16 and GAPDH. (B and D) Quantification of the expression of the indicated proteins in (A and C). Data are shown as the mean ± SEM, *p<0.05, NS, not significant (Student’s t test). n=6.

Similar articles

Cited by

References

    1. Aguilo F, Zhang F, Sancho A, Fidalgo M, Di Cecilia S, Vashisht A, Lee D-F, Chen C-H, Rengasamy M, Andino B, Jahouh F, Roman A, Krig SR, Wang R, Zhang W, Wohlschlegel JA, Wang J, Walsh MJ. Coordination of m(6)A mRNA Methylation and Gene Transcription by ZFP217 Regulates Pluripotency and Reprogramming. Cell Stem Cell. 2015;17:689–704. doi: 10.1016/j.stem.2015.09.005. - DOI - PMC - PubMed
    1. Chen T, Hao Y-J, Zhang Y, Li M-M, Wang M, Han W, Wu Y, Lv Y, Hao J, Wang L, Li A, Yang Y, Jin K-X, Zhao X, Li Y, Ping X-L, Lai W-Y, Wu L-G, Jiang G, Wang H-L, Sang L, Wang X-J, Yang Y-G, Zhou Q. m(6)A RNA methylation is regulated by microRNAs and promotes reprogramming to pluripotency. Cell Stem Cell. 2015;16:289–301. doi: 10.1016/j.stem.2015.01.016. - DOI - PubMed
    1. Chien CS, Li JYS, Chien Y, Wang ML, Yarmishyn AA, Tsai PH, Juan CC, Nguyen P, Cheng HM, Huo TI, Chiou SH, Chien S. METTL3-dependent N6-methyladenosine RNA modification mediates the atherogenic inflammatory cascades in vascular endothelium. PNAS. 2021;118:e2025070118. doi: 10.1073/pnas.2025070118. - DOI - PMC - PubMed
    1. Csányi G, Yao M, Rodríguez AI, Al Ghouleh I, Sharifi-Sanjani M, Frazziano G, Huang X, Kelley EE, Isenberg JS, Pagano PJ. Thrombospondin-1 regulates blood flow via CD47 receptor-mediated activation of NADPH oxidase 1. Arteriosclerosis, Thrombosis, and Vascular Biology. 2012;32:2966–2973. doi: 10.1161/ATVBAHA.112.300031. - DOI - PMC - PubMed
    1. Davies PF. Hemodynamic shear stress and the endothelium in cardiovascular pathophysiology. Nature Clinical Practice. Cardiovascular Medicine. 2009;6:16–26. doi: 10.1038/ncpcardio1397. - DOI - PMC - PubMed

Publication types