

Network analysis of host-pathogen protein interactions in microbe induced cardiovascular diseases
- PMID: 35001887
- PMCID: PMC8842779
- DOI: 10.3233/ISB-210238
Network analysis of host-pathogen protein interactions in microbe induced cardiovascular diseases
Abstract
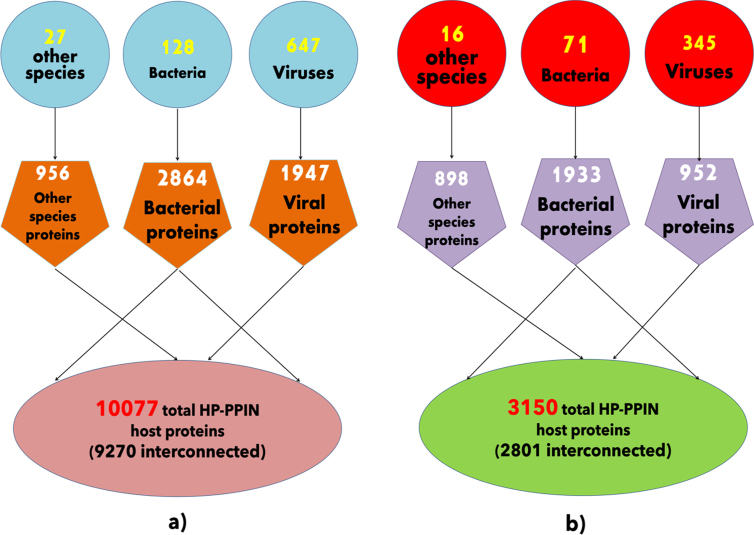
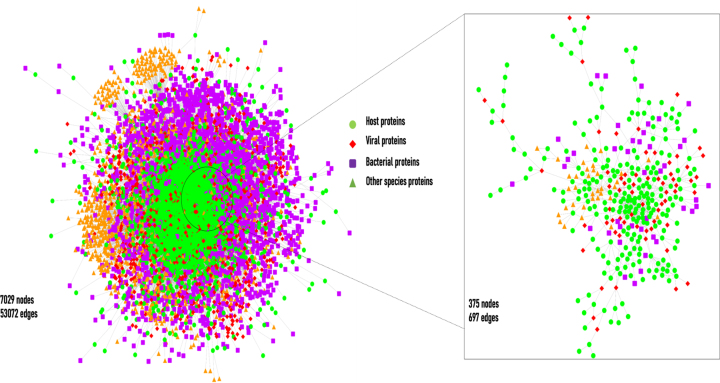
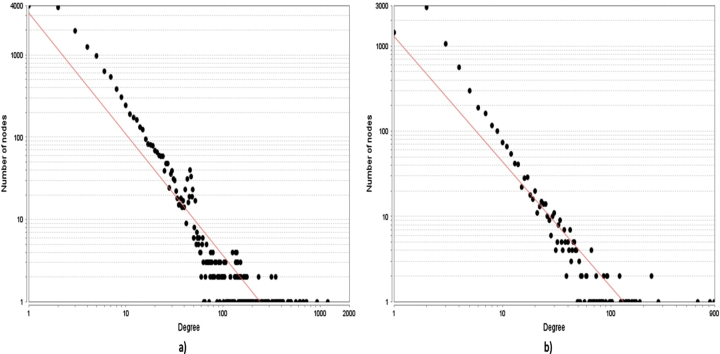
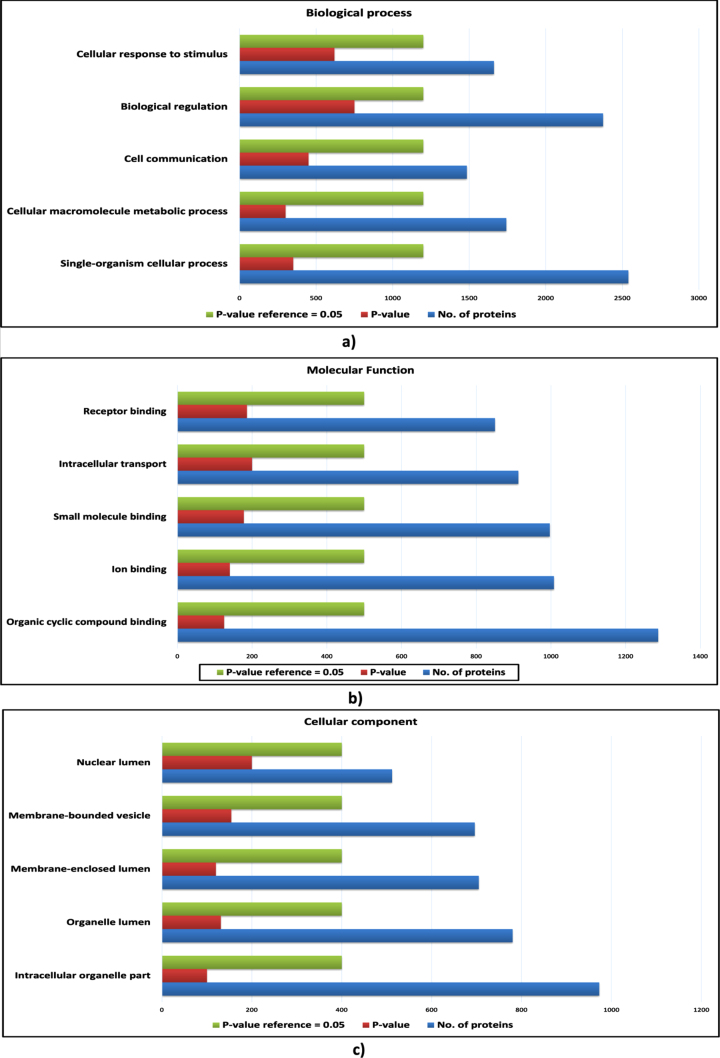
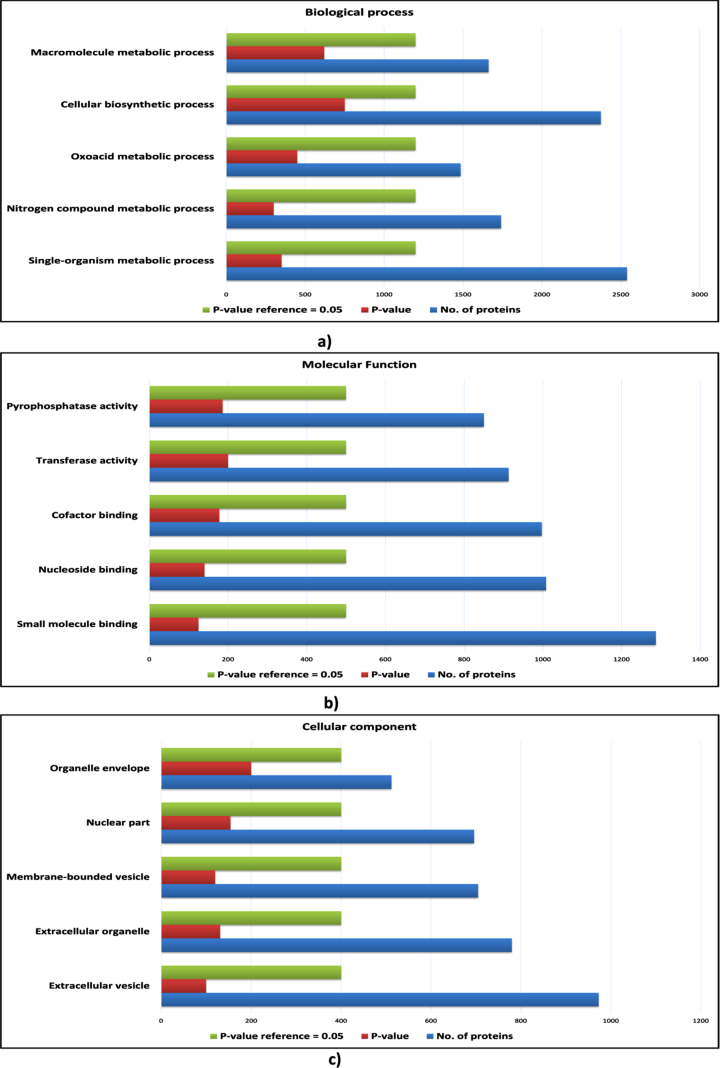
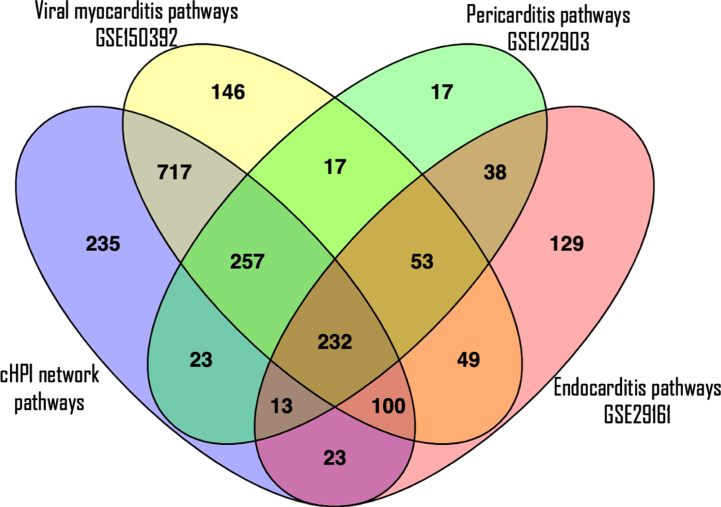
Large-scale visualization and analysis of HPIs involved in microbial CVDs can provide crucial insights into the mechanisms of pathogenicity. The comparison of CVD associated HPIs with the entire set of HPIs can identify the pathways specific to CVDs. Therefore, topological properties of HPI networks in CVDs and all pathogens was studied using Cytoscape3.5.1. Ontology and pathway analysis were done using KOBAS 3.0. HPIs of Papilloma, Herpes, Influenza A virus as well as Yersinia pestis and Bacillus anthracis among bacteria were predominant in the whole (wHPI) and the CVD specific (cHPI) network. The central viral and secretory bacterial proteins were predicted virulent. The central viral proteins had higher number of interactions with host proteins in comparison with bacteria. Major fraction of central and essential host proteins interacts with central viral proteins. Alpha-synuclein, Ubiquitin ribosomal proteins, TATA-box-binding protein, and Polyubiquitin-C &B proteins were the top interacting proteins specific to CVDs. Signaling by NGF, Fc epsilon receptor, EGFR and ubiquitin mediated proteolysis were among the top enriched CVD specific pathways. DEXDc and HELICc were enriched host mimicry domains that may help in hijacking of cellular machinery by pathogens. This study provides a system level understanding of cardiac damage in microbe induced CVDs.
Keywords: HP-PPIs; Network; central; immune; pathway.
Figures
Similar articles
-
In silico prediction of host-pathogen protein interactions in melioidosis pathogen Burkholderia pseudomallei and human reveals novel virulence factors and their targets.Brief Bioinform. 2021 May 20;22(3):bbz162. doi: 10.1093/bib/bbz162. Brief Bioinform. 2021. PMID: 32444871
-
Deep-HPI-pred: An R-Shiny applet for network-based classification and prediction of Host-Pathogen protein-protein interactions.Comput Struct Biotechnol J. 2023 Dec 15;23:316-329. doi: 10.1016/j.csbj.2023.12.010. eCollection 2024 Dec. Comput Struct Biotechnol J. 2023. PMID: 38192372 Free PMC article.
-
MorCVD: A Unified Database for Host-Pathogen Protein-Protein Interactions of Cardiovascular Diseases Related to Microbes.Sci Rep. 2019 Mar 11;9(1):4039. doi: 10.1038/s41598-019-40704-5. Sci Rep. 2019. PMID: 30858555 Free PMC article.
-
Hijacking Factor H for Complement Immune Evasion.Front Immunol. 2021 Feb 25;12:602277. doi: 10.3389/fimmu.2021.602277. eCollection 2021. Front Immunol. 2021. PMID: 33717083 Free PMC article. Review.
-
Antigen presentation and the ubiquitin-proteasome system in host-pathogen interactions.Adv Immunol. 2006;92:225-305. doi: 10.1016/S0065-2776(06)92006-9. Adv Immunol. 2006. PMID: 17145306 Free PMC article. Review.
Cited by
-
Analysis of stress response in multiple bacterial pathogens using a network biology approach.Sci Rep. 2025 May 2;15(1):15342. doi: 10.1038/s41598-025-91269-5. Sci Rep. 2025. PMID: 40316612 Free PMC article.
References
-
- Pezacki J.P., Taking Aim at Host–Pathogen Interactions, ACS Infectious Diseases 2(11) (2016), 744–745. - PubMed
-
- Zhou H., Jin J. and Wong L., Progress in computational studies of host-pathogen interactions, J Bioinform Comput Biol 11(2) (2013), 1230001. - PubMed
-
- Libby P., Egan D. and Skarlatos S., Roles of infectious agents in atherosclerosis and restenosis: an assessment of the evidence and need for future research, Circulation 96(11) (1997), 4095–4103. - PubMed
LinkOut - more resources
Full Text Sources
Molecular Biology Databases
Research Materials
Miscellaneous
