. 2021 Dec 29:14:7455-7465.
doi: 10.2147/JIR.S342096. eCollection 2021.

Dysregulation of the Retromer Complex in Brain Endothelial Cells Results in Accumulation of Phosphorylated Tau

Affiliations

Dysregulation of the Retromer Complex in Brain Endothelial Cells Results in Accumulation of Phosphorylated Tau

Alessia Filippone et al. J Inflamm Res. .

Abstract

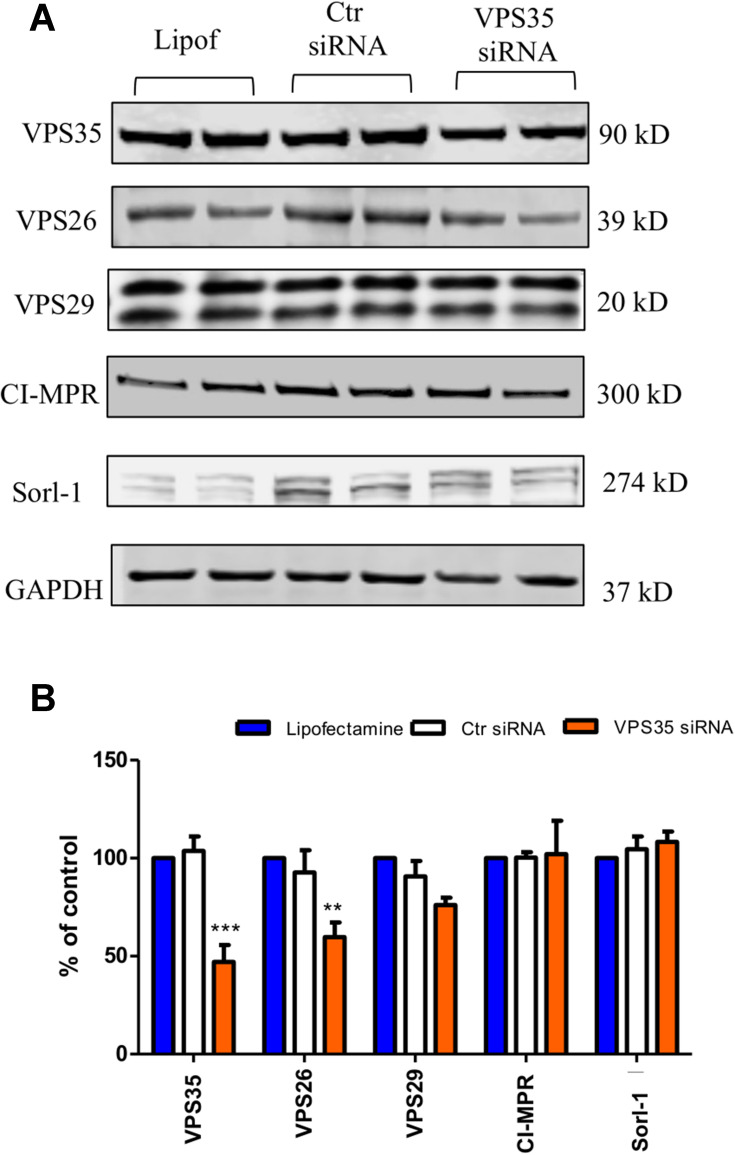
Introduction: Transport through endothelial cells of the blood-brain barrier (BBB) involves a complex group of structures of the endo-lysosome system such as early and late endosomes, and the retromer complex system. Studies show that neuronal dysregulation of the vacuolar protein sorting 35 (VPS35), the main component of the retromer complex recognition core, results in altered protein trafficking and degradation and is involved in neurodegeneration. Since the functional role of VPS35 in endothelial cells has not been fully investigated, in the present study we aimed at characterizing the effect of its downregulation on these pathways.

Methods: Genetic silencing of VPS35 in human brain endothelial cells; measurement of retromer complex system proteins, autophagy and ubiquitin-proteasome systems.

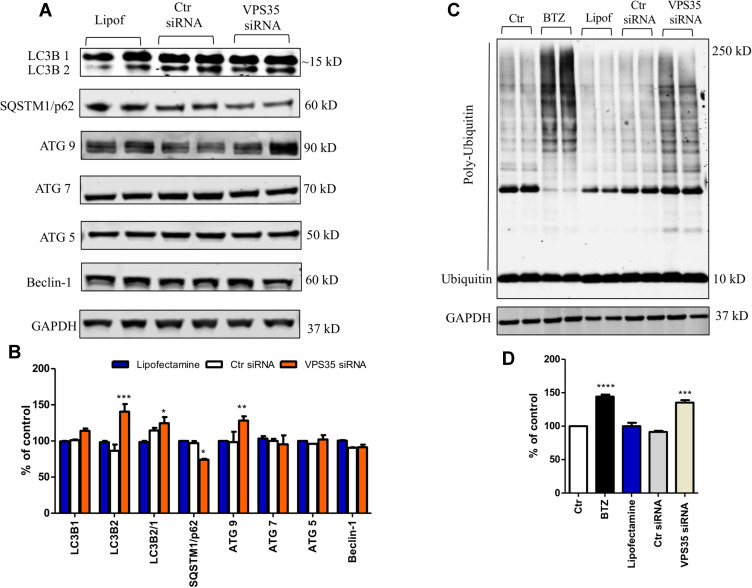
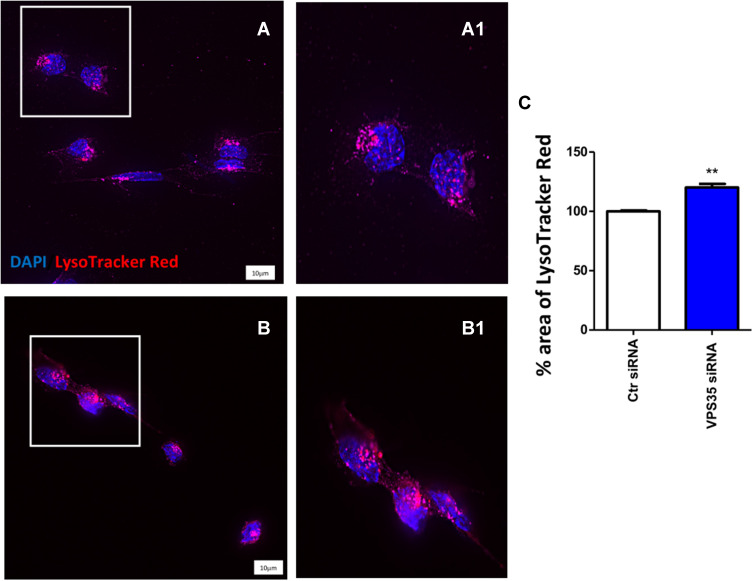
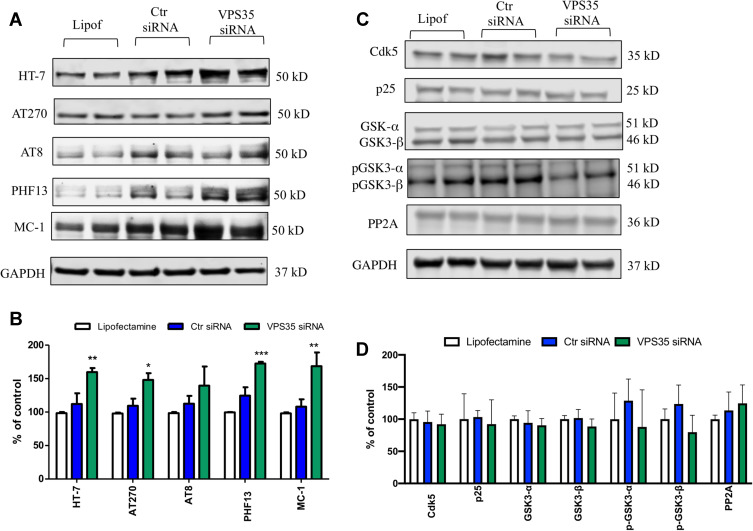
Results: VPS35-downregulated endothelial cells had increased expression of LC3B2/1 and more ubiquitinated products, markers of autophagy flux and impaired proteasome activity, respectively. Additionally, compared with controls VPS35 downregulation resulted in significant accumulation of tau protein and its phosphorylated isoforms.

Discussion: Our findings demonstrate that in brain endothelial cells retromer complex dysfunction by influencing endosome-lysosome degradation pathways results in altered proteostasis. Restoration of the retromer complex system function should be considered a novel therapeutic approach to rescue endothelial protein transport.

Keywords: Alzheimer’s disease; autophagy; brain endothelial cells; endosomal trafficking; retromer complex; tau protein; ubiquitin-proteasome.


Conflict of interest statement

All authors declare no conflicts of interest.

Figures

Figure 1
Figure 1
Downregulation of VPS35 influence on retromer complex system proteins in brain endothelial cells. The hCMEC/D3 cells were transfected with VPS35 or Ctr siRNA for 48 hours, then cell lysates were harvested for biochemistry. (A) Representative Western blot analysis for VPS35, VPS26, VPS29, CI-MPR, and Sorl-1 in cells lysates transfected with 15 nM VPS35 siRNA, Ctr siRNA, or lipofectamine (Lipof) alone. (B) Densitometric analysis of the immunoreactivity to the antibodies shown in (A) (***p < 0.001; **p < 0.01). Results are mean ± SEM (N = 2 per group, three individual experiments).
Figure 2
Figure 2
VPS35 silencing alters autophagy and promotes accumulation of poly-ubiquitinylated proteins in brain endothelial cells. The hCMEC/D3 cells were transfected with VPS35 or Ctr siRNA for 48 hrs, then cell lysates were harvested for biochemistry. (A) Representative Western blot analysis for LC3B, SQSTM1/p62, ATG9, ATG7, ATG5, and Beclin-1. (B) Densitometric analysis of the immunoreactivity to the antibodies shown in (A) (***p < 0.001 vs Lipofectamine; **p < 0.01 vs Lipofectamine; *p< 0.05 vs Lipofectamine). Results are mean ± SEM. (C) Representative Western blot analysis for ubiquitin, in cells lysates transfected as previously described. (D) Densitometric analysis of the immunoreactivity to the antibody shown in (C) (***p < 0.001 vs Lipofectamine), (****p < 0.0001 vs Lipofectamine). Results are mean ± SEM (N = 2 per group, three individual experiments).
Figure 3
Figure 3
Immunoreactivity for LC3B, SQSTM1/p62 antibodies following VPS35 silencing in brain endothelial cells. Representative microscopy images of control cells (A, A1 inset) and VPS35 silenced cells (B, B1 inset) stained for LC3B (TXred), VPS35 (Cy5 channel pseudo-colored purple), nuclear stain DAPI (blue); (Scale bar = 10 µm). Representative microscopy images of control (C, C1 inset) and VPS35 silenced cells (D, D1 inset) stained for LC3B (TXred), VPS35 (Cy5 channel pseudo-colored purple), nuclear stain DAPI (blue) also treated with BafA1; (Scale bar = 10 µm). (E) LC3B fluorescence intensity nucleus area (***p < 0.001 vs Ctr siRNA cells). (F) LC3B fluorescence intensity nucleus area in BafA1 treated cells (***p < 0.001 vs Ctr siRNA cells). Representative microscopy images of control (G, G1 inset) and VPS35 silenced cells (H, H1 inset) stained for SQSTM1/p62 (TXred), VPS35 (FITC: green) nuclear stain DAPI (blue); (Scale bar = 10 µm). Representative microscopy images of control (I, I1 inset) and VPS35 silenced cells (J, J1 inset) stained for SQSTM1/p62 (TXred), VPS35 (FITC: green), nuclear stain DAPI (blue) also treated with BafA1; (Scale bar = 10 µm). (K) SQSTM1/p62 fluorescence intensity nucleus area (L) SQSTM1/p62 fluorescence intensity nucleus area in BafA1 treated cells. (***p < 0.001 vs Ctr siRNA cells) (N = 3 individual experiments).
Figure 4
Figure 4
Lysosomal staining following VPS35 silencing in brain endothelial cells. Representative microscope images for control cells (A and A1 inset) and VPS35 siRNA-treated cells (B and B1 inset) labeled for VPS35 antibody (Cy5 channel pseudo-colored purple) and LysoTracker (LT) live cells dye (TXred channel, red). The distribution of acidic vesicles was visualized using fluorescence microscopy (Scale bar: 10 µm). Percentage area of LT (C) (**p < 0.01 vs Ctr siRNA). Results are mean ± SEM (N=3 individual experiments).
Figure 5
Figure 5
VPS35 affects pathological tau accumulation in brain endothelial cells. Brain endothelial cells were transfected with VPS35 or Ctr siRNA for 48 hrs, then cell lysates were harvested for biochemistry analysis. (A) Representative Western blot analysis for total tau (HT-7), phosphorylated tau at residues S202/T205 (AT8), T181 (AT270), and S396 (PHF13), and pathological tau (MC-1). (B) Densitometric analysis of the immunoreactivity to the antibodies shown in (A). (***p < 0.001 vs Lipofectamine; **p < 0.01 vs Lipofectamine; *p < 0.05 vs Lipofectamine). (C) Representative Western blot analysis for Cdk5, p25, GSK-3α/β, p-GSK-3α/β and PP2A. (D) Densitometric analysis of the immunoreactivity to the antibodies shown in (C). Results are mean ± SEM (N = 2 per group, three individual experiments).

Similar articles

Cited by

References

    1. Abbott NJ. Blood–brain barrier structure and function and the challenges for CNS drug delivery. J Inherit Metab Dis. 2013;36:437–449. doi:10.1007/s10545-013-9608-0 - DOI - PubMed
    1. Engelhardt B. Development of the blood-brain barrier. Cell Tissue Res. 2003;314:119–129. doi:10.1007/s00441-003-0751-z - DOI - PubMed
    1. Abbott NJ, Patabendige AAK, Dolman DEM, et al. Structure and function of the blood–brain barrier. Neurobiol Dis. 2010;37(1):13–25. doi:10.1016/j.nbd.2009.07.030 - DOI - PubMed
    1. Gonzalez-Carter D, Liu X, Tockary TA, et al. Targeting nanoparticles to the brain by exploiting the blood–brain barrier impermeability to selectively label the brain endothelium. Proc Natl Acad Sci USA. 2020;117(32):19141–19150. doi:10.1073/pnas.2002016117 - DOI - PMC - PubMed
    1. Haqqani AS, Delaney CE, Brunette E, et al. Endosomal trafficking regulates receptor-mediated transcytosis of antibodies across the blood brain barrier. J Cereb Blood Flow Metab. 2018;38:727–740. doi:10.1177/0271678X17740031 - DOI - PMC - PubMed