. 2022 Jan 1;18(2):599-616.
doi: 10.7150/ijbs.67816. eCollection 2022.

Trophoblast-derived Lactic Acid Orchestrates Decidual Macrophage Differentiation via SRC/LDHA Signaling in Early Pregnancy

Affiliations

Trophoblast-derived Lactic Acid Orchestrates Decidual Macrophage Differentiation via SRC/LDHA Signaling in Early Pregnancy

Lu Gao et al. Int J Biol Sci. .

Abstract

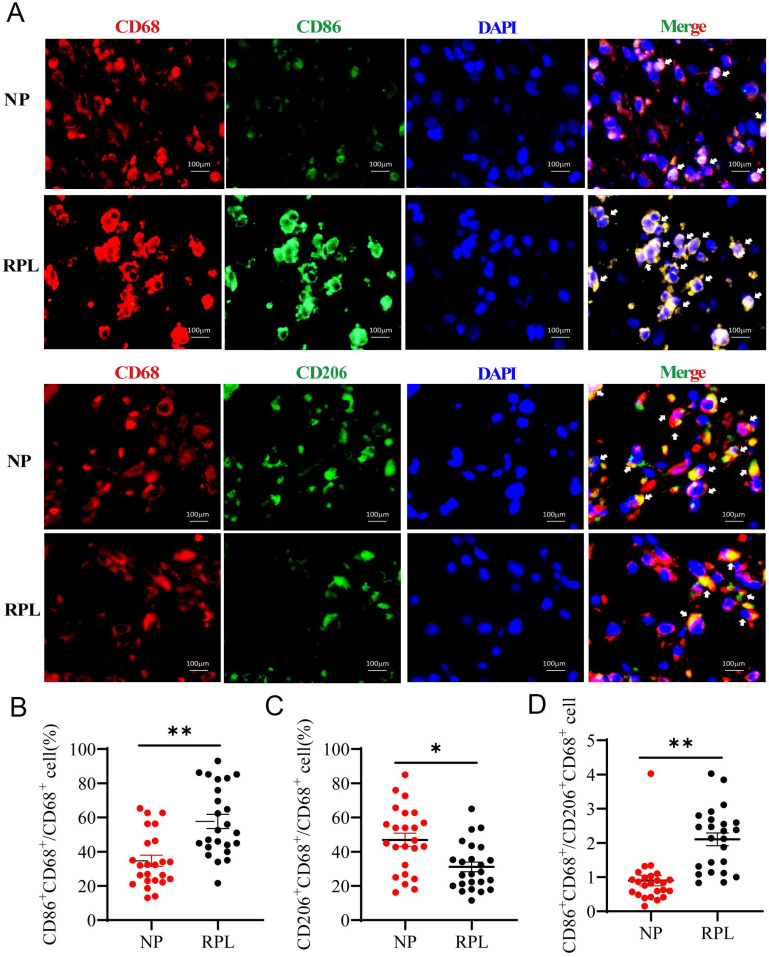
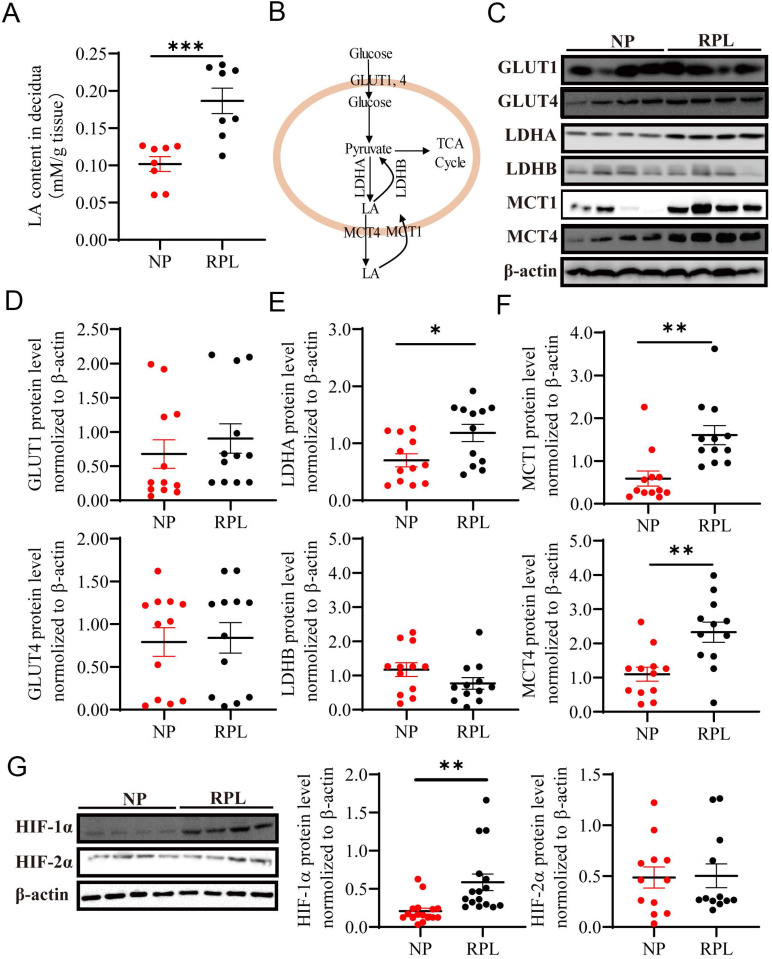
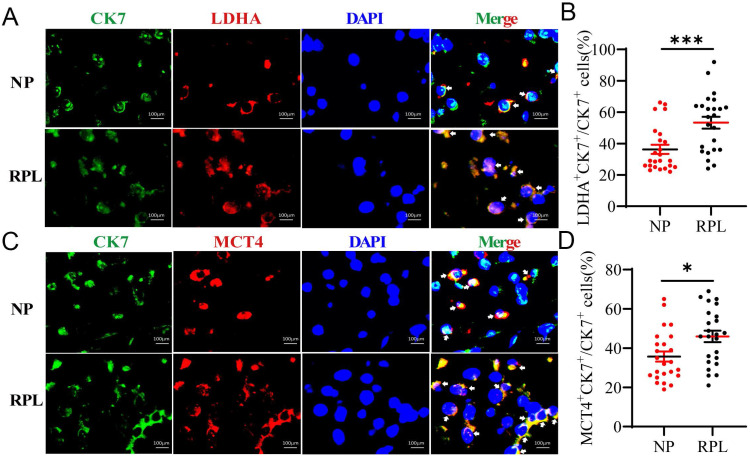
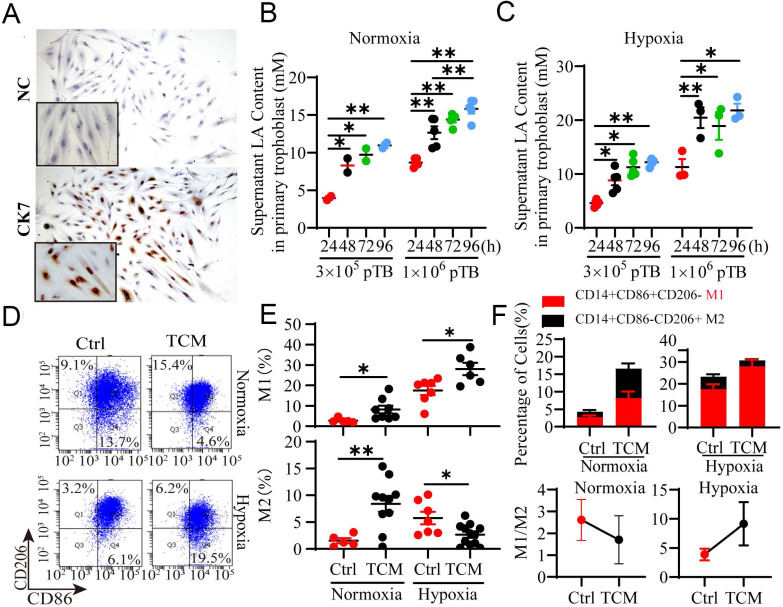
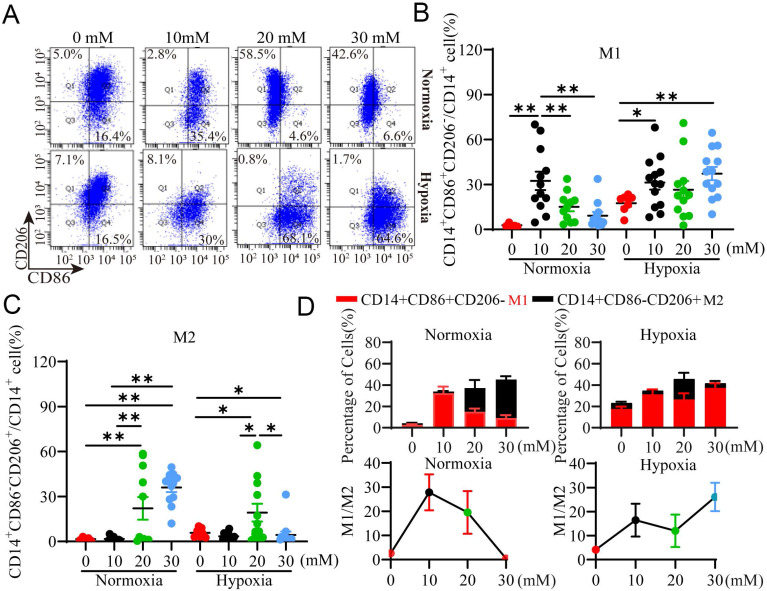
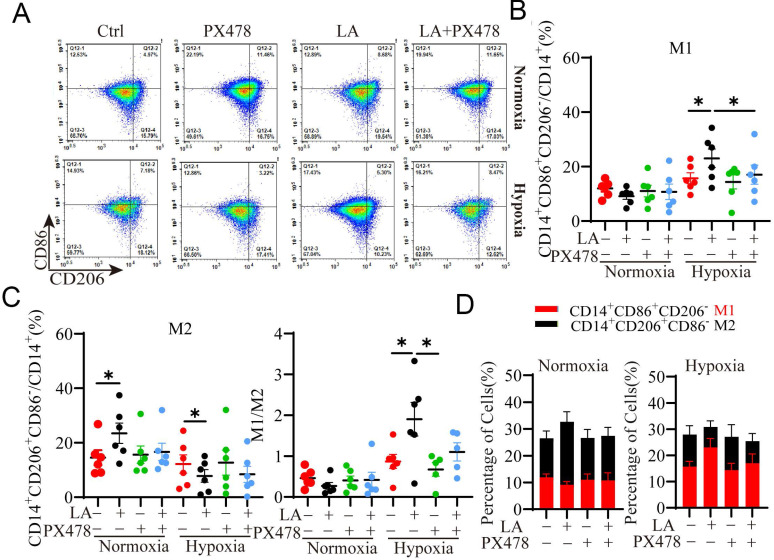
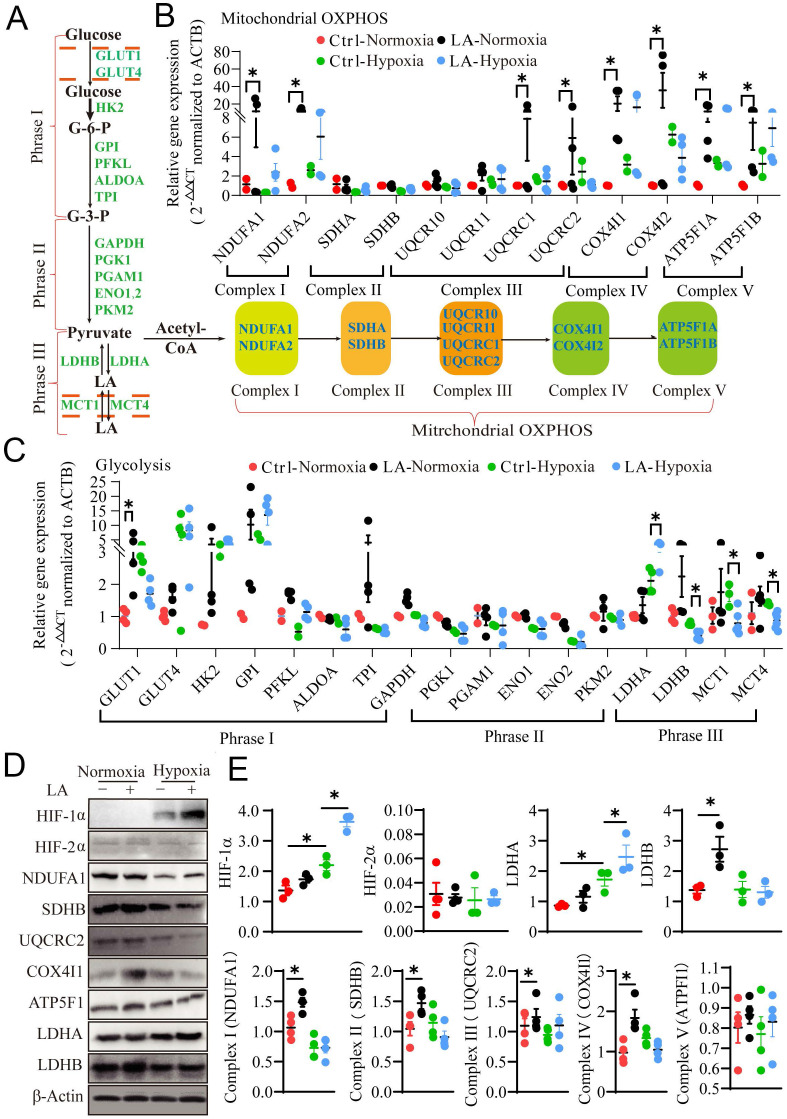
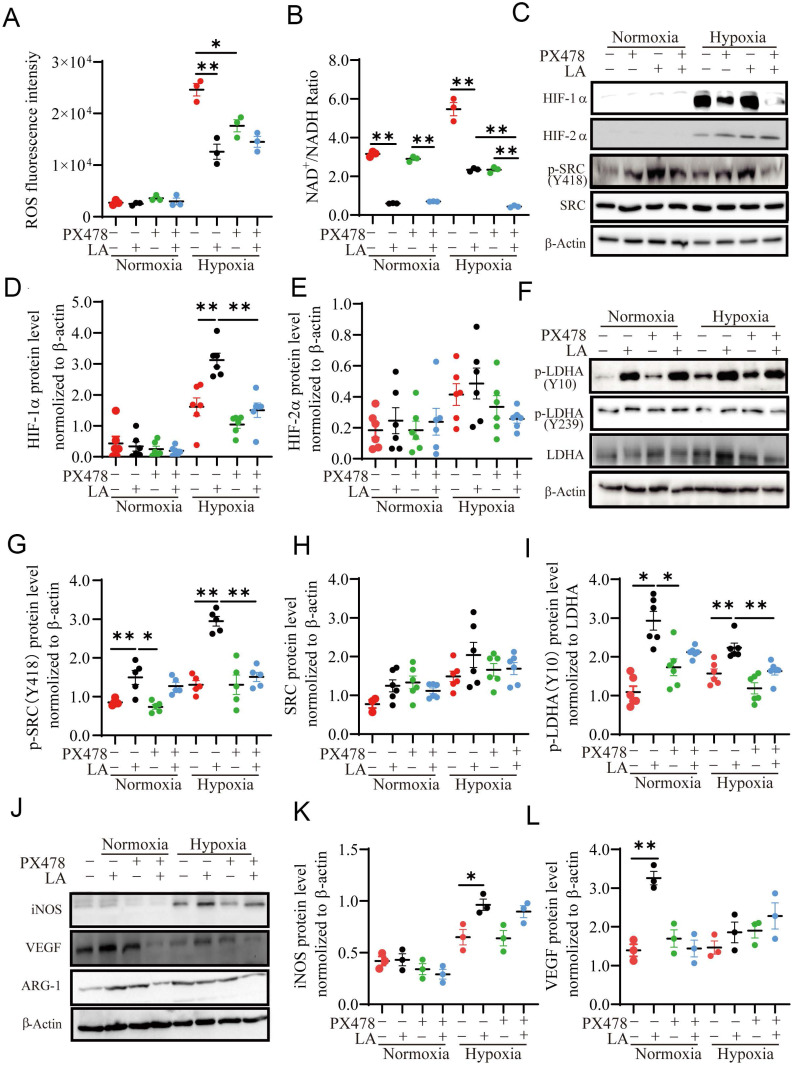
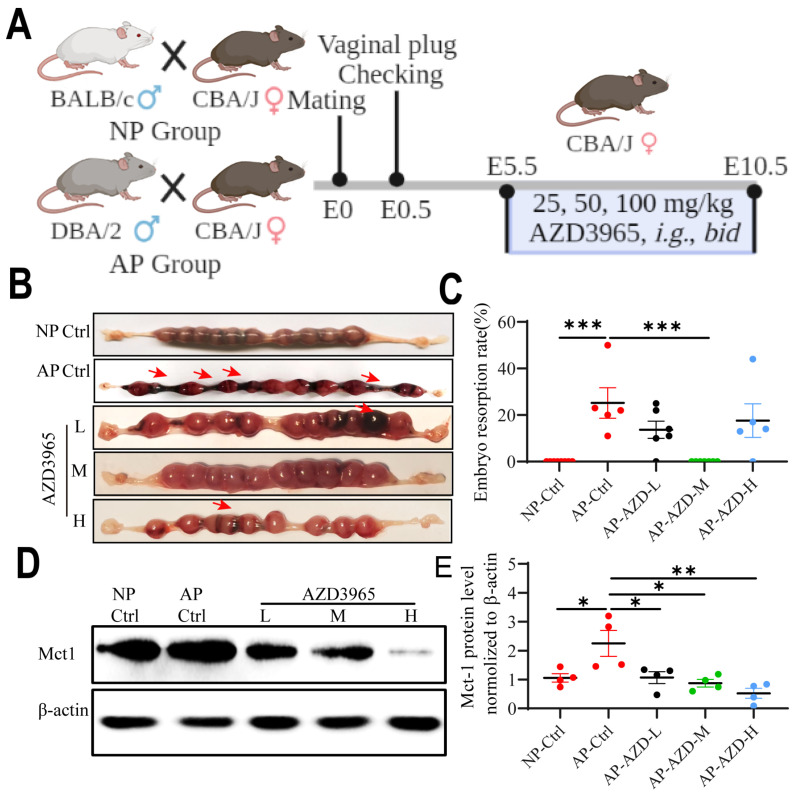
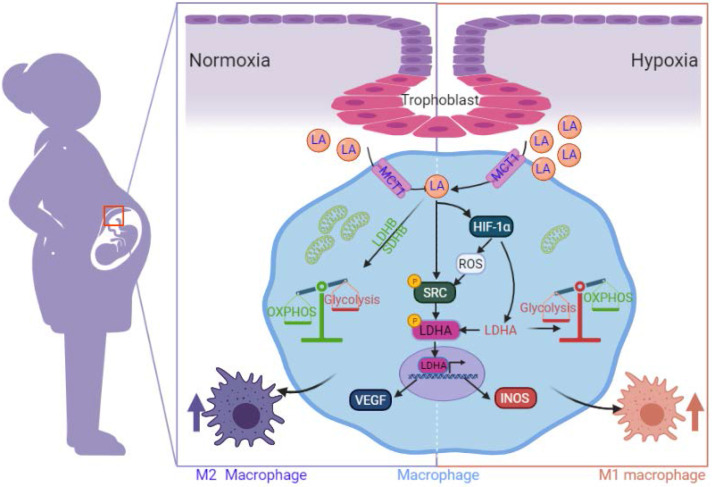
Lactic acid (LA) metabolism in the tumor microenvironment contributes to the establishment and maintenance of immune tolerance. This pathway is characterized in tumor associated macrophages. However, the role and pathway of LA metabolism at maternal-fetal interface during early pregnancy, especially in decidual macrophage differentiation, are still unclear. Herein, for the first time, we discovered that LA can trigger either M2 or M1 macrophage polarization via oxidative phosphorylation and glycolysis regulation under normoxia or hypoxia, respectively. Also, LA metabolism played a vital role in decidual macrophages-mediated recurrent pregnancy loss (RPL), through HIF-1α/SRC/LDHA pathway. Moreover, blockade of LA intake with AZD3965 (MCT-1 inhibitor) could rescue pregnancy in an abortion-prone mouse model, suggesting a potential therapeutic target in RPL. Collectively, the present study identifies the previously unknown functions of LA metabolism in the differentiation of decidual macrophages in early normal pregnancy and RPL, and provides a potential therapeutic strategy in RPL by manipulating decidual macrophages' functions through LA metabolic pathway.

Keywords: decidual macrophage; early pregnancy; lactic acid; recurrent pregnancy loss; trophoblast.


Conflict of interest statement

Competing Interests: The authors have declared that no competing interest exists.

Figures

Figure 1
Figure 1
Decidual macrophages polarized to the M2 phenotype in NP but to the M1 phenotype in RPL patients. (A) Representative staining of decidual macrophages by immunofluorescence in women with NP (n = 24) and RPL (n = 24). (B, C) Quantification of M1 (CD86+ CD68+/CD68+) and M2 (CD206+ CD68+/CD68+) macrophages was performed by Image-Pro Plus 6.0. (D) The ratio of M1 / M2 macrophages (CD86+ CD68+/CD206+ CD68+) was calculated based on the quantification of M1 and M2 macrophages. Data are shown as the means ± SEM. **p < 0.01, ****p < 0.0001.
Figure 2
Figure 2
Enhanced LA production through anaerobic glycolysis in the decidua of RPL patients. (A) LA levels in the decidua of women with NP (n = 8) and RPL (n =8) were determined by the colorimetric method and normalized to tissue wet weight (mM/g tissue). (B) Schematic diagram of glycolysis (LA synthesis and secretion). (C-F) The expression and quantification of glycolysis-related proteins (GLUT1, GLUT4, LDHA, LDHB, MCT-1 and MCT-4) (n = 12). (G) Hypoxia-marked proteins (HIF-1α and HIF-2α) in the decidua of women with NP and RPL were detected by western blotting (n = 12 - 16). Data are shown as the means ± SEM. *p < 0.05, **p < 0.01, ***p < 0.001. LA, lactic acid; NP, normal pregnancy; RPL, recurrent pregnancy loss.
Figure 3
Figure 3
Trophoblasts contribute to the high level of LA in the decidua of RPL patients. (A, B) Colocalization and quantification of CK7+ (trophoblast marker) LDHA+ (LA synthesis) cells in the decidua of women with NP (n = 24) and RPL (n = 24) by immunofluorescence assay. (C, D) Colocalization and quantification of CK7+ MCT-4+ (LA secretion) cells in the decidua of women with NP (n = 24) and RPL (n = 24) by immunofluorescence assay. Data are shown as the means ± SEM. *p < 0.05, ***p < 0.001.
Figure 4
Figure 4
Trophoblast-derived LA regulates the polarization of PBMC-derived macrophages under normoxia and hypoxia. (A) Isolated primary trophoblasts were identified via positive staining with CK7 by immunocytochemistry. (B, C) The LA level in the supernatant of primary trophoblasts was detected by the colorimetric method after the trophoblasts were cultured in 6 - well plates at a density of 3 × 10⁵ cells or 1 × 10⁶ cells/well in a 21% O2 or 1% O2 atmosphere for 24h -96 h, respectively (n = 3-6). (D) Representative flow cytometry data of M1 (CD14+ CD86+ CD206-) and M2 (CD14+ CD86- CD206+) macrophages treated with or without TCM under normoxic and hypoxic conditions. (E) Statistical analysis of the percentages of M1 (CD14+ CD86+ CD206-) and M2 (CD14+ CD86- CD206+) macrophages with or without TCM treatment under normoxia and hypoxia (n = 6 - 10). (F) The M1/M2 ratio and the percentages of macrophages treated with or without TCM under normoxic and hypoxic conditions. Data are shown as the mean ± SEM. *p < 0.05, **p < 0.01. NC: negative control; TCM: trophoblast conditioned medium.
Figure 5
Figure 5
Exogenous LA regulates the polarization of PBMC-derived macrophages under normoxia and hypoxia. (A) Representative data of M1 (CD14+ CD86+ CD206-) and M2 (CD14+ CD86- CD206+) macrophages treated with 1 μM HCl (control as 0 mM LA) or LA (10 mM, 20 mM and 30 mM) for 3 h under normoxic and hypoxic conditions by flow cytometry. (B, C) Statistical analysis of the percentages of M1 (CD14+CD86+CD206-) and M2 (CD14+CD86-CD206+) macrophages treated with or without LA under normoxic and hypoxic conditions (n = 7-15). (D) The percentages of M1 (CD14+ CD86+ CD206-) and M2 (CD14+ CD86- CD206+) macrophages (n = 7-15) and M1/M2 ratio. Data are shown as the mean ± SEM. *p < 0.05, **p < 0.01.
Figure 6
Figure 6
Blockade of HIF-1α inhibits PBMC-derived macrophage polarization regulated by exogenous LA (20 mM) under normoxia and hypoxia. (A) Representative flow cytometry data of M1 (CD14+ CD86+ CD206-) and M2 (CD14+ CD86- CD206+) macrophages treated with or without LA under normoxic and hypoxic conditions. (B, C) The statistical data of the percentages of M1 (CD14+ CD86+ CD206-) and M2 (CD14+ CD86- CD206+) macrophages treated with or without LA in the presence or absence of PX478 (20 µM, HIF-1α inhibitor) under normoxic and hypoxic conditions (n = 6). (D, E) The M1/M2 ratio and the percentages of M1 and M2 macrophages (n = 6). Data are shown as the mean ± SEM. *p < 0.05.
Figure 7
Figure 7
Exogenous 20mM LA regulates PBMC-derived macrophage polarization through metabolic reprogramming under normoxia and hypoxia. (A) Schematic diagram of mitochondrial OXPHOS and glycolysis. (B, C) The mRNA expression of mitochondrial OXPHOS- and glycolysis-related genes in macrophages treated with or without LA (20 mM) under normoxia and hypoxia (n = 3-6). (D, E) Quantification of protein expression participating in mitochondrial OXPHOS (NDUFA1, SDHB, UQCRC2, Cox4I1 and ATP5F1), hypoxia (HIF-1α and HIF-2α) and glycolysis (LDHA and LDHB) regulation in macrophages treated with or without LA (20 mM) under normoxia and hypoxia by western blotting (n = 3-6). Data are shown as the mean ± SEM. *p < 0.05. OXPHOS, Oxidative phosphorylation.
Figure 8
Figure 8
Exogenous LA (20 mM) regulates PBMC-derived macrophage polarization through the HIF1-α/SRC/LDHA pathway. (A) ROS fluorescence intensity (n=3). (B) NAD+/NADH ratio (n = 3). (C-L) Representative data and quantification of HIF-1α, HIF-2α, p-SRC (Y418), SRC, p-LDHA (Y10), p-LDHA (Y239), LDHA, INOS, VEGF and ARG1 protein expression in macrophages treated with or without 20mM LA in the presence or absence of PX478 under normoxia and hypoxia (n = 3-6). Data are shown as the mean ± SEM. *p < 0.05, **p < 0.01.
Figure 9
Figure 9
Blocking LA intake with MCT-1 inhibitor (AZD3965) could rescue pregnancy in abortion-prone mouse model. (A) Schematic diagram of animal experiment protocol. (B) Representative macroscopic view of uterus and fetuses in NP and AP mice with or without AZD3965 treatment at doses of 25 mg/kg, bid (L), 50 mg/kg, bid (M) and 100 mg/kg, bid (H), respectively. (C) Embryo resorption rate in NP and AP mice with or without AZD3965 treatment (n = 5-8). (D-E) Representative data and quantification of Mct-1 protein expression in uterus of NP and AP mice with or without AZD3965 treatment (n = 4). Data are shown as the mean ± SEM. *p < 0.05, **p < 0.01, ***p < 0.001. L, low; M, moderate; H, high.
Figure 10
Figure 10
Schematic diagram of the mechanism by which trophoblast-derived LA regulates macrophage polarization under normoxia and hypoxia. Under normoxia, trophoblast-derived LA promotes macrophage polarization to the M2 phenotype by upregulating mitochondrial OXPHOS (especially increasing the expression of SDHB, COX4I1 and LDHB) and SRC-mediated LDHA phosphorylation (Y10) / VEGF expression. Under hypoxia, trophoblast-derived LA promotes macrophage polarization to the M1 phenotype by upregulating glycolysis mediated by HIF-1α, especially by increasing LDHA.

References

    1. Zhang YH, He M, Wang Y, Liao AH. Modulators of the Balance between M1 and M2 Macrophages during Pregnancy. Front Immunol. 2017;8:120. - PMC - PubMed
    1. Zhang Y, Ma L, Hu X, Ji J, Mor G, Liao A. The role of the PD-1/PD-L1 axis in macrophage differentiation and function during pregnancy. Hum Reprod. 2019;34:25–36. - PubMed
    1. Yao Y, Xu XH, Jin L. Macrophage Polarization in Physiological and Pathological Pregnancy. Front Immunol. 2019;10:792. - PMC - PubMed
    1. Li ZH, Wang LL, Liu H, Muyayalo KP, Huang XB, Mor G. et al. Galectin-9 Alleviates LPS-Induced Preeclampsia-Like Impairment in Rats via Switching Decidual Macrophage Polarization to M2 Subtype. Front Immunol. 2018;9:3142. - PMC - PubMed
    1. Riera-Domingo C, Audige A, Granja S, Cheng WC, Ho PC, Baltazar F. et al. Immunity, Hypoxia, and Metabolism-the Menage a Trois of Cancer: Implications for Immunotherapy. Physiol Rev. 2020;100:1–102. - PubMed

Publication types