. 2021 Oct 27;23(24):9881-9893.
doi: 10.1039/d1gc02623b. eCollection 2021 Dec 13.

Planetary metrics for the absolute environmental sustainability assessment of chemicals

Affiliations

Planetary metrics for the absolute environmental sustainability assessment of chemicals

Victor Tulus et al. Green Chem. .

Abstract

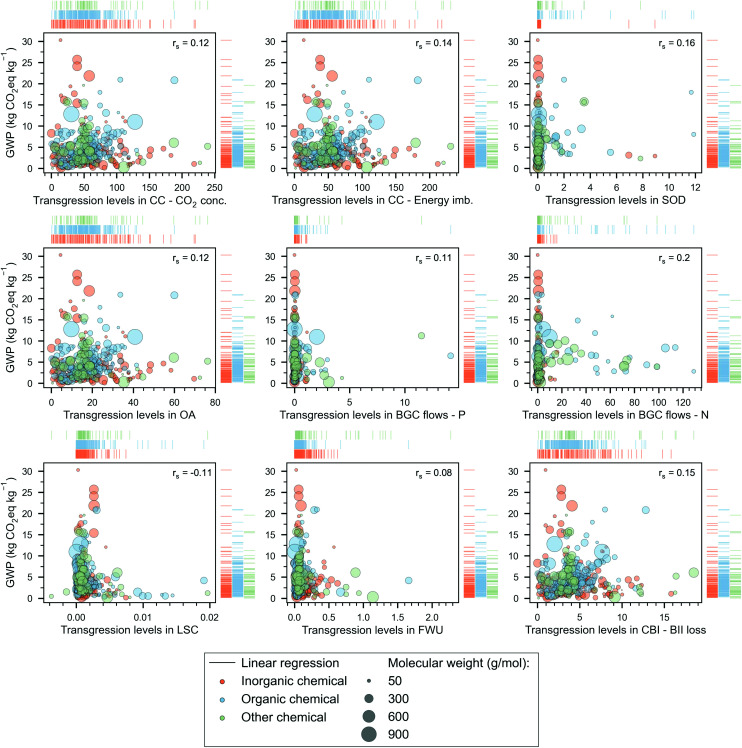
Environmental assessments in green chemistry often rely on simplified metrics that enable comparisons between alternative routes but fail to shed light on whether they are truly sustainable in absolute terms, viz. relative to the Earth's ecological capacity. To expand our currently limited knowledge of the extent to which chemicals are environmentally sustainable, here we analyse 492 chemical products through the lens of seven planetary boundaries representing critical biophysical limits that should never be exceeded. We found that most of them transgress these environmental guardrails, mainly the ones strongly connected to greenhouse gas emissions (i.e., climate change, ocean acidification and biosphere integrity). However, their levels of transgression fail to correlate with their carbon footprints, currently the focus of most studies, implying that chemicals entailing higher greenhouse gas emissions are not necessarily less environmentally sustainable in absolute terms. Our work points towards the need to embrace absolute sustainability criteria in current environmental assessments, which will require agreeing on how to allocate shares of the planet's ecological capacity among anthropogenic activities, including chemicals' production. This work's absolute environmental sustainability assessment (AESA) method, which could complement standard life cycle assessment approaches, might help experimental researchers working in green chemistry develop truly 'green' products. The AESA method should be taken as a starting point to devise holistic approaches for quantifying the absolute environmental impact of chemicals to guide research and policymaking more sensibly.


Conflict of interest statement

There are no conflicts to declare.

Figures

Fig. 1
Fig. 1. Overview of the methodology used in this study. Four phases of a standard LCA, shown in separate dash line delimited boxes, are followed: (1) goal and scope definition, (2) inventory analysis, (3) impact assessment with the implementation of the PB-LCIA method, (4) interpretation of results and recommendations. Pairs of thick arrows represent the interconnections between the different LCA phases, and thin arrows indicate the general flow of the method.
Fig. 2
Fig. 2. Frequency distributions (histograms) and cumulative distribution functions (CDF) of transgression levels (TLs) of chemicals in the PBs. The left y-axis shows the frequency of the data (i.e., chemicals) appearing in a range specified by the thickness of each bar (i.e., range of TLs shown on the x-axis); the right y-axis shows the probability of the associated cumulative distribution function (one per each category of chemicals), i.e., probability of a chemical having a TL below the value displayed in the x-axis. Each category of chemicals (i.e., organic, inorganic, other, or all) is given by a coloured curve of the CDF. The vertical red dotted line in the subplots represents the transgression level derived from applying the grandfathering sharing principle (TLGF). The threshold above which a chemical is deemed unsustainable (TL = 1) is depicted with a vertical black dotted line. The vertical blue dotted line shows the median of the dataset, while additional statistical information is given in the text box (one per subplot), where n is the number of samples (chemicals), min/max are the minimum and maximum values across all the chemicals, is the mean, and cv is the coefficient of variation of the dataset. The notation for the PBs is as follows: climate change (CC) with control variables of CO2 concentration (CO2 conc.) and energy imbalance (Energy imb.), stratospheric ozone depletion (SOD), ocean acidification (OA), biogeochemical (BGC) flows with control variables of phosphorus (P) and nitrogen (N), land-system change (LSC), freshwater use (FWU), change in biosphere integrity (CBI) with control variable of loss of biodiversity intactness index (BII loss).
Fig. 3
Fig. 3. Global warming potential (GWP) of chemicals versus their transgression levels (TLEPC) in the PBs. The chemicals, represented by bubbles – whose size denotes the molecular weight –, are grouped into three categories, ‘inorganic’ (orange), ‘organic’ (blue) and ‘other’ (green). We indicate the Spearman's rank correlation coefficient (rs) between the TLs (in a specific PB) and GWP scores on the top right of the scatter plot. Rug plots on the sides of each scatter plot show the individual distribution of the chemicals according to their category. The notation for the PBs is as follows: climate change (CC) with control variables of CO2 concentration (CO2 conc.) and energy imbalance (Energy imb.), stratospheric ozone depletion (SOD), ocean acidification (OA), biogeochemical (BGC) flows with control variables of phosphorus (P) and nitrogen (N), land-system change (LSC), freshwater use (FWU), change in biosphere integrity (CBI) with control variable of loss of biodiversity intactness index (BII loss). Note that 21 chemicals with GWP scores ranging from 48 to 3907 kg CO2eq per kg of chemical are omitted here (for visualisation purposes) but are shown in Table S-4 of the ESI.
Fig. 4
Fig. 4. List of selected chemicals sorted by their TL score in CC – energy imbalance PB. The first nine columns show the TLs of the chemicals in every control variable of the PBs. The tenth column depicts the unitary prices for each of the chemicals, and in the last column, the GWP score for each chemical is given. The grey rows indicate that the chemical is detected as an outlier. The network depicts a qualitative representation of multiple interactions between the different chemicals. The notation is as follows: circles with inwards pointing arrows represent a direct input (direct use as raw material), while arrows pointing to a square denote an indirect use at some point in the production chain; circles with outwards pointing arrows represent an output. The colours of the network are arbitrarily selected to ease the visualisation. The notation for the PBs is as follows: climate change (CC) with control variables of CO2 concentration (CO2 conc.) and energy imbalance (Energy imb.), stratospheric ozone depletion (SOD), ocean acidification (OA), biogeochemical (BGC) flows with control variables of phosphorus (P) and nitrogen (N), land-system change (LSC), freshwater use (FWU), change in biosphere integrity (CBI) with control variable of loss of biodiversity intactness index (BII loss).

References

    1. Kätelhön A. Meys R. Deutz S. Suh S. Bardow A. Proc. Natl. Acad. Sci. U. S. A. 2019;116:11187–11194. doi: 10.1073/pnas.1821029116. - DOI - PMC - PubMed
    1. Chang H. Bajaj I. Huber G. W. Maravelias C. T. Dumesic J. A. Green Chem. 2020;22:5285–5295. doi: 10.1039/D0GC01576H. - DOI - PMC - PubMed
    1. Rabnawaz M. Wyman I. Auras R. Cheng S. Green Chem. 2017;19:4737–4753. doi: 10.1039/C7GC02521A. - DOI
    1. Ioannou I. D'Angelo S. C. Galán-Martín Á. Pozo C. Pérez-Ramírez J. Guillén-Gosálbez G. React. Chem. Eng. 2021;6:1179–1194. doi: 10.1039/D0RE00451K. - DOI - PMC - PubMed
    1. Anastas P. Eghbali N. Chem. Soc. Rev. 2010;39:301–312. doi: 10.1039/B918763B. - DOI - PubMed

LinkOut - more resources