

Spatial statistical analysis of the relationship between self-reported mental health during the COVID-19 lockdown and closeness to green infrastructure
- PMID: 35002595
- PMCID: PMC8717691
- DOI: 10.1016/j.ufug.2021.127457
Spatial statistical analysis of the relationship between self-reported mental health during the COVID-19 lockdown and closeness to green infrastructure
Abstract
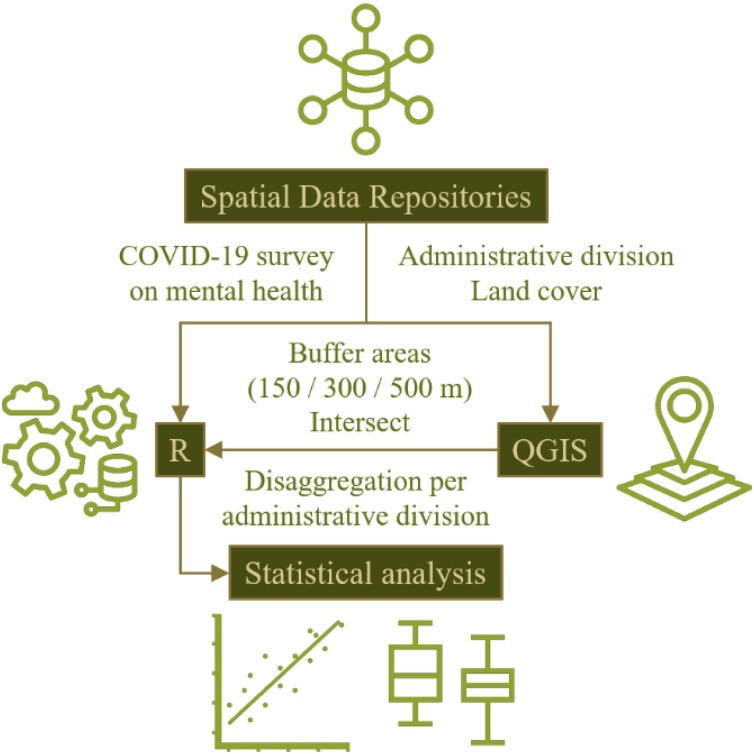
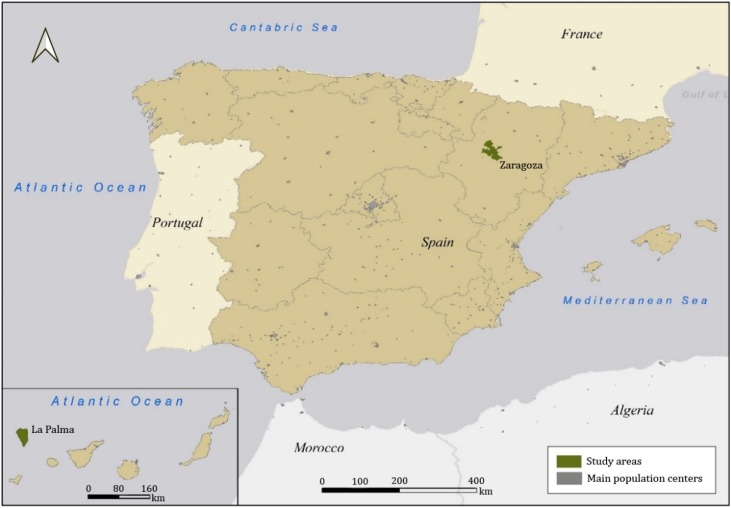
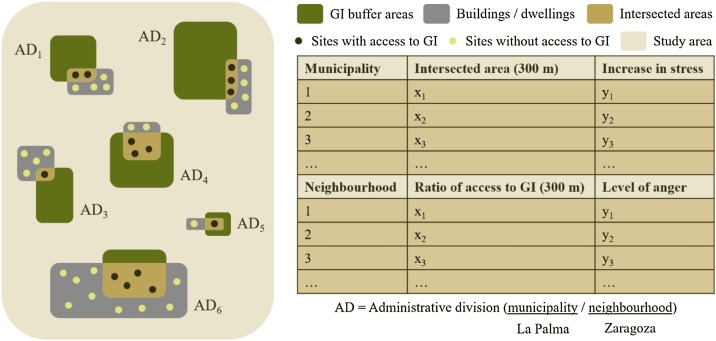
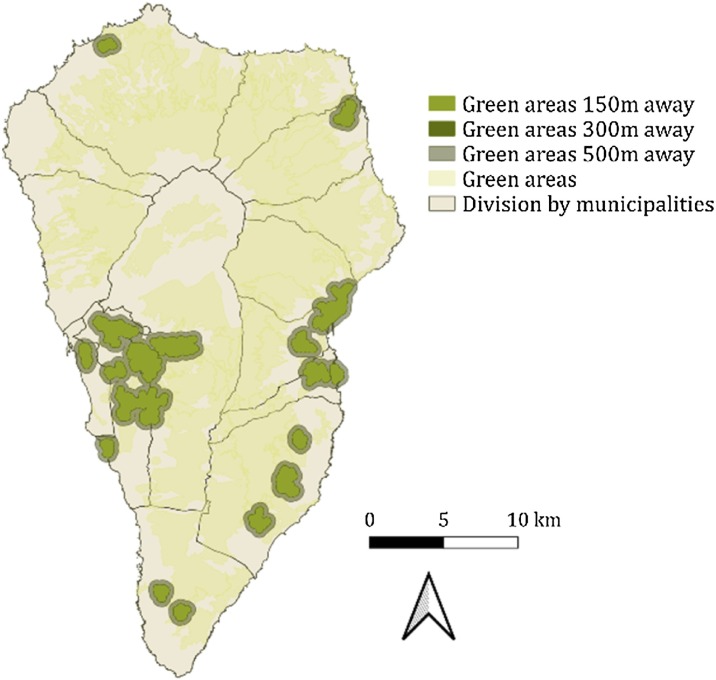
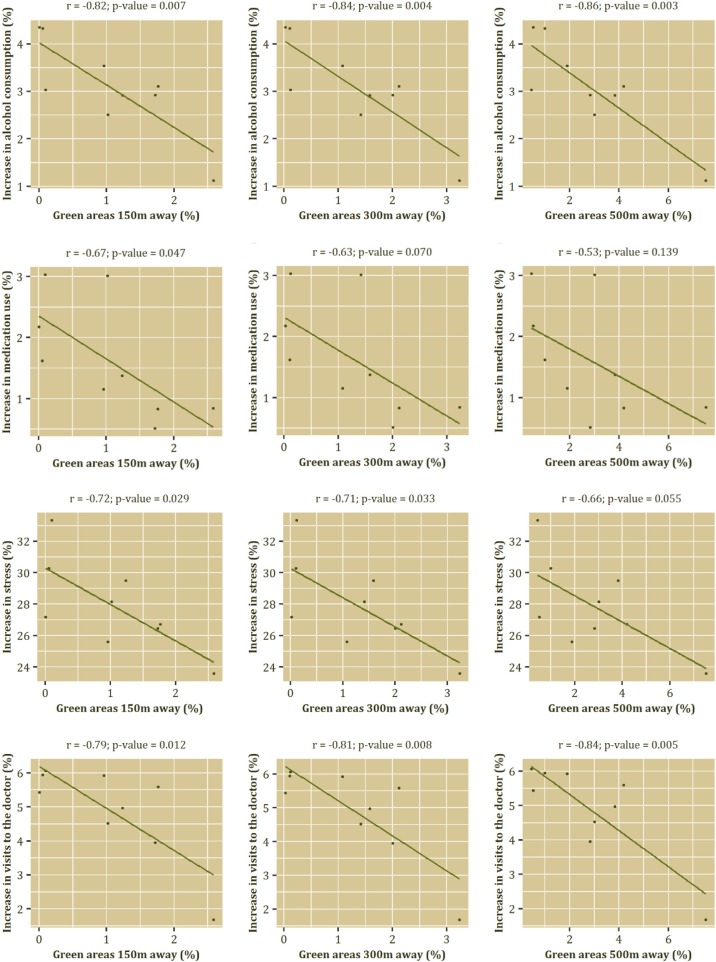
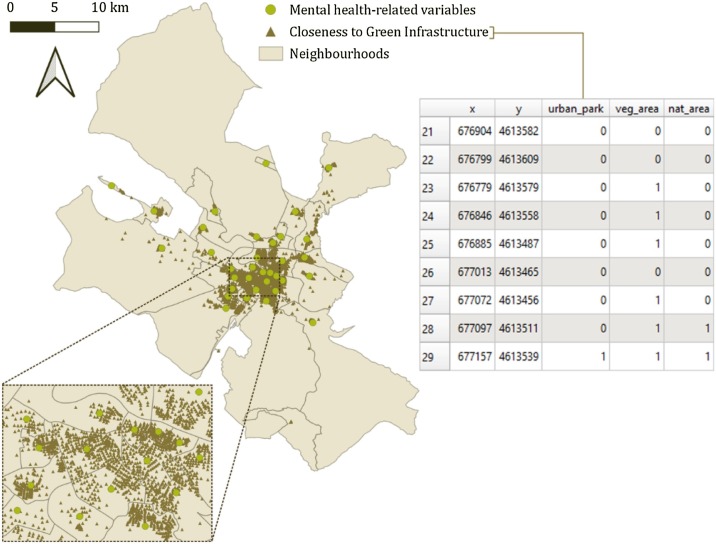
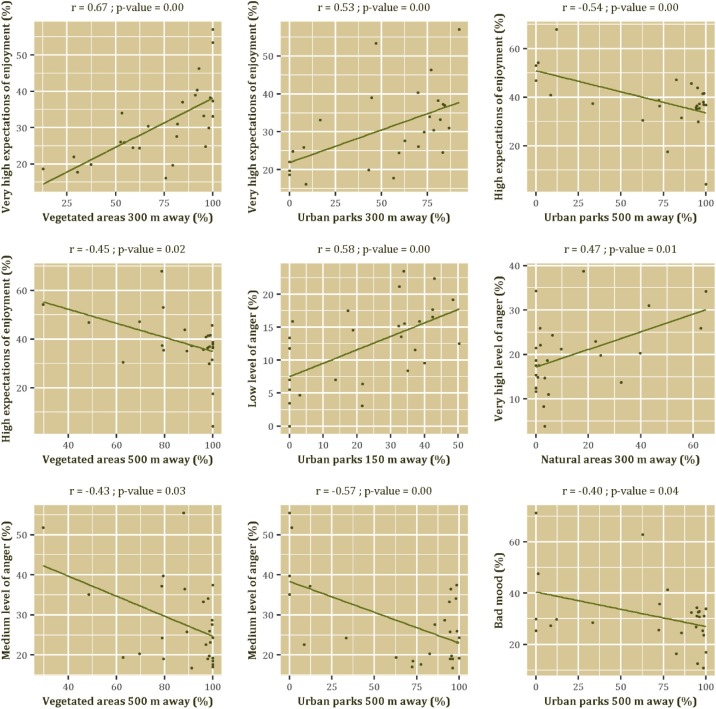
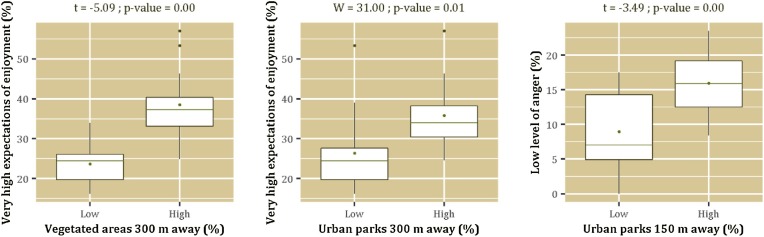
The COVID-19 pandemic has produced alterations in the behaviour and psychological health of people, who have had to learn living under uncertain circumstances escaping their control. This situation has been aggravated in those countries applying strict home confinement rules to try bending their epidemic curve. This is the case of Spain, where the stringent lockdown period was extended over three months. This study aimed at proving a research hypothesis whereby living close to Green Infrastructure (GI) during the confinement period was beneficial for mental health. To this end, La Palma (Canary Islands) and Zaragoza (Peninsular Spain) were taken as case studies, since both locations distributed a questionnaire to address citizenry's self-reported mental health under strict lockdown conditions. A spatial statistical analysis of the responses collected by these questionnaires revealed that variables such as stress, anger, medication use, alcohol consumption or visits to the doctor significantly decreased if citizens were close to GI, whereas people having very high expectations of enjoying the city after the confinement were positively correlated to proximity of green areas. Although these outcomes are limited by the inferential capacity of correlation analysis, they point out to a sense of relief derived from having visual contact with vegetated landscapes and feeling stimulated about using them for recreation, aesthetical or sporting purposes. The joint consideration of these psychological gains with the social and environmental benefits provided by GI emphasizes the importance of approaching urban regeneration through the design and implementation of interconnected green spaces.
Keywords: COVID-19; Green infrastructure; Lockdown; Mental health; Urban planning.
© 2021 Elsevier GmbH. All rights reserved.
Conflict of interest statement
The authors declare that they have no known competing financial interests or personal relationships that could have appeared to influence the work reported in this paper.
Figures

Similar articles
-
Contact with blue-green spaces during the COVID-19 pandemic lockdown beneficial for mental health.Sci Total Environ. 2021 Feb 20;756:143984. doi: 10.1016/j.scitotenv.2020.143984. Epub 2020 Nov 26. Sci Total Environ. 2021. PMID: 33277006 Free PMC article.
-
Exposure to nature and mental health outcomes during COVID-19 lockdown. A comparison between Portugal and Spain.Environ Int. 2021 Sep;154:106664. doi: 10.1016/j.envint.2021.106664. Epub 2021 May 28. Environ Int. 2021. PMID: 34082237 Free PMC article.
-
Analysis of pandemic outdoor recreation and green infrastructure in Nordic cities to enhance urban resilience.NPJ Urban Sustain. 2022;2(1):25. doi: 10.1038/s42949-022-00068-8. Epub 2022 Oct 3. NPJ Urban Sustain. 2022. PMID: 37521775 Free PMC article.
-
Citizens' use of public urban green spaces at the time of the COVID-19 pandemic in Italy.Urban For Urban Green. 2022 Nov;77:127739. doi: 10.1016/j.ufug.2022.127739. Epub 2022 Sep 23. Urban For Urban Green. 2022. PMID: 36168321 Free PMC article.
-
How the COVID-19 pandemic changed patterns of green infrastructure use: A scoping review.Urban For Urban Green. 2023 Mar;81:127848. doi: 10.1016/j.ufug.2023.127848. Epub 2023 Jan 21. Urban For Urban Green. 2023. PMID: 36711249 Free PMC article.
Cited by
-
Natural environments, psychosocial health, and health behaviors in a crisis - A scoping review of the literature in the COVID-19 context.J Environ Psychol. 2023 Jun;88:102009. doi: 10.1016/j.jenvp.2023.102009. Epub 2023 Apr 9. J Environ Psychol. 2023. PMID: 37065613 Free PMC article.
-
Prevalence and Relationships between Alexithymia, Anhedonia, Depression and Anxiety during the Belgian COVID-19 Pandemic Lockdown.Int J Environ Res Public Health. 2022 Nov 18;19(22):15264. doi: 10.3390/ijerph192215264. Int J Environ Res Public Health. 2022. PMID: 36430003 Free PMC article.
-
COVID-19 and the importance of urban green spaces.Urban For Urban Green. 2022 Aug;74:127654. doi: 10.1016/j.ufug.2022.127654. Epub 2022 Jun 20. Urban For Urban Green. 2022. PMID: 35754930 Free PMC article. No abstract available.
-
Green space attributes and their impact on perceived stress in Poland.Sci Rep. 2025 Apr 22;15(1):13863. doi: 10.1038/s41598-025-98707-4. Sci Rep. 2025. PMID: 40263565 Free PMC article.
References
-
- Agencia Tributaria . 2021. Estadística de los declarantes del IRPF por municipios [WWW Document] URL https://www.agenciatributaria.es/AEAT.internet/datosabiertos/catalogo/ha... (Accessed 6.17.21)
-
- Anyan F., Ingvaldsen S.H., Hjemdal O. Interpersonal stress, anxiety and depressive symptoms: results from a moderated mediation analysis with resilience. Ansiedad Estrés. 2020;26:148–154. doi: 10.1016/j.anyes.2020.07.003. - DOI
-
- Arnberger A., Eder R. Are urban visitors’ general preferences for green-spaces similar to their preferences when seeking stress relief? Urban For. Urban Green. 2015;14:872–882. doi: 10.1016/j.ufug.2015.07.005. - DOI
-
- Ayuntamiento de Zaragoza . 2021. Infraestructura de datos espaciales de Zaragoza (IDEZar) [WWW Document] URL http://www.zaragoza.es/sede/portal/idezar/mapa/demografico/ (Accessed 6.17.21)
LinkOut - more resources
Full Text Sources