

Neural Measures of Pitch Processing in EEG Responses to Running Speech
- PMID: 35002597
- PMCID: PMC8729880
- DOI: 10.3389/fnins.2021.738408
Neural Measures of Pitch Processing in EEG Responses to Running Speech
Abstract
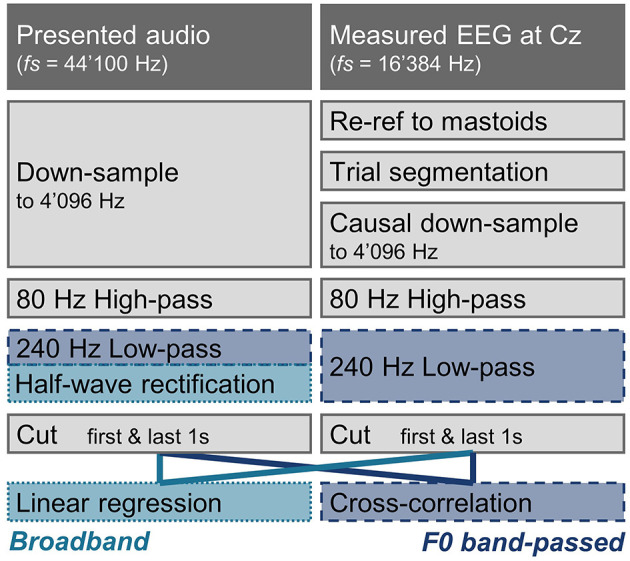
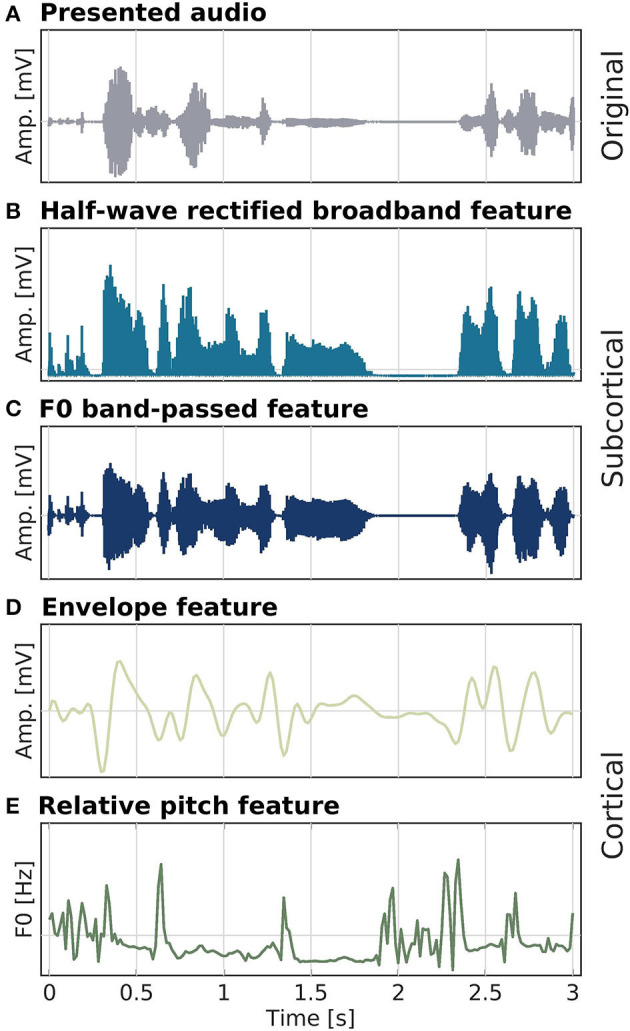
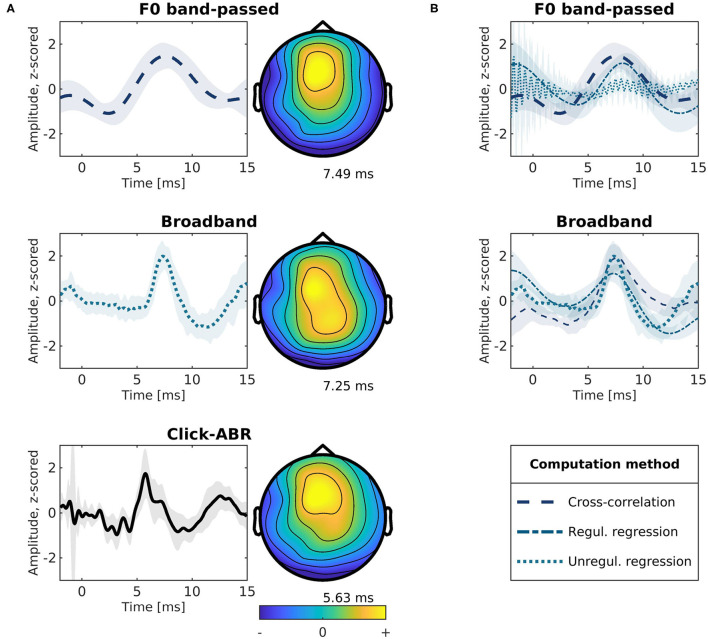
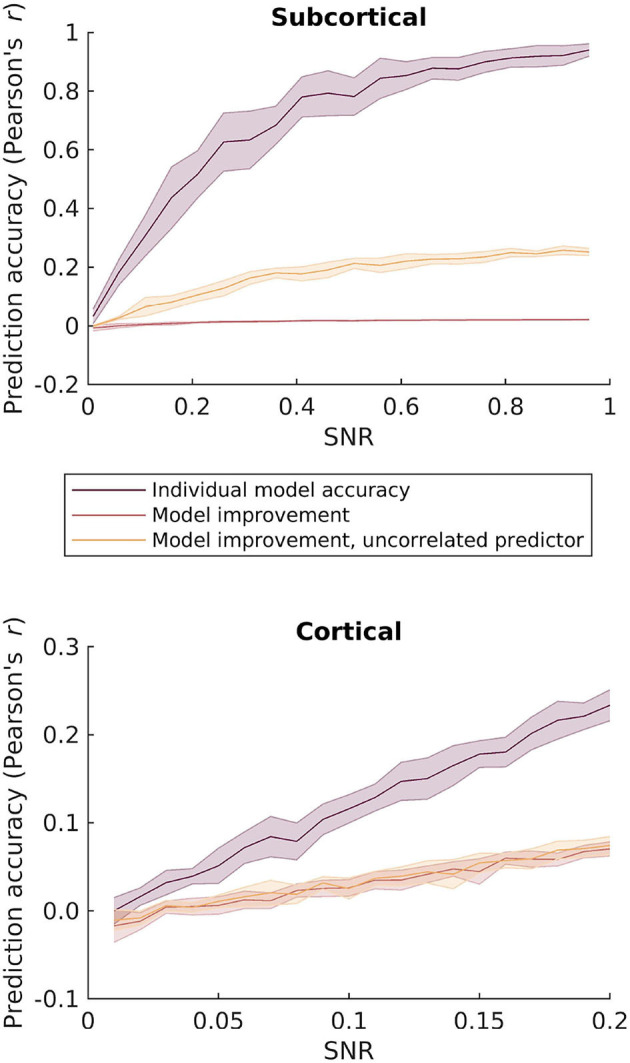
Linearized encoding models are increasingly employed to model cortical responses to running speech. Recent extensions to subcortical responses suggest clinical perspectives, potentially complementing auditory brainstem responses (ABRs) or frequency-following responses (FFRs) that are current clinical standards. However, while it is well-known that the auditory brainstem responds both to transient amplitude variations and the stimulus periodicity that gives rise to pitch, these features co-vary in running speech. Here, we discuss challenges in disentangling the features that drive the subcortical response to running speech. Cortical and subcortical electroencephalographic (EEG) responses to running speech from 19 normal-hearing listeners (12 female) were analyzed. Using forward regression models, we confirm that responses to the rectified broadband speech signal yield temporal response functions consistent with wave V of the ABR, as shown in previous work. Peak latency and amplitude of the speech-evoked brainstem response were correlated with standard click-evoked ABRs recorded at the vertex electrode (Cz). Similar responses could be obtained using the fundamental frequency (F0) of the speech signal as model predictor. However, simulations indicated that dissociating responses to temporal fine structure at the F0 from broadband amplitude variations is not possible given the high co-variance of the features and the poor signal-to-noise ratio (SNR) of subcortical EEG responses. In cortex, both simulations and data replicated previous findings indicating that envelope tracking on frontal electrodes can be dissociated from responses to slow variations in F0 (relative pitch). Yet, no association between subcortical F0-tracking and cortical responses to relative pitch could be detected. These results indicate that while subcortical speech responses are comparable to click-evoked ABRs, dissociating pitch-related processing in the auditory brainstem may be challenging with natural speech stimuli.
Keywords: EEG; auditory brainstem response; encoding model; neural tracking; running speech; subcortical; temporal response function.
Copyright © 2021 Bachmann, MacDonald and Hjortkjær.
Conflict of interest statement
The authors declare that this study received funding from Sonova, a major hearing care solutions company (FB). The funder was not involved in the study design, collection, analysis, interpretation of data, the writing of this article or the decision to submit it for publication. The authors declare that the research was conducted in the absence of other commercial or financial relationships that could be construed as a potential conflict of interest.
Figures
Similar articles
-
Subcortical rather than cortical sources of the frequency-following response (FFR) relate to speech-in-noise perception in normal-hearing listeners.Neurosci Lett. 2021 Feb 16;746:135664. doi: 10.1016/j.neulet.2021.135664. Epub 2021 Jan 23. Neurosci Lett. 2021. PMID: 33497718 Free PMC article.
-
Brainstem auditory responses to resolved and unresolved harmonics of a synthetic vowel in quiet and noise.Ear Hear. 2013 Jan-Feb;34(1):63-74. doi: 10.1097/AUD.0b013e31826119a1. Ear Hear. 2013. PMID: 22814487
-
Human Frequency Following Responses to Vocoded Speech.Ear Hear. 2017 Sep/Oct;38(5):e256-e267. doi: 10.1097/AUD.0000000000000432. Ear Hear. 2017. PMID: 28362674 Free PMC article.
-
Test-Retest Reliability of Dual-Recorded Brainstem versus Cortical Auditory-Evoked Potentials to Speech.J Am Acad Audiol. 2018 Feb;29(2):164-174. doi: 10.3766/jaaa.16167. J Am Acad Audiol. 2018. PMID: 29401063
-
A Home-Based Approach to Auditory Brainstem Response Measurement: Proof-of-Concept and Practical Guidelines.Semin Hear. 2022 Oct 26;43(3):177-196. doi: 10.1055/s-0042-1756163. eCollection 2022 Aug. Semin Hear. 2022. PMID: 36313050 Free PMC article. Review.
Cited by
-
Auditory Encoding of Natural Speech at Subcortical and Cortical Levels Is Not Indicative of Cognitive Decline.eNeuro. 2024 May 9;11(5):ENEURO.0545-23.2024. doi: 10.1523/ENEURO.0545-23.2024. Print 2024 May. eNeuro. 2024. PMID: 38658138 Free PMC article.
-
Comparing methods for deriving the auditory brainstem response to continuous speech in human listeners.Imaging Neurosci (Camb). 2025 Jun 3;3:IMAG.a.19. doi: 10.1162/IMAG.a.19. eCollection 2025. Imaging Neurosci (Camb). 2025. PMID: 40800859 Free PMC article.
-
Predictors for estimating subcortical EEG responses to continuous speech.PLoS One. 2024 Feb 8;19(2):e0297826. doi: 10.1371/journal.pone.0297826. eCollection 2024. PLoS One. 2024. PMID: 38330068 Free PMC article.
-
Neural speech tracking in a virtual acoustic environment: audio-visual benefit for unscripted continuous speech.Front Hum Neurosci. 2025 Apr 9;19:1560558. doi: 10.3389/fnhum.2025.1560558. eCollection 2025. Front Hum Neurosci. 2025. PMID: 40270565 Free PMC article.
-
Extending Subcortical EEG Responses to Continuous Speech to the Sound-Field.Trends Hear. 2024 Jan-Dec;28:23312165241246596. doi: 10.1177/23312165241246596. Trends Hear. 2024. PMID: 38738341 Free PMC article.
References
LinkOut - more resources
Full Text Sources