

Learning Cortical Parcellations Using Graph Neural Networks
- PMID: 35002611
- PMCID: PMC8739886
- DOI: 10.3389/fnins.2021.797500
Learning Cortical Parcellations Using Graph Neural Networks
Abstract
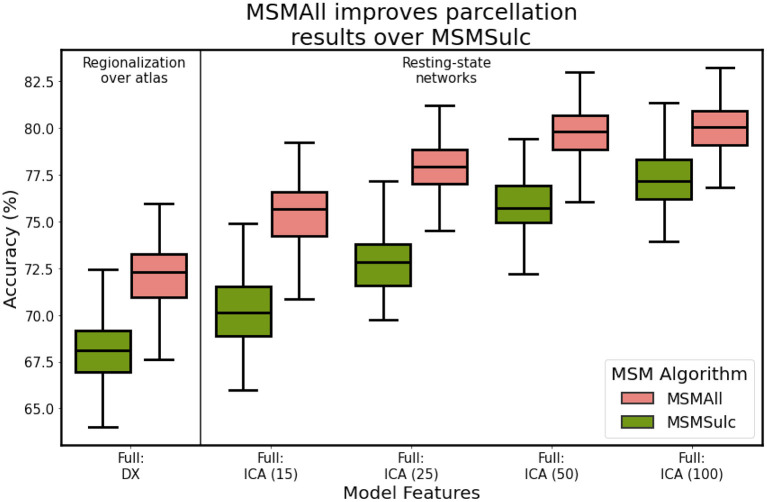
Deep learning has been applied to magnetic resonance imaging (MRI) for a variety of purposes, ranging from the acceleration of image acquisition and image denoising to tissue segmentation and disease diagnosis. Convolutional neural networks have been particularly useful for analyzing MRI data due to the regularly sampled spatial and temporal nature of the data. However, advances in the field of brain imaging have led to network- and surface-based analyses that are often better represented in the graph domain. In this analysis, we propose a general purpose cortical segmentation method that, given resting-state connectivity features readily computed during conventional MRI pre-processing and a set of corresponding training labels, can generate cortical parcellations for new MRI data. We applied recent advances in the field of graph neural networks to the problem of cortical surface segmentation, using resting-state connectivity to learn discrete maps of the human neocortex. We found that graph neural networks accurately learn low-dimensional representations of functional brain connectivity that can be naturally extended to map the cortices of new datasets. After optimizing over algorithm type, network architecture, and training features, our approach yielded mean classification accuracies of 79.91% relative to a previously published parcellation. We describe how some hyperparameter choices including training and testing data duration, network architecture, and algorithm choice affect model performance.
Keywords: brain; functional connectivity; graph neural network; human; parcellation; representation learning; segmentation.
Copyright © 2021 Eschenburg, Grabowski and Haynor.
Conflict of interest statement
The authors declare that the research was conducted in the absence of any commercial or financial relationships that could be construed as a potential conflict of interest.
Figures

Similar articles
-
Brain parcellation selection: An overlooked decision point with meaningful effects on individual differences in resting-state functional connectivity.Neuroimage. 2021 Nov;243:118487. doi: 10.1016/j.neuroimage.2021.118487. Epub 2021 Aug 19. Neuroimage. 2021. PMID: 34419594 Free PMC article.
-
Spatio-temporal directed acyclic graph learning with attention mechanisms on brain functional time series and connectivity.Med Image Anal. 2022 Apr;77:102370. doi: 10.1016/j.media.2022.102370. Epub 2022 Jan 30. Med Image Anal. 2022. PMID: 35144197
-
Application of improved graph convolutional network for cortical surface parcellation.Sci Rep. 2025 May 12;15(1):16409. doi: 10.1038/s41598-025-00116-0. Sci Rep. 2025. PMID: 40355465 Free PMC article.
-
GAT-LI: a graph attention network based learning and interpreting method for functional brain network classification.BMC Bioinformatics. 2021 Jul 22;22(1):379. doi: 10.1186/s12859-021-04295-1. BMC Bioinformatics. 2021. PMID: 34294047 Free PMC article.
-
Optimizing Connectivity-Driven Brain Parcellation Using Ensemble Clustering.Brain Connect. 2020 May;10(4):183-194. doi: 10.1089/brain.2019.0722. Brain Connect. 2020. PMID: 32264696 Free PMC article.
Cited by
-
Longitudinally consistent registration and parcellation of cortical surfaces using semi-supervised learning.Med Image Anal. 2024 Aug;96:103193. doi: 10.1016/j.media.2024.103193. Epub 2024 May 7. Med Image Anal. 2024. PMID: 38823362 Free PMC article.
-
An Agent-Based Model to Reproduce the Boolean Logic Behaviour of Neuronal Self-Organised Communities through Pulse Delay Modulation and Generation of Logic Gates.Biomimetics (Basel). 2024 Feb 9;9(2):101. doi: 10.3390/biomimetics9020101. Biomimetics (Basel). 2024. PMID: 38392147 Free PMC article.
-
Review of the Brain's Behaviour after Injury and Disease for Its Application in an Agent-Based Model (ABM).Biomimetics (Basel). 2024 Jun 14;9(6):362. doi: 10.3390/biomimetics9060362. Biomimetics (Basel). 2024. PMID: 38921242 Free PMC article. Review.
-
Predicting in vitro single-neuron firing rates upon pharmacological perturbation using Graph Neural Networks.Front Neuroinform. 2023 Jan 11;16:1032538. doi: 10.3389/fninf.2022.1032538. eCollection 2022. Front Neuroinform. 2023. PMID: 36713289 Free PMC article.
-
Jumping knowledge graph attention network for resource allocation in wireless cellular system.Sci Rep. 2025 May 20;15(1):17459. doi: 10.1038/s41598-025-00603-4. Sci Rep. 2025. PMID: 40394054 Free PMC article.
References
LinkOut - more resources
Full Text Sources