. 2021 Dec 23:15:818242.
doi: 10.3389/fnana.2021.818242. eCollection 2021.

A Whole-Brain Connectivity Map of VTA and SNc Glutamatergic and GABAergic Neurons in Mice

Affiliations

A Whole-Brain Connectivity Map of VTA and SNc Glutamatergic and GABAergic Neurons in Mice

Sile An et al. Front Neuroanat. .

Abstract

The glutamatergic and GABAergic neurons in the ventral tegmental area (VTA) and substantia nigra pars compacta (SNc) mediated diverse brain functions. However, their whole-brain neural connectivity has not been comprehensively mapped. Here we used the virus tracers to characterize the whole-brain inputs and outputs of glutamatergic and GABAergic neurons in VTA and SNc. We found that these neurons received similar inputs from upstream brain regions, but some quantitative differences were also observed. Neocortex and dorsal striatum provided a greater share of input to VTA glutamatergic neurons. Periaqueductal gray and lateral hypothalamic area preferentially innervated VTA GABAergic neurons. Specifically, superior colliculus provided the largest input to SNc glutamatergic neurons. Compared to input patterns, the output patterns of glutamatergic and GABAergic neurons in the VTA and SNc showed significant preference to different brain regions. Our results laid the anatomical foundation for understanding the functions of cell-type-specific neurons in VTA and SNc.

Keywords: cell-type-specific; substantia nigra pars compacta (SNc); three-dimension; ventral tegmental area (VTA); virus tracers; whole brain.


Conflict of interest statement

The authors declare that the research was conducted in the absence of any commercial or financial relationships that could be construed as a potential conflict of interest.

Figures

FIGURE 1
FIGURE 1
Identification of whole-brain inputs and outputs of glutamatergic and GABAergic neurons in VTA and SNc. (A) Design of viral vectors and injection procedure for RV-mediated transsynaptic retrograde tracing. (B) Design of viral vector and injection procedure for tracing VTA and SNc output projections. (C) Main steps for data generation and processing.
FIGURE 2
FIGURE 2
Whole-brain monosynaptic inputs to glutamatergic and GABAergic neurons in VTA and SNc. (A) Schematic coronal sections showing labeling of monosynaptic inputs to glutamatergic and GABAergic neurons in VTA and SNc (hereafter called VTA GLU, VTA GABA, SNc GLU, and SNc GABA neurons). One dot represents one neuron. (B) 3D visualization of whole-brain monosynaptic inputs to glutamatergic and GABAergic neurons in VTA and SNc from different view. (C) Numbers of transsynaptically labeled neurons (“input neurons”), each row represents the input neurons in each mouse. (D) Whole-brain distribution of all input neurons along the A-P axis. Colored lines, input distribution for the individual mouse; colored line with the shaded area under it, average input distribution.
FIGURE 3
FIGURE 3
Whole-brain monosynaptic inputs to glutamatergic and GABAergic neurons in VTA and SNc in nine brain areas. (A) 3D visualization of whole-brain monosynaptic inputs to glutamatergic and GABAergic neurons in VTA and SNc in nine brain areas. M, medial; L, lateral; D, dorsal; V, ventral. (B) Proportions of total inputs from nine brain areas. Mean ± SEM (n = 5 mice each for the VTA GLU, VTA GABA, SNc GLU, and SNc GABA groups). ***p < 0.001 and *p < 0.05. Only significant differences between the same cell type in different brain areas or between cell types in the same brain areas are marked; one-way ANOVA followed by Tukey’s post hoc tests. The percentages of inputs in nine brain areas are listed in Supplementary Data 1.
FIGURE 4
FIGURE 4
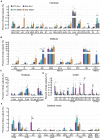
Quantitative comparisons of whole-brain input to glutamatergic and GABAergic neurons in VTA and SNc in individual brain regions. (A) Proportions of total inputs from interbrain region. (B) Proportions of total inputs from midbrain region. (C) Proportions of total inputs from hindbrain region. (D) Proportions of total inputs from cortex region. (E) Proportions of total inputs from cerebral nuclei region. Mean ± SEM (n = 5 mice each for the VTA GLU, VTA GABA, SNc GLU, and SNc GABA groups). ***p < 0.001, **p < 0.01, and *p < 0.05. Only significant differences between the same cell type in different brain regions or between cell types in the same brain regions are marked; one-way ANOVA followed by Tukey’s post hoc tests. Abbreviations of the 67 brain regions and their percentages of inputs are listed in Supplementary Table 1 and Data 1.
FIGURE 5
FIGURE 5
Whole-brain outputs of glutamatergic and GABAergic neurons in VTA and SNc. (A) 3D visualization of whole-brain output projections of the glutamatergic and GABAergic neurons in VTA and SNc from different view. (B) Proportions of output projections from nine brain areas. Mean ± SEM (n = 5 mice each for the VTA GABA and SNc GLU groups, n = 4 mice for the VTA GLU and SNc GABA). ***p < 0.001 and **p < 0.01. Only significant differences between the same cell type in different brain areas or between cell types in the same brain areas are marked; one-way ANOVA with Bonferroni correction. The percentages of outputs in nine brain areas are listed in Supplementary Data 2.
FIGURE 6
FIGURE 6
Quantitative analysis of whole-brain output projections to glutamatergic and GABAergic neurons in VTA and SNc. (A) Proportions of total outputs in interbrain region. (B) Proportions of total outputs in midbrain region. (C) Proportions of total outputs in hindbrain region. (D) Proportions of total outputs in cortex region. (E) Proportions of total outputs in cerebral nuclei region. Mean ± SEM (n = 5 mice each for the VTA GABA and SNc GLU groups, n = 4 mice each for the VTA GLU and SNc GABA groups). **p < 0.01 and *p < 0.05. Only significant differences between the same cell type in different brain regions or between cell types in the same brain regions are marked; one-way ANOVA with Bonferroni correction. Abbreviations of the 61 brain regions and their percentages of outputs are listed in Supplementary Table 1 and Data 2.
FIGURE 7
FIGURE 7
Comparisons of input and output distributions. (A) Matrix of correlation coefficients (CCs) between input distributions of each pair of cell types. CCs were computed at the spatial scale of the 67 major brain regions (Supplementary Data 1). (B) CCs between output distributions of each pair of cell types. CCs were computed at the spatial scale of the 61 major brain regions (Supplementary Data 2). (C) CCs between input and output distributions. CCs were computed at the spatial scale of the 54 major brain regions (Supplementary Data 2). (D) Patterns of Pearson’s correlation coefficient values and cluster trees showing the dissimilarities for the inputs of glutamatergic and GABAergic neurons in VTA and SNc. (E) Patterns of Pearson’s correlation coefficient values and cluster trees showing the dissimilarities for the outputs of glutamatergic and GABAergic neurons in VTA and SNc.

Similar articles

Cited by

References

    1. Barbano M. F., Wang H. L., Morales M., Wise R. A. (2016). Feeding and reward are differentially induced by activating GABAergic lateral hypothalamic projections to VTA. J. Neurosci. 36 2975–2985. 10.1523/JNEUROSCI.3799-15.2016 - DOI - PMC - PubMed
    1. Barbano M. F., Wang H. L., Zhang S., Miranda-Barrientos J., Estrin D. J., Figueroa-Gonzalez A., et al. (2020). VTA glutamatergic neurons mediate innate defensive behaviors. Neuron 107 368.e8–382.e8. 10.1016/j.neuron.2020.04.024 - DOI - PMC - PubMed
    1. Beier K. T., Steinberg E. E., DeLoach K. E., Xie S., Miyamichi K., Schwarz L., et al. (2015). Circuit architecture of VTA dopamine neurons revealed by systematic input-output mapping. Cell 162 622–634. 10.1016/j.cell.2015.07.015 - DOI - PMC - PubMed
    1. Blacktop J. M., Sorg B. A. (2019). Perineuronal nets in the lateral hypothalamus area regulate cue-induced reinstatement of cocaine-seeking behavior. Neuropsychopharmacology 44 850–858. 10.1038/s41386-018-0212-8 - DOI - PMC - PubMed
    1. Brown M. T., Tan K. R., O’Connor E. C., Nikonenko I., Muller D., Luscher C. (2012). Ventral tegmental area GABA projections pause accumbal cholinergic interneurons to enhance associative learning. Nature 492 452–456. 10.1038/nature11657 - DOI - PubMed