. 2021 Dec 24:15:762970.
doi: 10.3389/fnhum.2021.762970. eCollection 2021.

Altered Processing of Visual Stimuli in Vestibular Migraine Patients Between Attacks: A Combined VEP and sLORETA Study

Affiliations

Altered Processing of Visual Stimuli in Vestibular Migraine Patients Between Attacks: A Combined VEP and sLORETA Study

Jiahao Liu et al. Front Hum Neurosci. .

Abstract

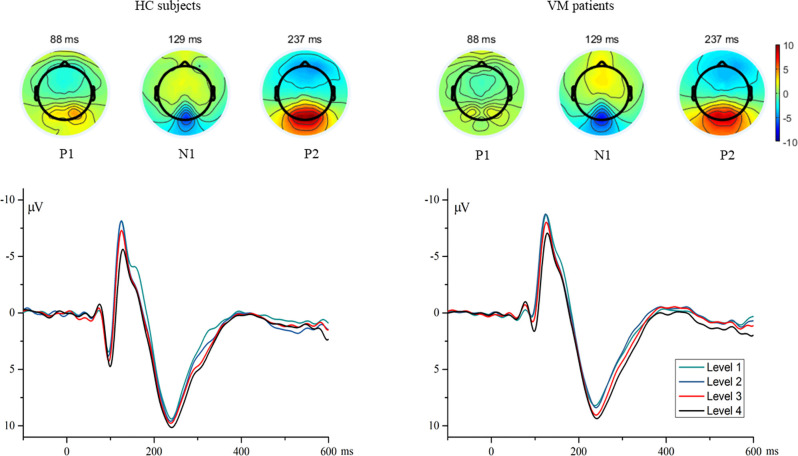
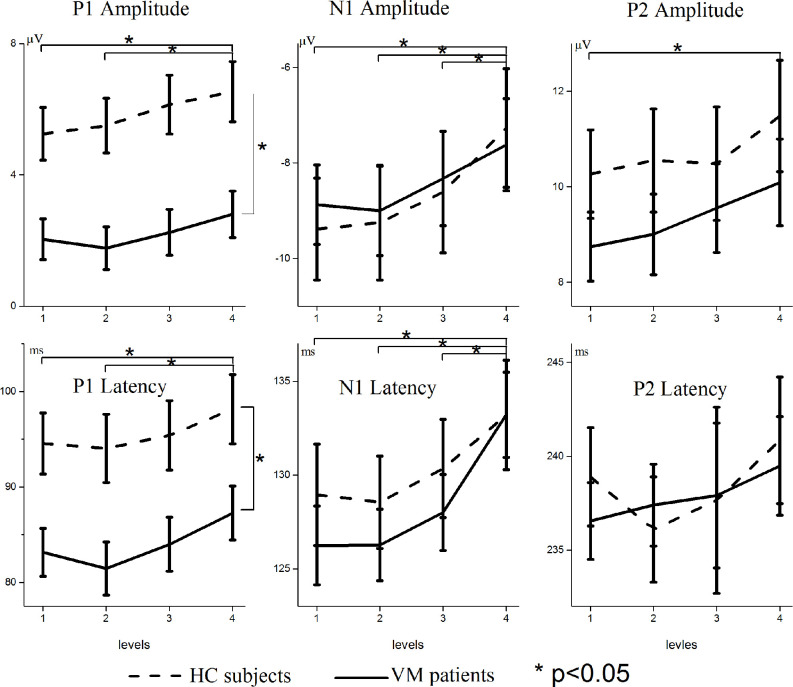
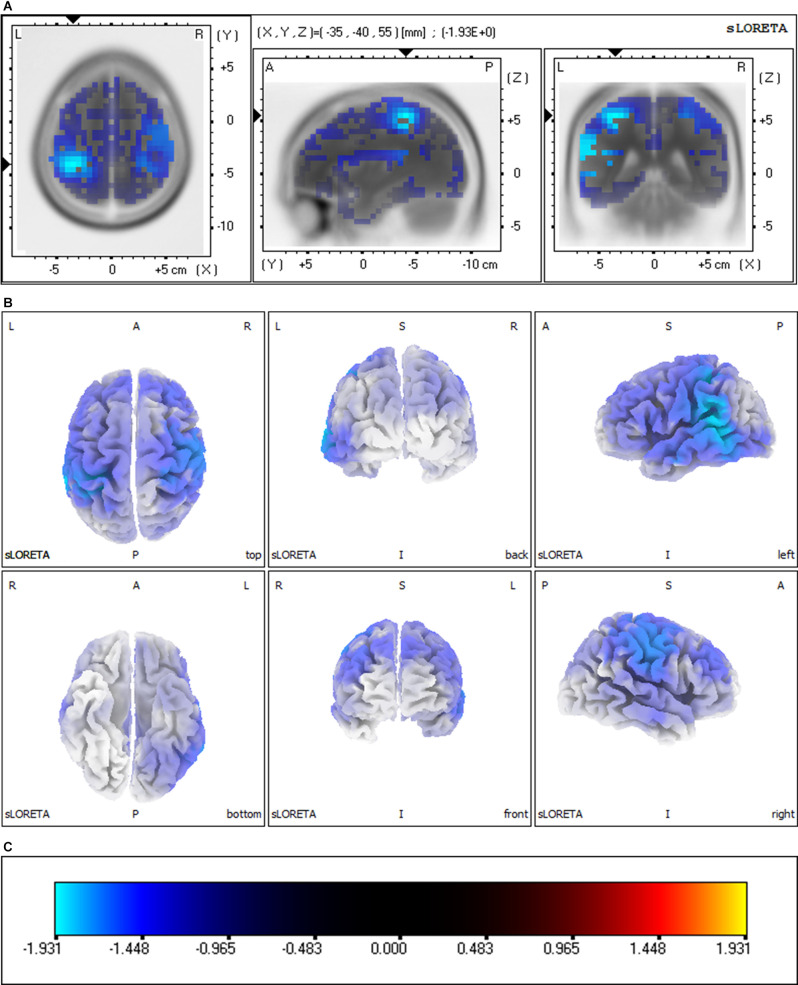
Objective: Vestibular migraine (VM) is one of the most common causes of recurrent vertigo, but the neural mechanisms that mediate such symptoms remain unknown. Since visual symptoms and photophobia are common clinical features of VM patients, we hypothesized that VM patients have abnormally sensitive low-level visual processing capabilities. This study aimed to investigate cortex abnormalities in VM patients using visual evoked potential (VEP) and standardized low-resolution brain electromagnetic tomography (sLORETA) analysis. Methods: We employed visual stimuli consisting of reversing displays of circular checkerboard patterns to examine "low-level" visual processes. Thirty-three females with VM and 20 healthy control (HC) females underwent VEP testing. VEP components and sLORETA were analyzed. Results: Patients with VM showed significantly lower amplitude and decreased latency of P1 activation compared with HC subjects. Further topographic mapping analysis revealed a group difference in the occipital area around P1 latency. sLORETA analysis was performed in the time frame of the P1 component and showed significantly less activity (deactivation) in VM patients in the frontal, parietal, temporal, limbic, and occipital lobes, as well as sub-lobar regions. The maximum current density difference was in the postcentral gyrus of the parietal lobe. P1 source density differences between HC subjects and VM patients overlapped with the vestibular cortical fields. Conclusion: The significantly abnormal response to visual stimuli indicates altered processing in VM patients. These findings suggest that abnormalities in vestibular cortical fields might be a pathophysiological mechanism of VM.

Keywords: cortex abnormalities; neural mechanism; sLORETA; vestibular migraine; visual evoked potential.


Conflict of interest statement

The authors declare that the research was conducted in the absence of any commercial or financial relationships that could be construed as a potential conflict of interest.

Figures

Figure 1
Figure 1
The topographies show the P1 (88 ms), N1 (129 ms), and P2 (237 ms) VEP and are given separately for HC subjects and VM patients. Grand average VEP waveforms recorded at channel Oz are shown for different luminance ratios (Levels 1–4). Levels 1 and 4 refer to the smallest (12.5%) and largest (50%) proportions of white pixels in the stimulus pattern, respectively. VEP, visual evoked potential; HC, healthy control; VM, vestibular migraine.
Figure 2
Figure 2
Modulation of scalp-recorded VEPs across different luminance ratios. The amplitudes and latencies of the P1, N1, and P2 VEPs are shown separately for VM patients (solid line) and HC subjects (dashed line). Levels 1 and 4 refer to the smallest (12.5%) and largest (50%) proportions of white pixels in the stimulus pattern, respectively. Asterisks indicate significant differences between VM patients and HC subjects (p < 0.05). Note the different scaling for different VEP components.
Figure 3
Figure 3
Significant group comparisons of the sLORETA source imaging between the VM and HC groups. Regions with significant differences between groups are shown in three MRI views of the head (A) and 3D brain map views (B). The color scale (C) represents log-F ratio values (threshold: log-F = 0.836, p < 0.01, two-tailed). The difference in current density maximum was highest in the postcentral gyrus of the parietal lobe [MNI coordinates (x, y, z = −35, −40, 55), BA 40; logF = −1.93, p < 0.001]. L, left; R, right; A, anterior; P, posterior; BA, Brodmann area.
Figure 4
Figure 4
Schematic brain representations illustrating the topography of the vestibular cortical fields experimentally identified in humans. The numbers indicate the architectonically defined BAs [based on Gray’s (1918) Anatomy of the Human Body]. The letters represent the vestibular sites with their localization in the cortical regions in the right panel (Ventre-Dominey, 2014).

References

    1. Beh S. C. (2019). Vestibular migraine: how to sort it out and what to do about it. J. Neuroophthalmol. 39, 208–219. 10.1097/WNO.0000000000000791 - DOI - PubMed
    1. Beh S. C., Masrour S., Smith S. V., Friedman D. I. (2019). The spectrum of vestibular migraine: clinical features, triggers and examination findings. Headache 59, 727–740. 10.1111/head.13484 - DOI - PubMed
    1. de Tommaso M., Ambrosini A., Brighina F., Coppola G., Perrotta A., Pierelli F., et al. . (2014). Altered processing of sensory stimuli in patients with migraine. Nat. Rev. Neurol. 10, 144–155. 10.1038/nrneurol.2014.14 - DOI - PubMed
    1. Espinosa-Sanchez J. M., Lopez-Escamez J. A. (2015). New insights into pathophysiology of vestibular migraine. Front. Neurol. 6:12. 10.3389/fneur.2015.00012 - DOI - PMC - PubMed
    1. Fort A., Besle J., Giard M. H., Pernier J. (2005). Task-dependent activation latency in human visual extrastriate cortex. Neurosci. Lett. 379, 144–148. 10.1016/j.neulet.2004.12.076 - DOI - PubMed

LinkOut - more resources