. 2021 Dec 24:12:777080.
doi: 10.3389/fendo.2021.777080. eCollection 2021.

Feasibility of an Inversion Recovery-Prepared Fat-Saturated Zero Echo Time Sequence for High Contrast Imaging of the Osteochondral Junction

Affiliations

Feasibility of an Inversion Recovery-Prepared Fat-Saturated Zero Echo Time Sequence for High Contrast Imaging of the Osteochondral Junction

Hyungseok Jang et al. Front Endocrinol (Lausanne). .

Abstract

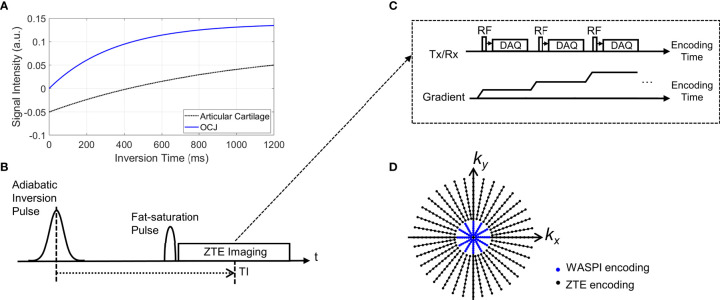
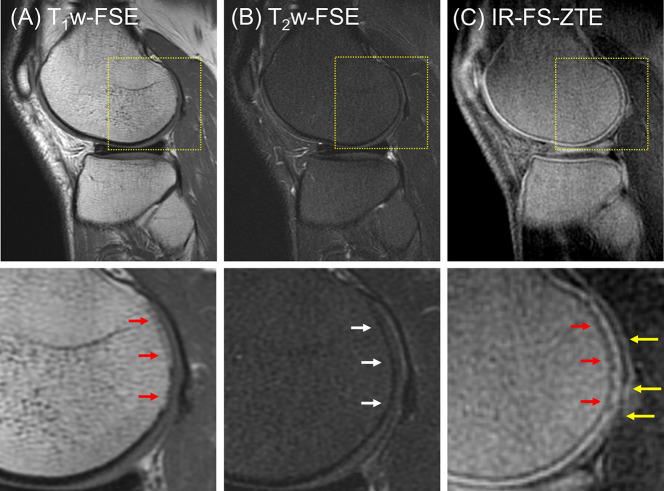
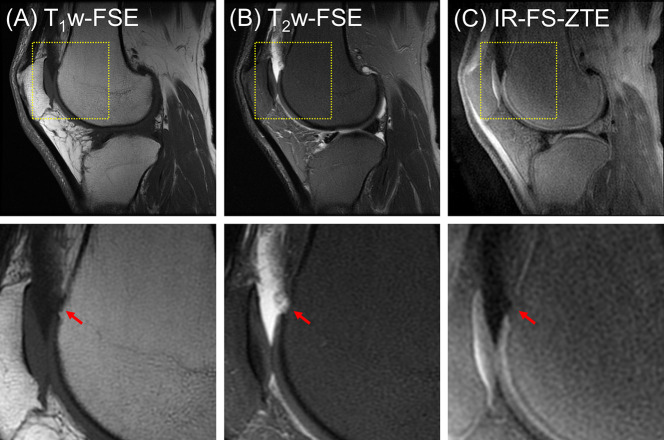
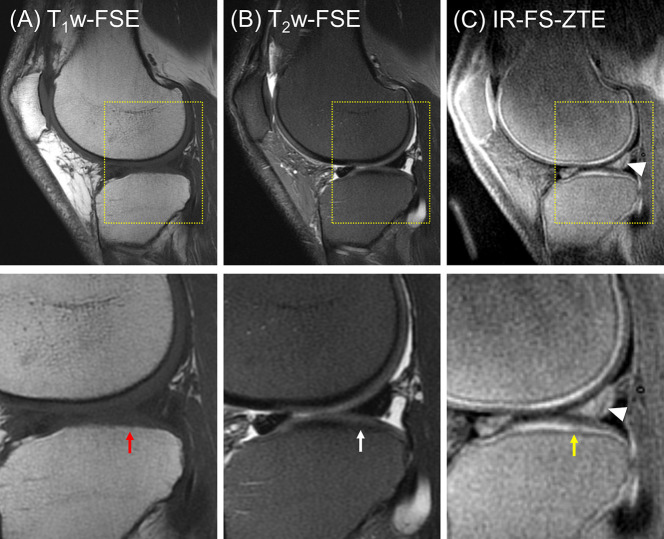
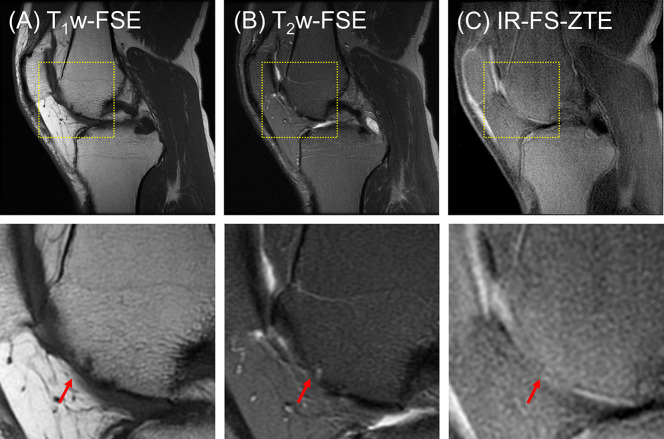
Purpose: The osteochondral junction (OCJ) region-commonly defined to include the deep radial uncalcified cartilage, tidemark, calcified cartilage, and subchondral bone plate-functions to absorb mechanical stress and is commonly associated with the pathogenesis of osteoarthritis. However, magnetic resonance imaging of the OCJ region is difficult due to the tissues' short transverse relaxation times (i.e., short T2 or T2*), which result in little or no signal with conventional MRI. The goal of this study is to develop a 3D adiabatic inversion recovery prepared fat saturated zero echo time (IR-FS-ZTE) sequence for high-contrast imaging of the OCJ.

Method: An IR-FS-ZTE MR sequence was developed to image the OCJ on a clinical 3T MRI scanner. The IR-FS-ZTE sequence employed an adiabatic inversion pulse followed by a fat saturation pulse that suppressed signals from the articular cartilage and fat. At an inversion time (TI) that was matched to the nulling point of the articular cartilage, continuous ZTE imaging was performed with a smoothly rotating readout gradient, which enabled time-efficient encoding of the OCJ region's short T2 signal with a minimal echo time (TE) of 12 μs. An ex vivo experiment with six cadaveric knee joints, and an in vivo experiment with six healthy volunteers and three patients with OA were performed to evaluate the feasibility of the proposed approach for high contrast imaging of the OCJ. Contrast-to-noise ratios (CNRs) between the OCJ and its neighboring femoral and tibial cartilage were measured.

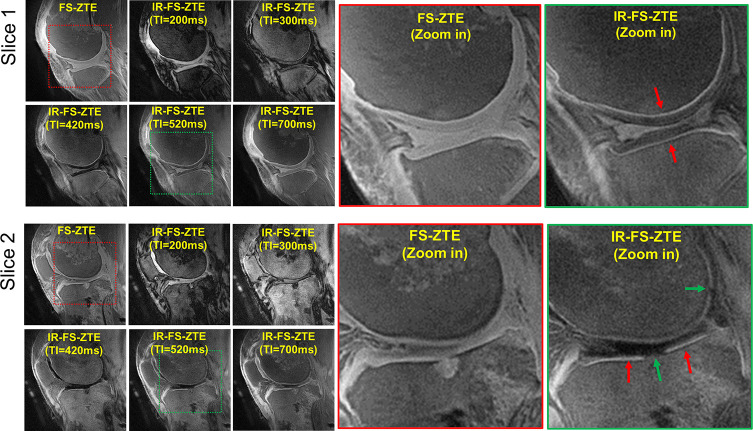
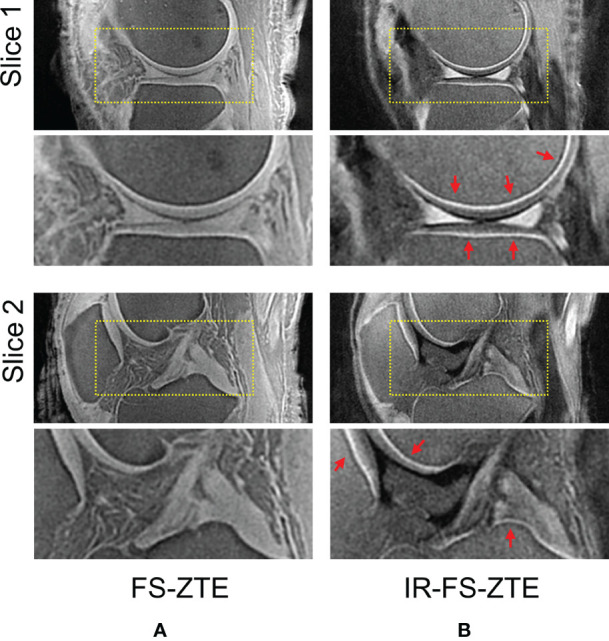
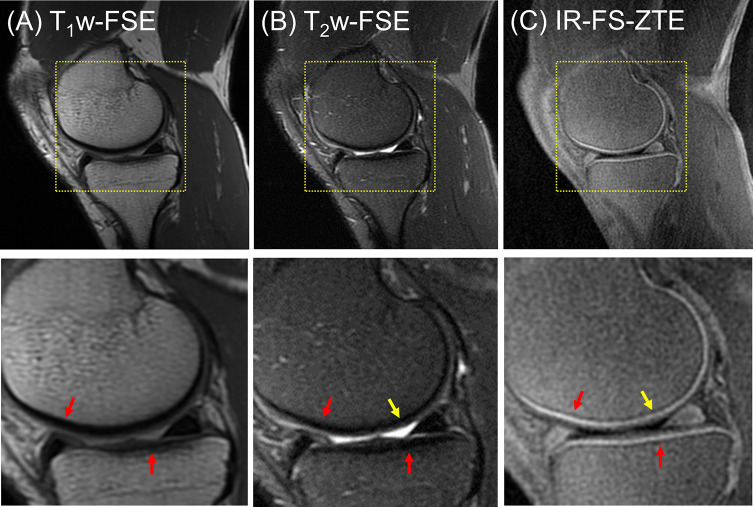
Results: In the ex vivo experiment, IR-FS-ZTE produced improved imaging of the OCJ region over the clinical sequences, and significantly improved the contrast compared to FS-ZTE without IR preparation (p = 0.0022 for tibial cartilage and p = 0.0019 for femoral cartilage with t-test). We also demonstrated the feasibility of high contrast imaging of the OCJ region in vivo using the proposed IR-FS-ZTE sequence, thereby providing more direct information on lesions in the OCJ. Clinical MRI did not detect signal from OCJ due to the long TE (>20 ms).

Conclusion: IR-FS-ZTE allows direct imaging of the OCJ region of the human knee and may help in elucidating the role of the OCJ in cartilage degeneration.

Keywords: UTE; ZTE; cartilage; inversion recovery; osteoarthritis; osteochondral junction.


Conflict of interest statement

MC was an employee of GE Healthcare. The remaining authors declare that the research was conducted in the absence of any commercial or financial relationships that could be construed as a potential conflict of interest.

Figures

Figure 1
Figure 1
Pulse sequence diagram for IR-FS-ZTE. (A) An example of typical inversion recovery with an adiabatic inversion pulse, (B) signal preparation, (C) ZTE imaging, and (D) a 2D example of the k-space trajectory (black dots: high-resolution ZTE encoding, blue dots: low-resolution WASPI encoding). As shown in (B), the adiabatic inversion pulse is followed by a fat saturation pulse that simultaneously suppresses the water signal (which has a long T2 relaxation time) and fat signal, which improves contrast and dynamic range of the targeted OCJ region.
Figure 2
Figure 2
Ex vivo experiment with a knee joint sample (from a 71-year-old male donor). Two representative slices are shown to demonstrate the efficacy of inversion recovery preparation in OCJ imaging. IR-FS-ZTE with a TI of 520 ms shows the best image contrast, where the OCJ is well-delineated and represented by a bright line (red arrows), which is not obvious in FS-ZTE without inversion recovery preparation. Complete-thickness cartilage erosions involving the OCJ in the tibial plateau and posterior femoral condyle are better seen on the IR-FS-ZTE sequence compared to the FS-ZTE sequence, visualized as interruption of the bright line (green arrows).
Figure 3
Figure 3
Ex vivo experiment with a knee joint sample (from a 48-year-old male donor). Two representative slices with (A) FS-ZTE and (B) IR-FS-ZTE. IR-FS-ZTE shows improved OCJ contrast compared to FS-ZTE, as indicated by red arrows and represented by the bright line.
Figure 4
Figure 4
A healthy volunteer (35-year-old male). (A) T1w-FSE, (B) T2w-FSE, and (C) IR-FS-ZTE images (top) and the corresponding zoomed-in images (bottom). The short T2 signal from the OCJ region is resolved with high contrast in IR-FS-ZTE imaging (C), while the signal is not captured at all by the conventional clinical MR imaging sequences (A, B), as indicated by red arrows. The joint fluid with long T1 and T2 appears bright in T2-FSE imaging, but dark in IR-FS-ZTE imaging (yellow arrow).
Figure 5
Figure 5
A patient with OA (47-year-old male). (A) T1w-FSE, (B) T2w-FSE, and (C) IR-FS-ZTE images (top) and the corresponding zoomed-in images (bottom). The T1w-FSE sequence shows only subtle subchondral bone irregularities in the posterior region of the femoral condyle (red arrows). The T2w-FSE sequence cannot detect subchondral or cartilage abnormalities (white arrows). The IR-FS-ZTE sequence, however, can show both subchondral bone and cartilage abnormalities (red and yellow arrows).
Figure 6
Figure 6
A patient with OA (56-year-old male). (A) T1w-FSE, (B) T2w-FSE, and (C) IR-FS-ZTE images (top) and their corresponding zoomed-in images (bottom). Regional loss of OCJ is well-delineated with IR-FS-ZTE (C), whereas the lesion is obscured in clinical images (A, B), as indicated by red arrows.
Figure 7
Figure 7
A patient with OA (56-year-old male). (A) T1w-FSE, (B) T2w-FSE, and (C) IR-FS-ZTE images (top) and the corresponding zoomed-in images (bottom). The T1w- and T2w-FSE sequences do not show any evident abnormality in the interface between the cartilage and subchondral bone in the lateral tibial plateau (red and white arrows), whereas the IR-FS-ZTE sequence highlights the OCJ, allowing for the visualization of a small signal abnormality in the deep cartilage (yellow arrow) as well as the altered signal in the posterior horn of the lateral meniscus (white arrowheads).
Figure 8
Figure 8
A patient with OA (53-year-old male). (A) T1w-FSE, (B) T2w-FSE, and (C) IR-FS-ZTE images (top) and the corresponding zoomed-in images (bottom). Focal complete-thickness cartilage erosion involving the OCJ and represented by interruption of the bright line in the femoral trochlea is detected in the IR-FS-ZTE image (C), whereas the clinical images provide only indirect information of the lesion due to poor contrast for the OCJ region (A, B), as indicated by red arrows.

References

    1. Lawrence RC, Felson DT, Helmick CG, Arnold LM, Choi H, Deyo RA, et al. Estimates of the Prevalence of Arthritis and Other Rheumatic Conditions in the United States: Part Ii. Arthritis Rheumatol (2008) 58:26–35. doi: 10.1002/art.23176 - DOI - PMC - PubMed
    1. Suri S, Gill SE, Massena de Camin S, McWilliams DF, Wilson D, Walsh DA. Neurovascular Invasion at the Osteochondral Junction and in Osteophytes in Osteoarthritis. Ann Rheumatol Dis (2007) 66:1423–8. doi: 10.1136/ard.2006.063354 - DOI - PMC - PubMed
    1. Walsh DA, McWilliams DF, Turley MJ, Dixon MR, Franses RE, Mapp PI, et al. Angiogenesis and Nerve Growth Factor at the Osteochondral Junction in Rheumatoid Arthritis and Osteoarthritis. Rheumatology (2010) 49:1852–61. doi: 10.1093/rheumatology/keq188 - DOI - PMC - PubMed
    1. Mapp PI, Walsh DA. Mechanisms and Targets of Angiogenesis and Nerve Growth in Osteoarthritis. Nat Rev Rheumatol (2012) 8:390–8. doi: 10.1038/nrrheum.2012.80 - DOI - PubMed
    1. Mosher TJ, Dardzinski BJ, Smith MB. Human Articular Cartilage: Influence of Aging and Early Symptomatic Degeneration on the Spatial Variation of T2—Preliminary Findings at 3 T. Radiology (2000) 214:259–66. doi: 10.1148/radiology.214.1.r00ja15259 - DOI - PubMed

Publication types