

Bacterial Signatures of Paediatric Respiratory Disease: An Individual Participant Data Meta-Analysis
- PMID: 35002989
- PMCID: PMC8733647
- DOI: 10.3389/fmicb.2021.711134
Bacterial Signatures of Paediatric Respiratory Disease: An Individual Participant Data Meta-Analysis
Abstract
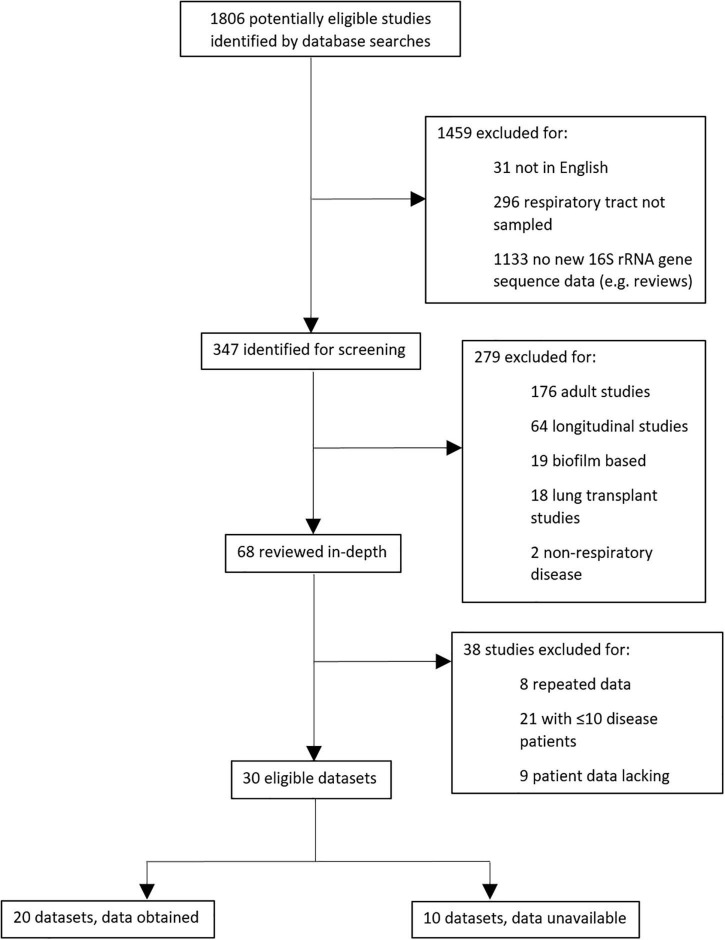
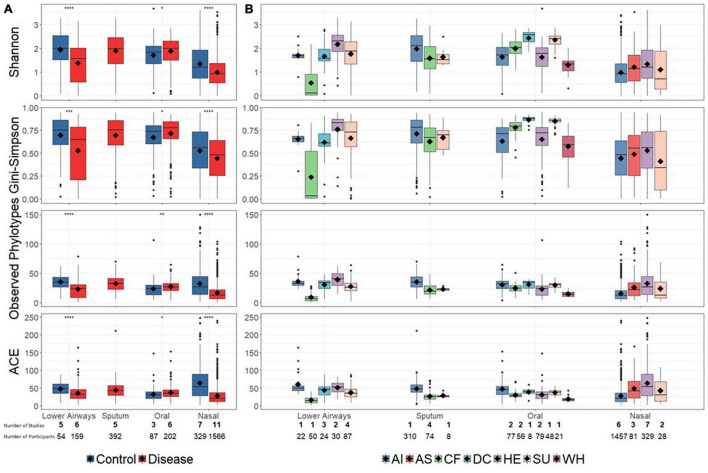
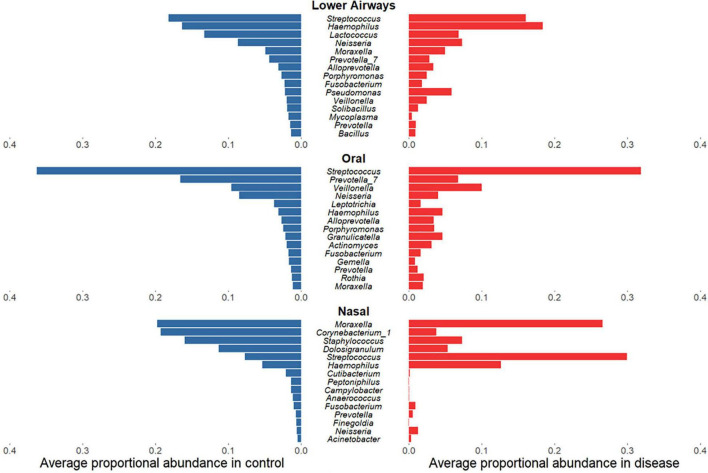
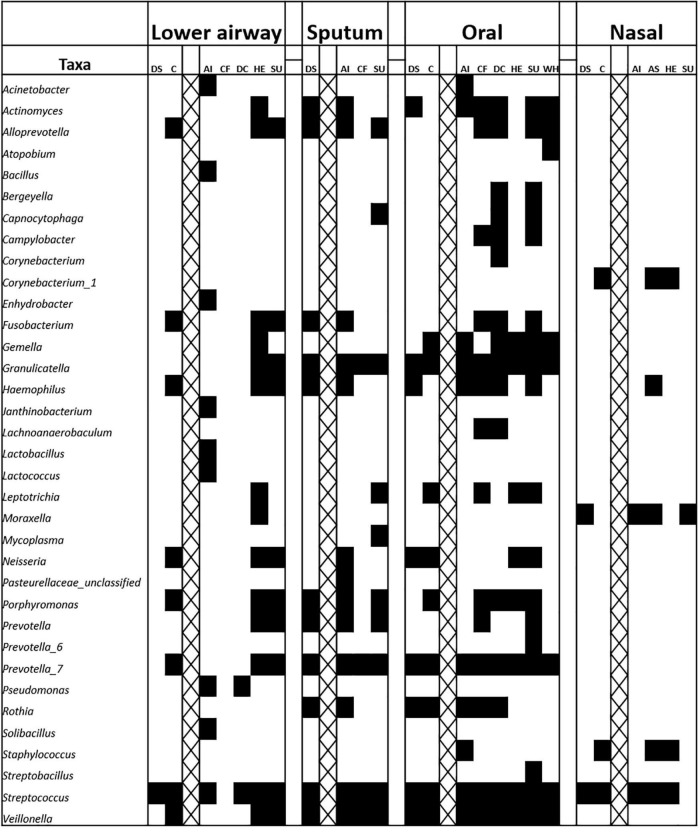
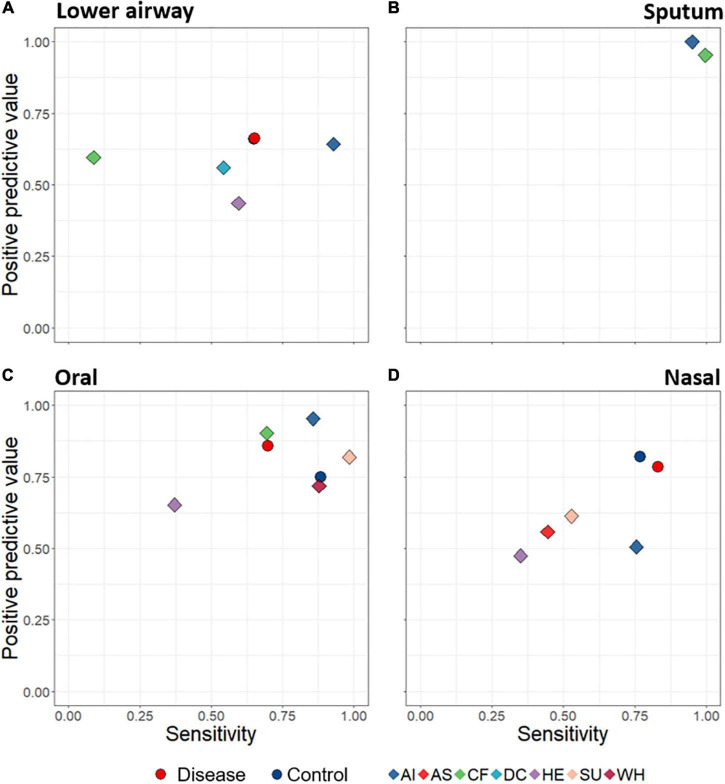
Introduction: The airway microbiota has been linked to specific paediatric respiratory diseases, but studies are often small. It remains unclear whether particular bacteria are associated with a given disease, or if a more general, non-specific microbiota association with disease exists, as suggested for the gut. We investigated overarching patterns of bacterial association with acute and chronic paediatric respiratory disease in an individual participant data (IPD) meta-analysis of 16S rRNA gene sequences from published respiratory microbiota studies. Methods: We obtained raw microbiota data from public repositories or via communication with corresponding authors. Cross-sectional analyses of the paediatric (<18 years) microbiota in acute and chronic respiratory conditions, with >10 case subjects were included. Sequence data were processed using a uniform bioinformatics pipeline, removing a potentially substantial source of variation. Microbiota differences across diagnoses were assessed using alpha- and beta-diversity approaches, machine learning, and biomarker analyses. Results: We ultimately included 20 studies containing individual data from 2624 children. Disease was associated with lower bacterial diversity in nasal and lower airway samples and higher relative abundances of specific nasal taxa including Streptococcus and Haemophilus. Machine learning success in assigning samples to diagnostic groupings varied with anatomical site, with positive predictive value and sensitivity ranging from 43 to 100 and 8 to 99%, respectively. Conclusion: IPD meta-analysis of the respiratory microbiota across multiple diseases allowed identification of a non-specific disease association which cannot be recognised by studying a single disease. Whilst imperfect, machine learning offers promise as a potential additional tool to aid clinical diagnosis.
Keywords: individual participant data (IPD) meta-analysis; meta-analysis; microbiota (16S); paediatrics; respiratory infection; respiratory tract.
Copyright © 2021 Broderick, Waite, Marsh, Camargo, Cardenas, Chang, Cookson, Cuthbertson, Dai, Everard, Gervaix, Harris, Hasegawa, Hoffman, Hong, Josset, Kelly, Kim, Kong, Li, Mansbach, Mejias, O’Toole, Paalanen, Pérez-Losada, Pettigrew, Pichon, Ramilo, Ruokolainen, Sakwinska, Seed, van der Gast, Wagner, Yi, Zemanick, Zheng, Pillarisetti and Taylor.
Conflict of interest statement
MPi reports personal fees from Mérieux Université, grants from Abacus Diagnostica, outside the submitted work. AM reports grants and personal fees from Janssen, personal fees from Merck, personal fees from Sanofi-Pasteur, personal fees from Roche, outside the submitted work. EZ reports grants and personal fees from Cystic Fibrosis Foundation, outside the submitted work. OS is an employee of Nestlé Research – Societé des Produits Nestlé S.A. The remaining authors declare that the research was conducted in the absence of any commercial or financial relationships that could be construed as a potential conflict of interest.
Figures
References
-
- Biesbroek G., Tsivtsivadze E., Sanders E. A., Montijn R., Veenhoven R. H., Keijser B. J., et al. (2014). Early respiratory microbiota composition determines bacterial succession patterns and respiratory health in children. Am. J. Respir. Crit. Care Med. 190 1283–1292. 10.1164/rccm.201407-1240oc - DOI - PubMed
-
- Bui D. S., Lodge C. J., Burgess J. A., Lowe A. J., Perret J., Bui M. Q., et al. (2018). Childhood predictors of lung function trajectories and future COPD risk: a prospective cohort study from the first to the sixth decade of life. Lancet Respir. Med. 6 535–544. 10.1016/S2213-2600(18)30100-0 - DOI - PubMed
Grants and funding
LinkOut - more resources
Full Text Sources
Medical