. 2021 Dec 24:12:784841.
doi: 10.3389/fmicb.2021.784841. eCollection 2021.

Bacteriome of Moist Smokeless Tobacco Products Consumed in India With Emphasis on the Predictive Functional Potential

Affiliations

Bacteriome of Moist Smokeless Tobacco Products Consumed in India With Emphasis on the Predictive Functional Potential

Mohammad Sajid et al. Front Microbiol. .

Abstract

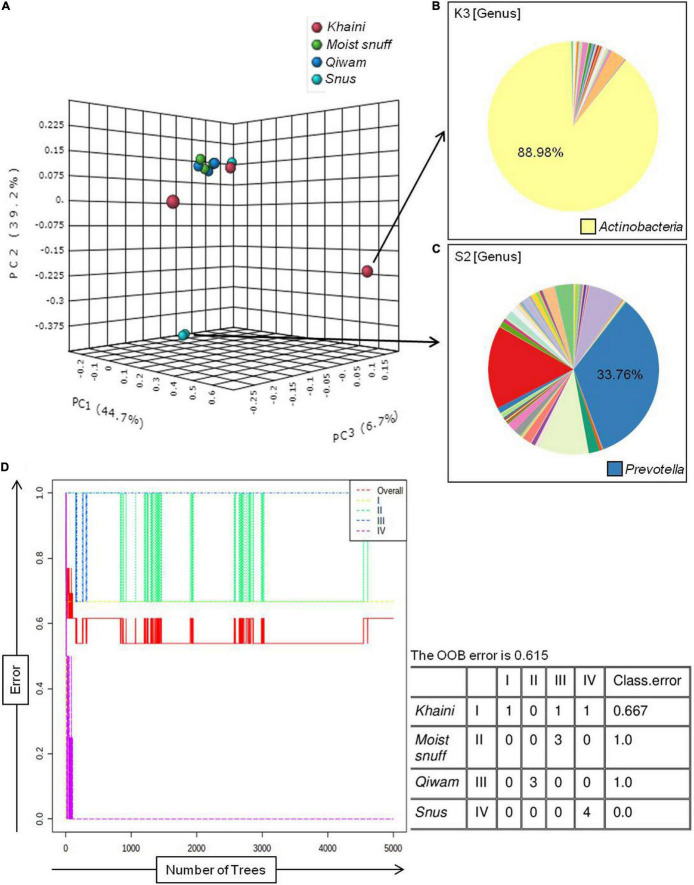
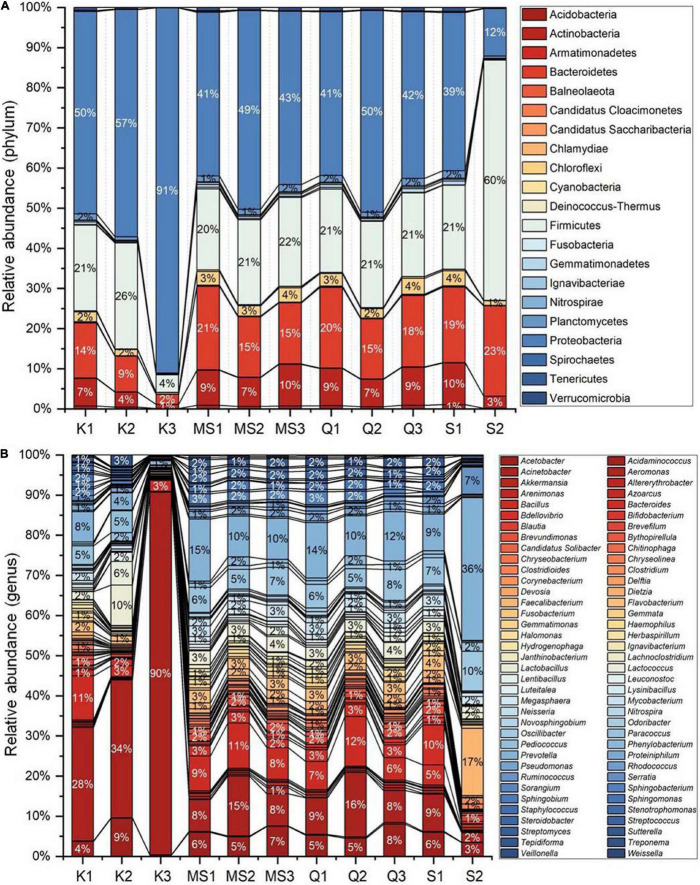
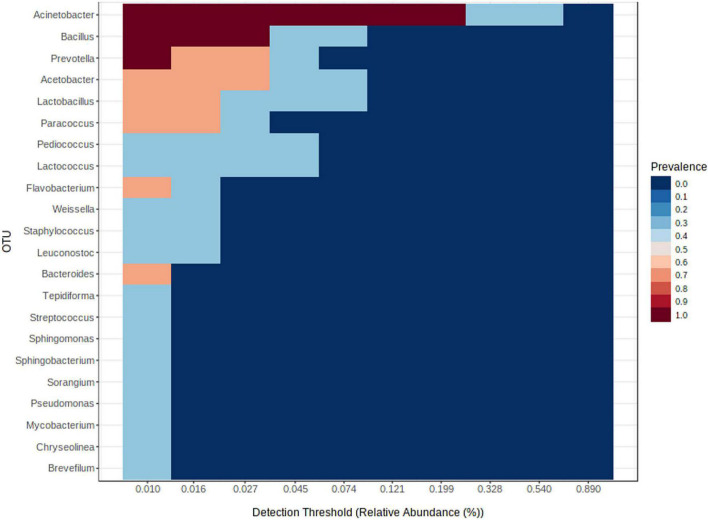
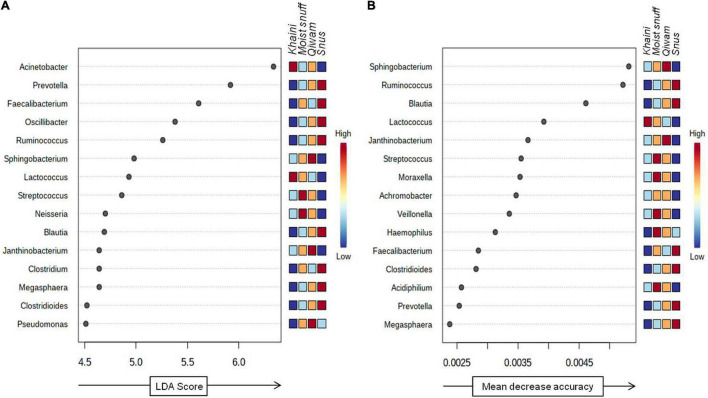
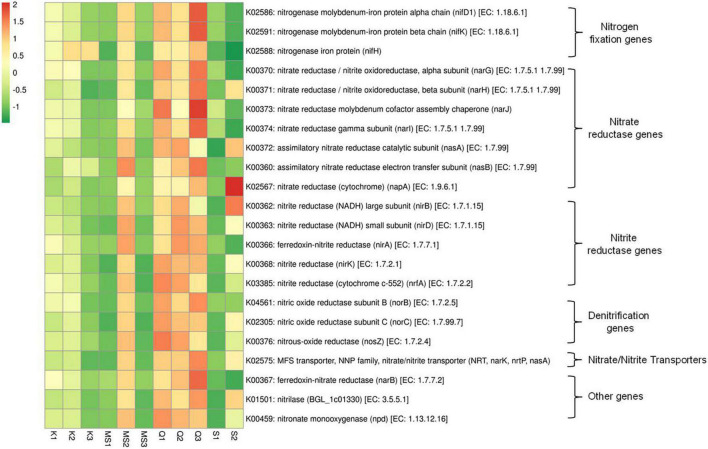
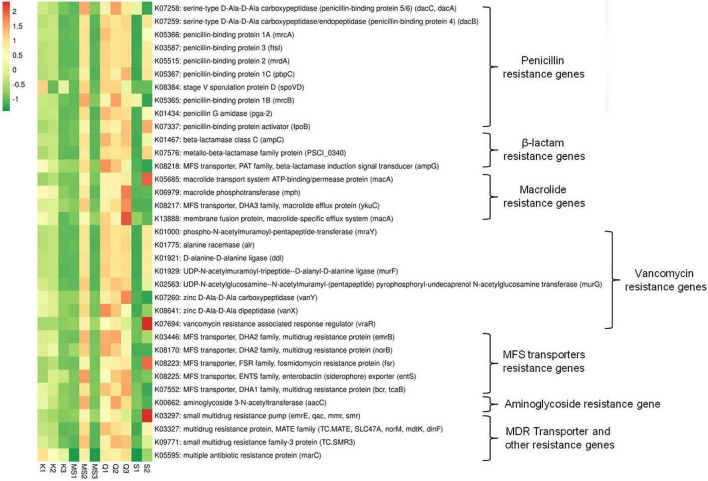
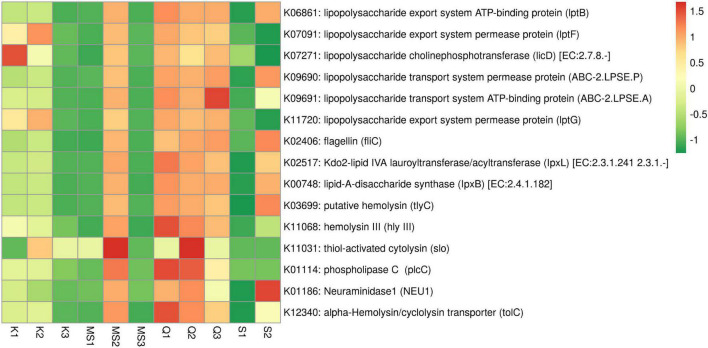
Smokeless tobacco products (STPs) carry assorted microbial population that contributes to carcinogens synthesis like tobacco-specific nitrosamines (TSNAs). Extensive exploration of microbiota-harboring STPs is required to understand their full carcinogenic potential. Here, we applied 16S rRNA gene sequencing to investigate bacteriome present in moist STPs immensely consumed in India (Khaini, Moist-snuff, Qiwam, and Snus). Further, the functional metagenome was speculated by PICRUSt (Phylogenetic Investigation of Communities by Reconstruction of Unobserved States) to assign the abundance of genes related to nitrogen metabolism, bacterial toxins, antibiotic drug resistance and other pro-inflammatory molecules. Highly diverse bacterial communities were observed in all moist STPs. Taxonomic analysis revealed a total of 549 genera belonging to four major phyla Proteobacteria, Firmicutes, Bacteroidetes and Actinobacteria. Overall, the core bacterial genera Acinetobacter, Bacillus, Prevotella, Acetobacter, Lactobacillus, Paracoccus, Flavobacterium, and Bacteroides were significantly abundant in moist STPs. Elevated moisture-holding products like Moist-snuff and Qiwam harbor rich bacterial species diversity and showed similar bacteriome composition. Furthermore, Qiwam products showed the highest level of genes associated with nitrogen metabolism, antibiotic resistance, toxins, and pro-inflammation (predicted by PICRUSt) which can contribute to the synthesis of TSNAs and induction of oral cancer. The present broad investigation of moist STPs-associated bacteriome prevalence and their detailed metabolic potential will provide novel insight into the oral carcinogenesis induced by STPs.

Keywords: antibiotic-resistance genes; nitrogen metabolism genes; oral cancer; smokeless tobacco products (STPs); smokeless tobacco-associated bacteriome; tobacco-specific nitrosamines (TSNAs); toxins.


Conflict of interest statement

The authors declare that the research was conducted in the absence of any commercial or financial relationships that could be construed as a potential conflict of interest.

Figures

FIGURE 1
FIGURE 1
β–diversity among moist smokeless tobacco products. Interactive 3D-Principal Coordinate Analysis (PCoA) plot for bacterial β-diversity in moist STPs and pie chart generated by the MicrobiomeAnalyst. (A) PCoA plot of 11 moist STPs derived from Bray–Curtis index showing the distance of bacterial communities present in Khaini, Moist-snuff, Snus, and Qiwam samples. The samples of each group are represented by different color as indicated on the above of the figure. The pie charts, (B) Khaini sample, K3 and (C) Snus sample, S2 are shown at the level of genera. (D) The error plot originated from random forest analysis. Overall genera present in moist STPs was represented by a red line, yellow-line indicate the distinct genera present in Khaini, green-line showed specific genera of Moist-snuff, blue-line represent unique genera of Qiwam and magenta line specify exclusive genera of Snus.
FIGURE 2
FIGURE 2
Bacterial phyla of moist smokeless tobacco products. (A) The stacked bar showed the relative abundance of bacterial phyla identified in each STPs. The OTUs > 10 reads were represented in their relative abundance. (B) The stacked bar showed the relative abundance of bacterial genera identified in each STPs. The OTUs > 100 reads were represented in their relative abundance. Each bacterial phylum is symbolized as a sequential color (red to blue) in the stacked bar graphs with the connecting lines. The entire relative abundance was calculated as 100% for each product.
FIGURE 3
FIGURE 3
Core bacteriome of moist smokeless tobacco products. The core bacterial genera in moist STPs determined by applying the parameters sample dominance (≥20%) and relative abundance (≥0.2%). Heatmap illustrating the detection threshold and relative abundances of the most dominant bacterial genera in tested moist STPs. The color key shows the range of threshold relative abundance of the individual values.
FIGURE 4
FIGURE 4
Co-occurrence of bacterial genera in moist smokeless tobacco products. The SparCC correlation of clinically relevant genera was generated and plotted in a heatmap. The scale bar on the right of the plot showed calculated positive and negative correlation values to generate the heatmap. The correlation threshold | >0.3 and p-value < 0.05.
FIGURE 5
FIGURE 5
Biomarker analysis of moist smokeless tobacco products-linked bacteriome. (A) Linear discriminant analysis Effect Size (LEfSe) of bacteriome present in moist STPs. The significant 15 genera were ranked in declining order as per their LDA scores (x-axis). (LEfSe parameters; Taxonomic level-genus, FDR-adjusted p-value cut off <0.1, log LDA score > 2.0). (B) The significant feature was identified by random forest analysis. The variable importance calculated by mean decrease in accuracy of predictor genera in the Random Forest model and top 15 genera were ranked in increasing order as per their mean decrease accuracy value (x-axis). The right heatmap plot designates whether the genera abundance were high (red) or low (blue) in each group of moist smokeless tobacco products.
FIGURE 6
FIGURE 6
Relative abundance of nitrogen metabolism pathway genes in moist smokeless tobacco products. Heatmap displaying the predicted genes identified using PICRUSt (y-axis) based on KEGG database in each sample of moist smokeless tobacco products (x-axis). Each column represents a SLT sample and each row nitrogen metabolism gene with relative abundance indicated by color bar.
FIGURE 7
FIGURE 7
Relative abundance of antibiotics resistance genes in moist smokeless tobacco products. Heatmap displaying the predicted genes identified using PICRUSt (y-axis) based on KEGG database in each sample of moist smokeless tobacco products (x-axis). Each column represents a SLT sample and each row antibiotic resistance gene with relative abundance indicated by color bar.
FIGURE 8
FIGURE 8
Relative abundance of imputed genes encoding toxins and pro-inflammatory molecules in moist smokeless tobacco products. Heatmap displaying the predicted genes identified using PICRUSt (y-axis) based on KEGG database in each sample of moist smokeless tobacco products (x-axis). Each column represents a moist STP sample and each row toxin/pro-inflammatory gene with relative abundance indicated by color bar.

References

    1. Al-Hebshi N. N., Alharbi F. A., Mahri M., Chen T. (2017). Differences in the bacteriome of smokeless tobacco products with different oral carcinogenicity: compositional and predicted functional analysis. Genes 8:106. 10.3390/genes8040106 - DOI - PMC - PubMed
    1. Alvarez L., Sanchez-Hevia D., Sánchez M., Berenguer J. (2019). A new family of nitrate/nitrite transporters involved in denitrification. Int. Microbiol. 22 19–28. 10.1007/s10123-018-0023-0 - DOI - PMC - PubMed
    1. Aslam B., Wang W., Arshad M. I., Khurshid M., Muzammil S., Rasool M. H., et al. (2018). Antibiotic resistance: a rundown of a global crisis. Infect. Drug Resist. 11 1645–1658. 10.2147/IDR.S173867 - DOI - PMC - PubMed
    1. Averill B. A. (1996). Dissimilatory nitrite and nitric oxide reductases. Chem. Rev. 96 2951–2964. 10.1021/cr950056p - DOI - PubMed
    1. Caporaso J. G., Kuczynski J., Stombaugh J., Bittinger K., Bushman F. D., Costello E. K., et al. (2010). QIIME allows analysis of high-throughput community sequencing data. Nat. Methods 7 335–336. 10.1038/nmeth.f.303 - DOI - PMC - PubMed

LinkOut - more resources