. 2021 Dec 22:12:729631.
doi: 10.3389/fimmu.2021.729631. eCollection 2021.

Proteasome α6 Subunit Negatively Regulates the JAK/STAT Pathway and Blood Cell Activation in Drosophila melanogaster

Affiliations

Proteasome α6 Subunit Negatively Regulates the JAK/STAT Pathway and Blood Cell Activation in Drosophila melanogaster

Mirva Järvelä-Stölting et al. Front Immunol. .

Abstract

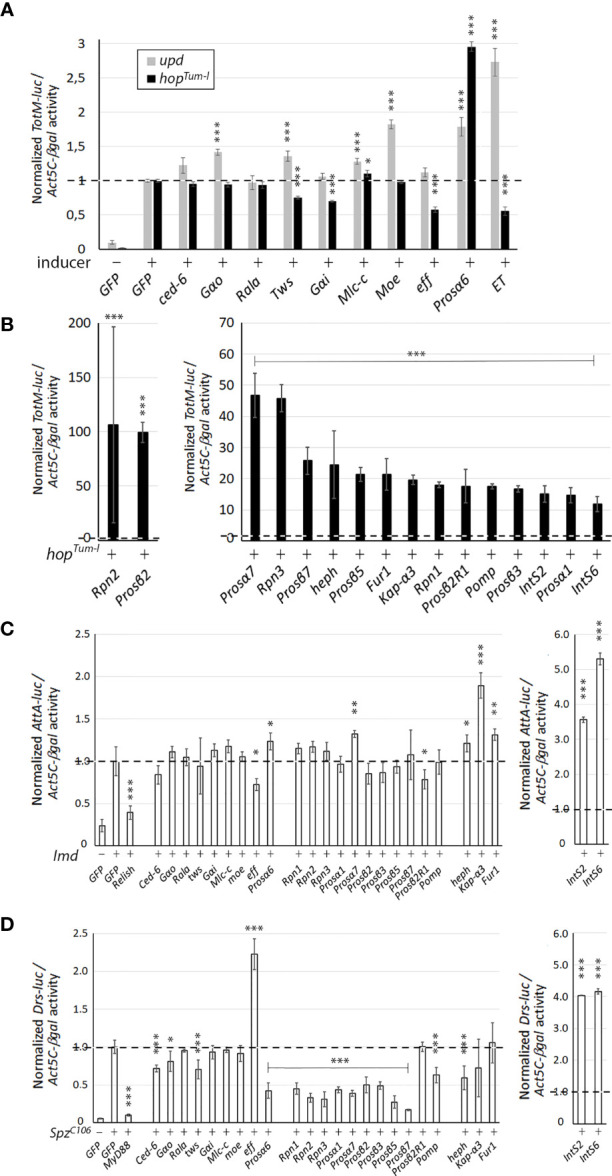
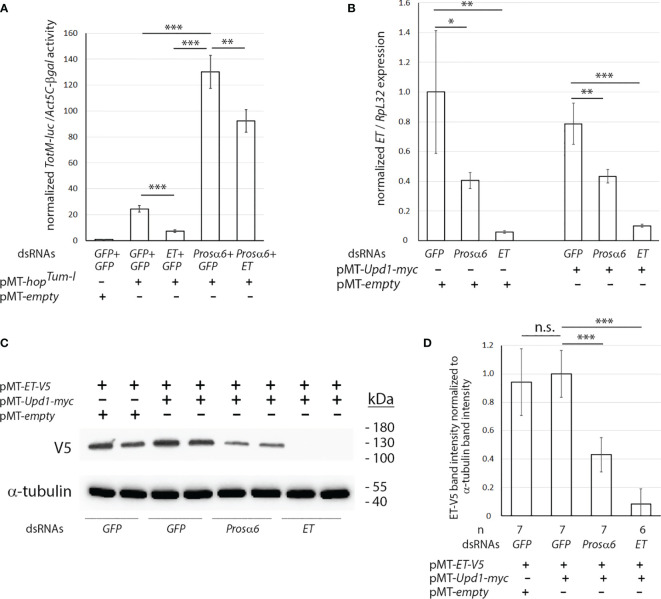
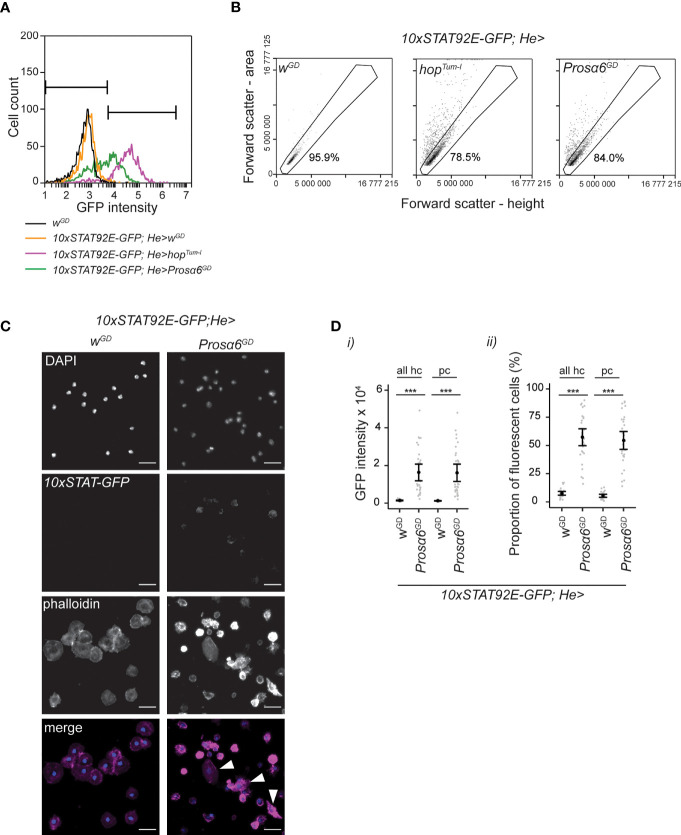
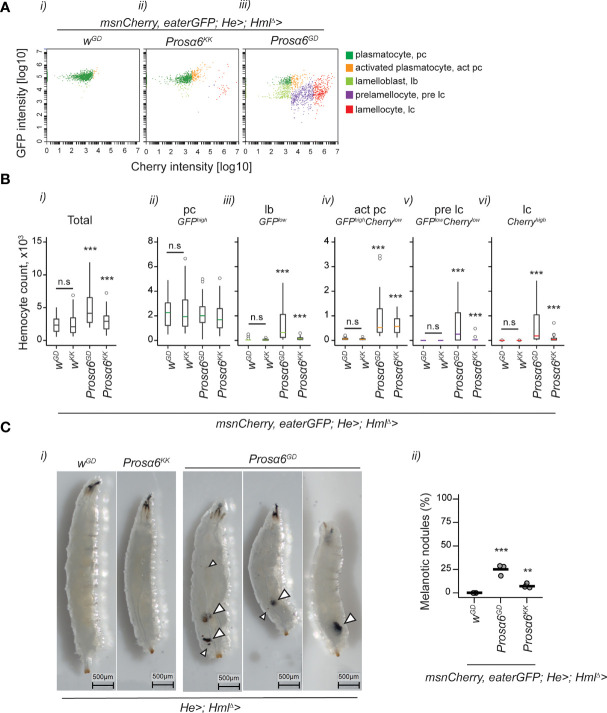
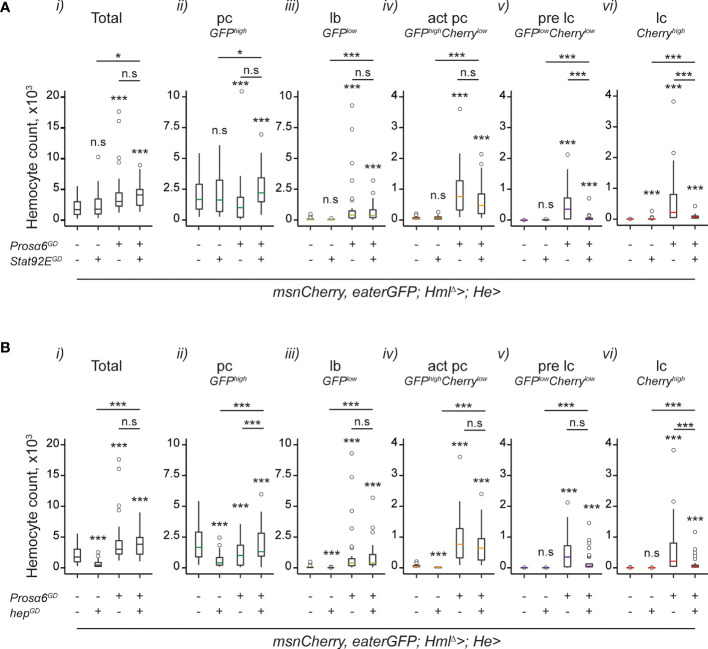
JAK/STAT signaling regulates central biological functions such as development, cell differentiation and immune responses. In Drosophila, misregulated JAK/STAT signaling in blood cells (hemocytes) induces their aberrant activation. Using mass spectrometry to analyze proteins associated with a negative regulator of the JAK/STAT pathway, and by performing a genome-wide RNAi screen, we identified several components of the proteasome complex as negative regulators of JAK/STAT signaling in Drosophila. A selected proteasome component, Prosα6, was studied further. In S2 cells, Prosα6 silencing decreased the amount of the known negative regulator of the pathway, ET, leading to enhanced expression of a JAK/STAT pathway reporter gene. Silencing of Prosα6 in vivo resulted in activation of the JAK/STAT pathway, leading to the formation of lamellocytes, a specific hemocyte type indicative of hemocyte activation. This hemocyte phenotype could be partially rescued by simultaneous knockdown of either the Drosophila STAT transcription factor, or MAPKK in the JNK-pathway. Our results suggest a role for the proteasome complex components in the JAK/STAT pathway in Drosophila blood cells both in vitro and in vivo.

Keywords: Drosophila melanogaster; Eye Transformer; JAK/STAT pathway; RNA interference; fruit fly; hemocyte; lamellocyte; the proteasome complex.


Conflict of interest statement

The authors declare that the research was conducted in the absence of any commercial or financial relationships that could be construed as a potential conflict of interest.

Figures

Figure 1
Figure 1
The effect of RNAi of the putative JAK/STAT pathway regulators on the Drosophila immunity pathways. (A) The effect of RNAi of putative ET interaction partners identified in the mass spectrometry study on the activation of the JAK/STAT pathway. The JAK/STAT pathway was induced by overexpression of Upd1 (gray bars) or hopTum-l (black bars) and the activation of the TotM-luc reporter was measured. (B) RNAi of the negative regulator candidates from the genome-wide screen in S2 cells causes hyperactivation of the pathway induced by overexpression of hopTum-l . (C) The effect of RNAi against the candidate genes identified in A and B on the Imd-induced Imd pathway reporter (AttA-luc) activity. (D) The effect of RNAi against the candidate genes identified in A and B on the SpzC106-induced Toll pathway reporter (Drs-luc) activity. In all reporter assays, n=4 per dsRNA treatment, and luciferase reporter values were normalized to the values of the Act5C-βgal reporter activity. The relative reporter activity value of cells with an activated pathway treated with the negative dsRNA control (GFP) is set to 1. Statistical analyses were carried out using Student t test for two samples assuming equal variances. *p, 0.05, **p, 0.01, ***p, 0.001. n.s., not significant.
Figure 2
Figure 2
Prosα6 silencing leads to reduced expression of ET and reduced amounts of the ET-V5 protein in S2 cells. (A) Double knockdown of ET and Prosα6 by dsRNA treatments in S2 cells had an additive effect to the hopTum-l -induced TotM-luc activity. (B) Knocking down Prosα6 caused a reduction in ET transcription (C, D) Knocking down Prosα6 by dsRNA treatment in S2 cells caused a reduction in the amount of the ET-V5 protein. (C) Example of one experiment. (D) Quantification of ET-V5 protein bands from three independent experiments, in total six or seven replicates per treatment. *p, 0.05, **p, 0.01, ***p, 0.001. n.s., not significant.
Figure 3
Figure 3
Prosα6 silencing in hemocytes activates JAK/STAT signaling. (A) Examples of GFP fluorescence intensity in non-fluorescent (wGD , black line), control (orange line), hopTum-l overexpressing (purple line) and in Prosα6 knockdown (green line) hemocytes. Note that in the figures the symbol “>“ denotes the presence of the GAL4/UAS system. The genotypes for control, hopTum-l overexpressing and Prosα6 knockdown animals are 10xSTAT92E-GFP;He-GAL4/wGD, 10xSTAT92E-GFP;He-GAL4/UAS-hopTum-l and 10xSTAT92E-GFP;He-GAL4/UAS-Prosα6GD , respectively. Bars mark GFP-negative (on the left) and GFP-positive (on the right) areas. (B) Hemocytes detected in 10xSTAT92E-GFP;He-GAL4/wGD , 10xSTAT92E-GFP;He-GAL4/UAS-hopTum-l and 10xSTAT92E-GFP;He-GAL4/UAS-Prosα6GD animals in forward scatter area vs. height plot. While in the controls (wGD ) most cells resided at a 45° angle in the area vs. height plot, the Prosα6 knockdown and hopTum-l overexpressing animals had hemocytes deviating from this area. Gated area represents hemocytes that are considered round (mainly non-activated plasmatocytes). Percentages represent the hemocytes falling into this gate in these example plots. 822 control, 2119 hopTum-l overexpression and 1857 Prosα6 knockdown cells were analyzed for (A, B). (C) Fluorescence microscopy of hemocytes from the control and Prosα6 knockdown larvae expressing the 10xSTAT-GFP and stained with the nuclear stain DAPI and the F-actin stain Phalloidin. Hemocytes with lamellocyte morphology (marked with arrowheads) were found in Prosα6 knockdown larvae but not in controls. Of note, DAPI staining appears dimmer in the Prosα6 knockdown sample, but this was likely due to slide-to-slide variation. Scale bars 10 µm. (D) Quantification of 10xSTAT-GFP signal intensity and percentage of fluorescent hemocytes in controls and in the Prosα6 knockdown animals. All hc, the whole hemocyte population; pc, hemocytes inside the gate shown in (B). Hemocytes were analyzed from two replicates of wGD (nine animals each) and three replicates of Prosα6GD (10 animals each), comprising of an order of 104 cells in each replicate. Error bars show mean and lower and upper confidence limits (cl). Grey dots represent individual animals. ***p < 0.001. Intensity values were analyzed using a Kruskal-Wallis rank sum test combined with Dunn’s post hoc test. The proportions of fluorescent cells were analyzed using a GLM with binomial distribution combined with Tukey’s post-hoc test.
Figure 4
Figure 4
Prosα6 silencing in hemocytes leads to an increase in total hemocyte numbers and to the formation of activated hemocytes. (A) Examples of flow cytometry plots showing hemocytes expressing eaterGFP (a plasmatocyte marker) and msnCherry (a lamellocyte marker). A wild-type larva had mainly eaterGFP-positive plasmatocytes (i), whereas Prosα6 silencing in hemocytes (msnCherry,eaterGFP;HmlΔ-GAL4;He-GAL4/UAS-Prosα6) resulted in the formation of lamellocytes (ii) or a full-blown activation of hemocytes (iii). (B) Quantification of total hemocytes (i) and each hemocyte class (ii-vi) from control (msnCherry,eaterGFP;HmlΔ-GAL4; He-GAL4/wGD and msnCherry,eaterGFP;HmlΔ-GAL4; He-GAL4/wKK ) larvae and from larvae with Prosα6 silencing in hemocytes (msnCherry,eaterGFP;HmlΔ-GAL4; He-GAL4/UAS-Prosα6 GD and msnCherry,eaterGFP;HmlΔ-GAL4; He-GAL4/UAS-Prosα6 KK). Each genotype was replicated three times, 10 animals in each replicate. Error bars show mean and lower and upper 95% confidence limits (cl). Grey dots represent individual animals. Data on hemocytes were analyzed using a negative binomial GLM. Stars indicate a significant difference when compared to the control sample. The two control backgrounds were also compared to each other. n.s., not significant; ***p < 0.001; pc, plasmatocyte; act pc, activated plasmatocyte; lb, lamelloblast; pre lc, prelamellocyte; lc, lamellocyte. (C), i) Examples of larvae without and with melanotic hemocyte aggregates of varying sizes, some of which are marked with arrowheads. For nodule quantification, each genotype was replicated three times, with 100 animals in each replicate (ii). Data were analyzed as a proportion of animals bearing nodules, using a GLM with binomial distribution combined with Tukey’s post-hoc test. ***p < 0.001; **p < 0.01.
Figure 5
Figure 5
Knocking down JAK/STAT and JNK pathway components in the Prosα6 background reduce the hemocyte activation caused by the Prosα6 silencing. (A) Effects of JAK/STAT pathway component Stat92E knockdown on Prosα6-induced hemocyte phenotype. i) Total hemocyte counts. ii-vi) Differential hemocyte counts. “-/+” indicate the presence of Prosα6 and Stat92E knockdowns. Stars refer to the statistical difference compared to the wild-type control larvae (msnCherry,eaterGFP;HmlΔ-GAL4;He-GAL4/wGD), the first sample in each plot. Underlined stars refer to the statistical difference of the simultaneous knockdown of Prosα6 and Stat92E (msnCherry,eaterGFP;HmlΔ-GAL4;He-GAL4/UAS- Prosα6GD;UAS-Stat92EGD ) to the single knockdowns of Prosα6 (short line) and Stat92E (longer line). (B) Effects of JNK pathway component hep knockdown on Prosα6-induced hemocyte phenotype. i) Total hemocyte counts. ii-vi) Differential hemocyte counts. “-/+” indicate the presence of Prosα6 and hep knockdowns. Stars refer to the statistical difference compared to the wild-type control larvae (msnCherry,eaterGFP;HmlΔ-GAL4;He-GAL4/wGD ), the first sample in each plot. Underlined stars refer to the statistical difference of the simultaneous knockdown of Prosα6 and hep (msnCherry,eaterGFP;HmlΔ-GAL4;He-GAL4/UAS- Prosα6GD;UAS-hepGD ) to the single knockdowns of Prosα6 (short line) and hep (longer line). Each genotype was replicated three times, except for the msnCherry,eaterGFP;HmlΔ-GAL4;He-GAL4/wGD control, which was replicated 6 times, 10 animals in each replicate. Note that the control and Prosα6 hemocyte data is the same in (A, B) and has been plotted separately for clarity. Statistical analyses have been conducted on the whole dataset and p-values adjusted according to multiple comparisons. Data was analyzed using a negative binomial GLM. n.s., not significant; *p < 0.05; ***p < 0.001; pc, plasmatocyte; act pc, activated plasmatocyte; lb, lamelloblast; pre lc, prelamellocyte; lc, lamellocyte.

Similar articles

Cited by

References

    1. Vigano S, Perreau M, Pantaleo G, Harari A. Positive and Negative Regulation of Cellular Immune Responses in Physiologic Conditions and Diseases. Clin Dev Immunol (2012) 2012:485781. doi: 10.1155/2012/485781 - DOI - PMC - PubMed
    1. Horwitz DA, Fahmy TM, Piccirillo CA, La Cava A. Rebalancing Immune Homeostasis to Treat Autoimmune Diseases. Trends Immunol (2019) 40:888–908. doi: 10.1016/j.it.2019.08.003 - DOI - PMC - PubMed
    1. Baeg GH, Zhou R, Perrimon N. Genome-Wide Rnai Analysis of JAK/STAT Signaling Components in Drosophila . Genes Dev (2005) 19:1861–70. doi: 10.1101/gad.1320705 - DOI - PMC - PubMed
    1. Cokic VP, Mitrovic-Ajtic O, Beleslin-Cokic BB, Markovic D, Buac M, Diklic M, et al. . Proinflammatory Cytokine IL-6 and JAK-STAT Signaling Pathway in Myeloproliferative Neoplasms. Mediators Inflamm (2015) 2015:453020. doi: 10.1155/2015/453020 - DOI - PMC - PubMed
    1. O’Sullivan JM, Harrison CN. JAK-STAT Signaling in the Therapeutic Landscape of Myeloproliferative Neoplasms. Mol Cell Endocrinol (2017) 451:71–9. doi: 10.1016/j.mce.2017.01.050 - DOI - PubMed

Publication types

LinkOut - more resources